1) The article discusses the importance of properly determining sample size in medical research studies. Sample size is one of the most common reasons researchers consult statisticians.
2) Studies with too small of a sample size will likely be unable to detect clinically important effects and thus be scientifically useless and unethical. However, studies with unnecessarily large samples can also be deemed unethical due to unnecessary involvement of extra subjects.
3) The concept of statistical power, which is the likelihood of a test detecting a true difference or effect of a given size, is important for determining an appropriate sample size that balances scientific validity with ethical considerations. Methods like power calculations, graphs, and nomograms can help researchers prospectively determine adequate
Combination of informative biomarkers in small pilot studies and estimation ...LEGATO project
Background:
Biomarker candidates are defined as measurable molecules found in biological media. According to Biomarkers Definitions Working Group, 2001, biomarkers cover a rather wide range of parameters. Recently, biomarkers are used widely in medical researches, where single biomarkers may not possess the desired cause-effect association for disease classification and outcome prediction. Therefore the efforts of the researchers currently is to combine biomarkers. By new technologies like microarrays, next generation sequencing and mass spectrometry, researchers can obtain many biomarker candidates that can exceed tens of thousands. To avoid wasting money and time, it is suggested to control the number of patients strictly. However, pilot studies usually have low statistical power which reduces the chance of detecting a true effect .
Practical Methods To Overcome Sample Size ChallengesnQuery
Watch the video at: https://www.statsols.com/webinars/practical-methods-to-overcome-sample-size-challenges
In this webinar hosted by Ronan Fitzpatrick - Head of Statistics and nQuery Lead Researcher at Statsols - we will examine some of the most common practical challenges you will experience while calculating sample size for your study. These challenges will be split into two categories:
1. Overcoming Sample Size Calculation Challenges
(Survival Analysis Example)
We will examine practical methods to overcome common sample size calculation issues by focusing in on one of the more complex areas for sample size determination; Survival analysis. We will cover difficulties and potential issues surrounding challenges such as:
Drop Out: How to deal with expected dropouts or censoring. We compare the simple loss-to-follow-up method and integrating a dropout process into the sample size model?
Planning Uncertainty: How best to deal with the inevitable uncertainty at the planning stage? We examine how best to apply a sensitivity analysis and Bayesian approaches to explore the uncertainty in your sample size calculations.
Choosing the Effect Size: Various approaches and interpretations exist for how to find the effect size value. We examine those contrasting interpretations and determine the best method and also how to deal with parameterization options.
2. Overcoming Study Design Challenges
(Vaccine Efficacy Example)
The Randomised Controlled Trial (RCT) is considered the gold standard in trial design in drug development. However, there are often practical impediments which mean that adjustments or pragmatic approaches are needed for some trials and studies.
We will examine practical methods how to overcome common study design challenges and how these affect your sample size calculations. In this webinar, we will use common issues in vaccine study design to examine difficulties surrounding issues such as:
Case-Control Analysis: We will examine how to deal with study constraints and how to deal with analyses done during an observational study.
Alternative Randomization Methods: How best to address randomization in your vaccine trial design when full randomization is difficult, expensive or impractical. We examine how sample size calculations are affected with cluster or Mendelian randomization.
Rare Events: How does an outcome being rare affect the types of study design and statistical methods chosen in your study.
When designing a clinical study, a fundamental aspect is the sample size. In this article, we describe the rationale for sample size calculations, when it should be calculated and describe the components necessary to calculate it. For simple studies, standard formulae can be
used; however, for more advanced studies, it is generally necessary to use specialized statistical software programs and consult a biostatistician. Sample size calculations for non-randomized studies are also discussed and two clinical examples are used for illustration
Minimizing Risk In Phase II and III Sample Size CalculationnQuery
[ Watch Webinar: http://bit.ly/2thIgmi ]. In this free webinar, Head of Statistics at Statsols, Ronan Fitzpatrick, addresses the issues of reducing risk in Phase II/III sample size calculations. Topics covered will include:
Sample Size Determination For Different Trial Designs
Bayesian Sample Size Determination
Sample Size For Survival Analysis
& more
5 essential steps for sample size determination in clinical trials slidesharenQuery
In this free webinar hosted by nQuery Researcher & Statistician Eimear Keyes, we map out the 5 essential steps for sample size determination in clinical trials. At each step, Eimear will highlight the important function it plays and how to avoid the errors that will negatively impact your sample size determination and therefore your study.
Watch the Video: https://www.statsols.com/webinar/the-5-essential-steps-for-sample-size-determination
A comment in Nature, signed by over 800 researchers, called for a rise up against statistical significance. This was followed by a special issue of The American Statistician aimed at halting the use of the term "statistically significant", and new guidelines for statistical reporting in the New England Journal of Medicine. These slides discuss the broader context of the "p-value crisis" and alternatives for communicating the conclusions after statistical analyses.
Target audience: Medical researchers; Scientists involved in conducting or interpreting analyses and communicating the results of scientific research, as well as readers of scientific publications.
Learning objectives:
To understand the context of the reproducibility crisis in medical research.
To learn about problems with p-values and alternatives to report findings.
To understand how (not) to interpret significant and insignificant findings.
To learn how to communicate research findings in a modest, thoughtful, and transparent way.
Power Analysis: Determining Sample Size for Quantitative StudiesStatistics Solutions
In this webinar, we go over how to determine the appropriate sample size for a quantitative study by using power analysis. The presentation includes an explanation of what a power analysis is and examples of how to conduct power analyses for common statistical tests. The presentation focuses on power analysis using G*Power and Intellectus Statistics software programs. Sample size calculations for more advanced analyses are briefly discussed.
Sample size calculation in medical researchKannan Iyanar
A short description on estimation of sample size in health care research. It describes the basic concepts in sample size estimation and various important formulae used for it.
This presentation is meant to help choose the appropriate statistical analysis for IBDP Biology IAs. It was created as support for teachers but also useful for students.
Within the presentation, we discuss different types of biological data, and how to describe and analyse it using mathematics.
A short introduction to sample size estimation for Research methodology workshop at Dr. BVP RMC, Pravara Institute of Medical Sciences(DU), Loni by Dr. Mandar Baviskar
Hypothesis Testing. Inferential Statistics pt. 2John Labrador
A hypothesis test is a statistical test that is used to determine whether there is enough evidence in a sample of data to infer that a certain condition is true for the entire population. A hypothesis test examines two opposing hypotheses about a population: the null hypothesis and the alternative hypothesis.
Check out this brief paper if you want to know more about P value calculations. There is a misconception that a very small p value means the difference between groups is highly relevant. Looking at the p value alone deviates our attention from the effect size. Consider an experiment in which 10 subjects receive a placebo, and another 10 receive an experimental diuretic. After 8 h, the average urine output in the placebo group is 769 mL, versus 814 mL in the diuretic group—a difference of 45 mL. How do we know if that difference means the drug works and is not just a result of chance? Read on and let me know if you have any questions...
BUS308 – Week 5 Lecture 1 A Different View Expected Ou.docxcurwenmichaela
BUS308 – Week 5 Lecture 1
A Different View
Expected Outcomes
After reading this lecture, the student should be familiar with:
1. What a confidence interval for a statistic is.
2. What a confidence interval for differences is.
3. The difference between statistical and practical significance.
4. The meaning of an Effect Size measure.
Overview
Years ago, a comedy show used to introduce new skits with the phrase “and now for
something completely different.” That seems appropriate for this week’s material.
This week we will look at evaluating our data results in somewhat different ways. One of
the criticisms of the hypothesis testing procedure is that it only shows one value, when it is
reasonably clear that a number of different values would also cause us to reject or not reject a
null hypothesis of no difference. Many managers and researchers would like to see what these
values could be; and, in particular, what are the extreme values as help in making decisions.
Confidence intervals will help us here.
The other criticism of the hypothesis testing procedure is that we can “manage” the
results, or ensure that we will reject the null, by manipulating the sample size. For example, if
we have a difference in a customer preference between two products of only 1%, is this a big
deal? Given the uncertainty contained in sample results, we might tend to think that we can
safely ignore this result. However, if we were to use a sample of, say, 10,000, we would find
that this difference is statistically significant. This, for many, seems to fly in the face of
reasonableness. We will look at a measure of “practical significance,” meaning the likelihood of
the difference being worth paying any attention to, called the effect size to help us here.
Confidence Intervals
A confidence interval is a range of values that, based upon the sample results, most likely
contains the actual population parameter. The “most likely” element is the level of confidence
attached to the interval, 95% confidence interval, 90% confidence interval, 99% confidence
interval, etc. They can be created at any time, with or without performing a statistical test, such
as the t-test.
A confidence interval may be expressed as a range (45 to 51% of the town’s population
support the proposal) or as a mean or proportion with a margin of error (48% of the town
supports the proposal, with a margin of error of 3%). This last format is frequently seen with
opinion poll results, and simply means that you should add and subtract this margin of error from
the reported proportion to obtain the range. With either format, the confidence percent should
also be provided.
Confidence intervals for a single mean (or proportion) are fairly straightforward to
understand, and relate to t-test outcomes simply. Details on how to construct the interval will be
given in this week’s second lecture. We want to understand how to interpret and understa.
Exploring Abhay Bhutada’s Views After Poonawalla Fincorp’s Collaboration With...beulahfernandes8
The financial landscape in India has witnessed a significant development with the recent collaboration between Poonawalla Fincorp and IndusInd Bank.
The launch of the co-branded credit card, the IndusInd Bank Poonawalla Fincorp eLITE RuPay Platinum Credit Card, marks a major milestone for both entities.
This strategic move aims to redefine and elevate the banking experience for customers.
Currently pi network is not tradable on binance or any other exchange because we are still in the enclosed mainnet.
Right now the only way to sell pi coins is by trading with a verified merchant.
What is a pi merchant?
A pi merchant is someone verified by pi network team and allowed to barter pi coins for goods and services.
Since pi network is not doing any pre-sale The only way exchanges like binance/huobi or crypto whales can get pi is by buying from miners. And a merchant stands in between the exchanges and the miners.
I will leave the telegram contact of my personal pi merchant. I and my friends has traded more than 6000pi coins successfully
Tele-gram
@Pi_vendor_247
how to sell pi coins at high rate quickly.DOT TECH
Where can I sell my pi coins at a high rate.
Pi is not launched yet on any exchange. But one can easily sell his or her pi coins to investors who want to hold pi till mainnet launch.
This means crypto whales want to hold pi. And you can get a good rate for selling pi to them. I will leave the telegram contact of my personal pi vendor below.
A vendor is someone who buys from a miner and resell it to a holder or crypto whale.
Here is the telegram contact of my vendor:
@Pi_vendor_247
how can i use my minded pi coins I need some funds.DOT TECH
If you are interested in selling your pi coins, i have a verified pi merchant, who buys pi coins and resell them to exchanges looking forward to hold till mainnet launch.
Because the core team has announced that pi network will not be doing any pre-sale. The only way exchanges like huobi, bitmart and hotbit can get pi is by buying from miners.
Now a merchant stands in between these exchanges and the miners. As a link to make transactions smooth. Because right now in the enclosed mainnet you can't sell pi coins your self. You need the help of a merchant,
i will leave the telegram contact of my personal pi merchant below. 👇 I and my friends has traded more than 3000pi coins with him successfully.
@Pi_vendor_247
Even tho Pi network is not listed on any exchange yet.
Buying/Selling or investing in pi network coins is highly possible through the help of vendors. You can buy from vendors[ buy directly from the pi network miners and resell it]. I will leave the telegram contact of my personal vendor.
@Pi_vendor_247
The European Unemployment Puzzle: implications from population agingGRAPE
We study the link between the evolving age structure of the working population and unemployment. We build a large new Keynesian OLG model with a realistic age structure, labor market frictions, sticky prices, and aggregate shocks. Once calibrated to the European economy, we quantify the extent to which demographic changes over the last three decades have contributed to the decline of the unemployment rate. Our findings yield important implications for the future evolution of unemployment given the anticipated further aging of the working population in Europe. We also quantify the implications for optimal monetary policy: lowering inflation volatility becomes less costly in terms of GDP and unemployment volatility, which hints that optimal monetary policy may be more hawkish in an aging society. Finally, our results also propose a partial reversal of the European-US unemployment puzzle due to the fact that the share of young workers is expected to remain robust in the US.
when will pi network coin be available on crypto exchange.DOT TECH
There is no set date for when Pi coins will enter the market.
However, the developers are working hard to get them released as soon as possible.
Once they are available, users will be able to exchange other cryptocurrencies for Pi coins on designated exchanges.
But for now the only way to sell your pi coins is through verified pi vendor.
Here is the telegram contact of my personal pi vendor
@Pi_vendor_247
how to sell pi coins on Bitmart crypto exchangeDOT TECH
Yes. Pi network coins can be exchanged but not on bitmart exchange. Because pi network is still in the enclosed mainnet. The only way pioneers are able to trade pi coins is by reselling the pi coins to pi verified merchants.
A verified merchant is someone who buys pi network coins and resell it to exchanges looking forward to hold till mainnet launch.
I will leave the telegram contact of my personal pi merchant to trade with.
@Pi_vendor_247
Introduction to Indian Financial System ()Avanish Goel
The financial system of a country is an important tool for economic development of the country, as it helps in creation of wealth by linking savings with investments.
It facilitates the flow of funds form the households (savers) to business firms (investors) to aid in wealth creation and development of both the parties
where can I find a legit pi merchant onlineDOT TECH
Yes. This is very easy what you need is a recommendation from someone who has successfully traded pi coins before with a merchant.
Who is a pi merchant?
A pi merchant is someone who buys pi network coins and resell them to Investors looking forward to hold thousands of pi coins before the open mainnet.
I will leave the telegram contact of my personal pi merchant to trade with
@Pi_vendor_247
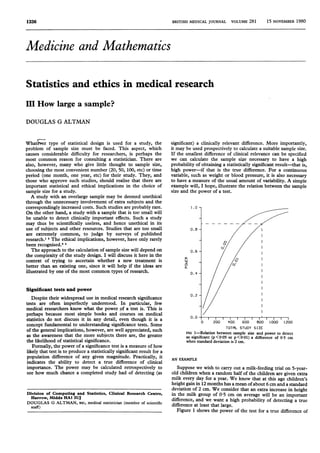
1. BRITISH MEDICAL JOURNAL VOLUmE 281 15 NOVEMBER 1980
Medicine and Mathematics
Statistics and ethics in medical research
III How large a sample?
DOUGLAS G ALTMAN
Whatw~r type of statistical design is used for a study, the
problem of sample size must be faced. This aspect, which
causes considerable difficulty for researchers, is perhaps the
most common reason for consulting a statistician. There are
also, however, many who give little thought to sample size,
choosing the most convenient number (20, 50, 100, etc) or time
period (one month, one year, etc) for their study. They, and
those who approve such studies, should realise that there are
important statistical and ethical implications in the choice of
sample size for a study.
A study with an overlarge sample may be deemed unethical
through the unnecessary involvement of extra subjects and the
correspondingly increased costs. Such studies are probably rare.
On the other hand, a study with a sample that is too small will
be unable to detect clinically important effects. Such a study
may thus be scientifically useless, and hence unethical in its
use of subjects and other resources. Studies that are too small
are extremely common, to judge by surveys of published
research.1 2 The ethical implications, however, have only rarely
been recognised.3'
The approach to the calculation of sample size will depend on
the complexity of the study design. I will discuss it here in the
context of trying to ascertain whether a new treatment is
better than an existing one, since it will help if the ideas are
illustrated by one of the most common types of research.
Significant tests and power
Despite their widespread use in medical research significance
tests are often imperfectly understood. In particular, few
medical researchers know what the power of a test is. This is
perhaps because most simple books and courses on medical
statistics do not discuss it in any detail, even though it is a
concept fundamental to understanding significance tests. Some
of the general implications, however, are well appreciated, such
as the awareness that the more subjects there are, the greater
the likelihood of statistical significance.
Formally, the power of a significance test is a measure of how
likely that test is to produce a statistically significant result for a
population difference of any given magnitude. Practically, it
indicates the ability to detect a true difference of clinical
importance. The power may be calculated retrospectively to
see how much chance a completed study had of detecting (as
significant) a clinically relevant difference. More importantly,
it may be used prospectively to calculate a suitable sample size.
If the smallest difference of clinical relevance can be specified
we can calculate the sample size necessary to have a high
probability of obtaining a statistically significant result-that is,
high power-if that is the true difference. For a continuous
variable, such as weight or blood pressure, it is also necessary
to have a measure of the usual amount of variability. A simple
example will, I hope, illustrate the relation between the sample
size and the power of a test.
1.0
0.
0.
0~
Li
0
0.4
0.2
0.
0 200 400 600 600 1000 1200
TOTAL sTuDr SIZE
FIG 1-Relation between sample size and power to detect
as significant (p<005 or p<001) a difference of 05 cm
when standard deviation is 2 cm.
AN EXAMPLE
Suppose we wish to carry out a milk-feeding trial on 5-year-
old children when a random half of the children are given extra
milk every day for a year. We know that at this age children's
height gain in 12 months has a mean ofabout 6 cm and a standard
deviation of 2 cm. We consider that an extra increase in height
in the milk group of 0 5 cm on average will be an important
difference, and we want a high probability of detecting a true
difference at least that large.
Figure 1 shows the power of the test for a true difference of
Division of Computing and Statistics, Clinical Research Centre,
Harrow, Middx HAl 3UJ
DOUGLAS G ALTMAN, BSC, medical statistician (member of scientific
staff)
1336
2. BRITISH MEDICAL JOURNAL VOLUME 281
0.0
0'1
0.2
0-3
0*4
c
1- 0-5
I.-
v06-o 0-6
N
as 0 7
c
-
(I)
0-8
0'9
1*0
1*1
N
Y 005
0.01
- 0-995
- 0-99
098
- O-97
- 0*96
- 0-95
- 090
0-85
- O'80
- 0-75
- 070
065
- O'60
- 0*55
- 0*50
0*45
- 01,0
0-35
- O'30
- 0'25
0-20
-v0
0'15
-0.10
1*2 -J
FIG 2-Nomogram for a two-sample comparison
and significance level.
of a continuous variable, relating
SIG L 0-05
LEVEL
power, total study size, the standardised difference,
0 5 cm. The increase in power with increasing sample size is
clearly seen, as is the relation with the significance level. For
any given sample size the probability of obtaining a result
significant at either the 5% or 1% level, given a true difference
in growth of 0-5 cm, can be read off. Power of 80-90% is
recommended; fig 1 shows that to achieve an 85% chance of
detecting the specified difference of 0 5 cm significant at the
1 % level, we would need a total of about 840 children.
If we are told that we can have at most 500 children in all,
what will the power be now ? Figure 1 shows that the power
drops from 85% to 60%. We are now more than twice as
likely to miss a true difference of0 5 cm at the 1% level, although
the power is still about 80% for a test at the 5% level of
significance. Alternatively, and not shown by fig 1, this size of
study achieves the same power as the larger one for a difference
of 0-65 cm instead of 0-5 cm. Whether or not this is thought
sufficient will depend on how far one is prepared to alter one's
criteria of acceptability for the sake of expediency. Although
they are to some extent arbitrary, it is generally advisable to
stick closely to the prestated criteria.
A NEW SIMPLE METHOD
The formula on which these calculations are based is not
particularly simple. Graphs are preferable, but because so
many variables are concerned, a large set of graphs like fig 1
would be necessary to calculate sample size for any problem.
Greater flexibility, however, is achieved by the nomogram shown
in fig 2. This makes use of the standardised difference, which is
equal to the postulated true difference (usually the smallest
medically relevant difference) divided by the estimated standard
deviation. So in the previous example the standardised difference
of interest was 0 5/2 0=0 25. The nomogram is appropriate
for calculating power for a two-sample comparison of a con-
tinuous measurement with the same number of subjects in each
15 NOVEMBER 1980 1337
3. 1338 BRITISH MEDICAL JOURNAL VOLUME 281 15 NOVEMBER 1980
group. The only restriction is the common requirement that
the variable that is being measured is roughly Normally
distributed.
The nomogram gives the relation between the standardised
difference, the total study size, the power, and the level of
significance. Given the significance level (5% or 1°h),* by
joining with a straight line the specific values for two of the
variables the required value for the other variable can easily
be read off the third scale. By using this nomogram, it is both
simple and quick to assess the effect on the power of varying
the sample size, the effect on the required sample size ofchanging
the difference of importance, and so on. It is easy to confirm
the earlier calculations for the milk-feeding trial.
An estimate of the standard deviation should usually be
available, either from previous studies or from a pilot study.
Note that the nomogram is not strictly appropriate for retro-
spective calculations. Although it will be reasonably close for
samples larger than 100, for smaller samples it will tend to
overestimate the power.
QUALITATIVE DATA
For many studies the outcome measure is not continuous but
qualitative-for example, where one is looking for the presence
or absence of some condition or comparing survival rates.
Peto et al5 have discussed calculating sample size for such
studies, and they emphasise the problem of getting enough
subjects when either the condition is rare or the expected
improvement is not large. For example, about 1600 subjects
would be needed to have a power of90% ofdetecting (at p <0 05)
a reduction in mortality from 15% to 10%. Although the sample
size will in general need to be much larger for studies including
qualitative outcome measures, the logic behind the calculations
is exactly the same as with continuous data, except that a prior
estimate of the standard deviation is not needed. Several
authors have published graphs for general use.6-8
OTHER TYPES OF STUDY
Sequential designs are similarly amenable to the incorporation
of considerations of power at the design stage. Indeed, it is
probably much more common here than for ordinary randomised
studies. For these, and for more complicated designs, it may
be particularly helpful to enlist the aid of a statistician when
thinking about sample size.
Conclusions
The idea behind using the concept of power to calculate
sample size is to maximise, so far as practicable, the chances of
finding a real and important effect if it is there, and to enable
us to be reasonably sure that a negative finding is strong grounds
for believing that there is no important difference. The effect
of the approach outlined above is to make clinical importance
and statistical significance coincide, thus avoiding a common
problem of interpretation.
Before embarking on a study the appropriate sample size
should be calculated. If not enough subjects are available then
the study should not be carried out or some additional source
of subjects should be found.5 (It should also be borne in mind
that expected accession rates tend to be over-optimistic.) The
calculations affecting sample size and power should be reported
when publishing results. A study2 of 172 randomised controlled
trials published in the New England J7ournal of Medicine and
the Lancet from 1973 to 1976 found that none mentioned a
prior estimate of the required sample size, and none specified a
clinically relevant difference that might allow calculation of the
*As in the example these are two-tailed significance levels.
power of their study. Obviously in most of these studies such
calculations were not done.
It is surprising and worrying that in such an ethically
sensitive area as clinical trials so little attention has been given
to an aspect that can have major ethical consequences. If the
sample size is too small there is an increased risk of a false-
negative finding. A recent survey' of 71 supposedly negative
trials found that two-thirds of them had at least a 10% risk of
missing a true improvement of 50%. In only one of the 71
studies was power mentioned as having been considered before
carrying out the study. It is surely ethically indefensible to
carry out a study with only a small chance of detecting a
treatment effect unless it is a massive one, and with a con-
sequently high probability of failure to detect an important
therapeutic effect.
This is the third in a series of eight articles.
No reprints will be available from the authors.
References
Freiman JA, Chalmers TC, Smith H, Kuebler RR. The importance of
beta, the type II error and sample size in the design and interpretation
of the randomized control trial. N EnglJ7 Med 1978;299:690-4.
2 Ambroz A, Chalmers TC, Smith H, Schroeder B, Freiman JA, Shareck
EP. Deficiencies of randomized control trials. Clinical Research 1978;
26:280A.
3 Newell DJ. Type II errors and ethics. Br MedJ 1978;iv:1789.
4 Anonymous. Controlled trials: planned deception? Lancet 1979;i:534-5.
5Peto R, Pike MC, Armitage P, et al. Design and analysis of randomized
clinical trials requiring prolonged observation of each patient. I Intro-
duction and design. BrJ' Cancer 1976;34;585-612.
6 Aleong J, Bartlett DE. Improved graphs for calculating sample sizes
when comparing two independent binomial distributions. Biometrics
1979 ;35 :875-81.
Boag JW, Haybittle JL, Fowler JF, Emery EW. The number of patients
required in a clinical trial. BrJ Radiol 1971 ;44:122-5.
8 Mould RF. Clinical trial design in cancer. Clin Radiol 1979;30:371-81.
A right-handed 46-year-old stonemason developed a right axillary vein
thrombosis. No haematological, biochemical, or physical abnormalities
were found to account for his thrombosis, and he has recovered well
taking anticoagulants. Might his condition have been related to his
occupation ?
It might have been, especially if he had had a spell off work. Axillary
vein thrombosis commonly results from unaccustomed use of the arm,
including upward movements that compress the vein between clavicle
and first rib.
What are the health hazards of taking small babies to public swimming
pools ?
Mother and baby bathing is a rewarding experience for both parent
and child. It aids physical development of the baby and augments the
psychological "bonding." Many public bathing pools have special
mother (father) and baby bathing sessions, and those interested are
advised to try to use this facility. There is the safety advantage of a
poolside attendant being present. The best age to start for the baby is
from 9 to 12 months, although some enthusiasts may start earlier.
Much depends on the development of the baby and the confidence of
the parent. The pool should be reasonably warm, between 80-85°F
(26-30°C) (most public baths are 70-75°F (21-240C)), and it is most
important to let the baby gain confidence by holding him and only
gradually allowing independence in the water. It is preferable to
have only parents and babies in the pool, as excited older children
shouting and splashing may be frightening. It is unwise to take a baby
bathing until at least 1-1 hours after his last meal. There is no more
risk of contracting any infection than in any other social activity, and
provided the parent is not over-enthusiastic the chance of an accident
is negligible. Small babies take to bathing readily, and parents who
have used the special sessions confirm that parent and baby bathing is
well worth while.