Download as PDF, PPTX

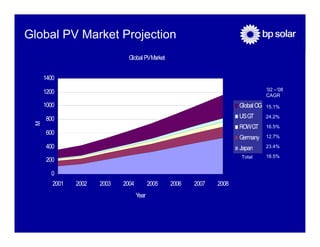
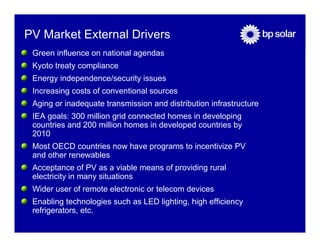

The global photovoltaic (PV) market is growing rapidly, exceeding 500 MW in 2003. Japan has become the largest PV market at 225 MW in 2003, with grid-connected applications now dominating over 70% of the global demand. Key drivers of continued PV market growth include policies supporting renewable energy for reasons such as compliance with Kyoto protocols, energy independence, and rural electrification goals. The document projects the global PV market will have a compound annual growth rate of 18.5% through 2008.


