SlideShare a Scribd company logo
1 of 26
Download to read offline
BOOK
TITLE : Pianura Padana geo-morphology, climate condition prevalence
and distribution of COVID -19 and some other respiratory virus:
Hypotesis of work.
Authors:
1 )mauro luisetto IMA ACADEMY natural science and toxicology branch Italy
29121
2)Naseer Almukthar, Professor, Department of Physiology /College of Medicine,
University of Babylon, Iraq
3) Prof. Giulio Tarro Primario emerito dell’ Azienda Ospedaliera “D. Cotugno”,
Napoli
Chairman della Commissione sulle Biotecnologie della Virosfera, WABT -
UNESCO, Parigi
Rector of the University Thomas More U.P.T.M., Rome
Presidente della Fondazione de Beaumont Bonelli per le ricerche sul cancro -
ONLUS, Napoli
4) Ghulam Rasool Mashori, Full Professor of pharmacology ,Peoples university
of medical and health sciences for Women, Nawabshah,Pakistan
5) Ahmed Yesvi Rafa ,Founder and President, Yugen Research Organization,
Western Michigan University, MI, USA
6) Oleg yurevich Latyshev President of IMA academy RU
Keywords :PIANURA PADANA (an Italian area), geomorphological, climate
condition ,covid -19 diffusion ,Worsening factors, air pollution, Regional
mortality rate variability, infection speed , coronavirus belt, wind speed
,meteorological factors, humidity, temperature ,latitude, viruses airborne
transmission
*Corresponding Author: mauro Luisetto , IMA Academy Natural Science,
maurolu65@gmail.com
CHAPTHER 1 ) Abstract
In order to enrich and expand this topic information whit an update searches,
new studies and allows widely benefits international.
Hence this work was written in Italian and English languages.
The recent study was verified the statistical hypotesis of prevalence and
distribution of covid- 19 related some
Relevant division of high way in italy ( especially north regions ) .
The geomorphological characteristic of PIANURA PADANA , an area located in
Italia which is also
Named PO valley ( a low area land between hills and mountains)
This area is surrounded from the north by a close connection with a serial
range ALPI mountains and from south by APPENINI MOUNTAINS have created
since ancient time particular climate condition.
If we observe diffusion of covid -19 in italy at today date is possible to verify a
sort of different velocity in diffusion between north region vs the other .
There are obvious relationship between this “ closed environment “ and
diffusion of some relevant virus?
Pianura padana is famous for its kind of climate with lots of fog in some season,
but also for air pollution as reported by EPHA and other organization.
CHAPTHER 2 ) Introduction
It seem that Italian presence and diffusion of covid -19 depends on some
travelers that comes from Wu han and other infected region of the globe, but it
is interesting to notice that the strange diffusion of virus in north Italia not in a
close association with the fact that Chinese from this region not arrive in
south cities of Italy using other european airport.
Starting from this fact we analyze , with an observational approach ( visual
methods) some figure related
PIANURA PADANA geomorphografic condition and its related climate
condition and the recent study asses to verify as hypotesis of work diffusion of
virus according great north high way in the area of north italia.
As Italia is also like a PENINSULA therefore it show high development north
south.
From 35 grades latitude south ( Lampedusa isle ) to 47 grades latitudes north (
ALPI AURINE ) .
FIG. N 1 Italy zone : continental peninsular , insular
It seem that there are I Italy 2 different velocity for diffusion of covid-19 : with
north showing very fast vs south that appear more slowly.
Can be related to the famous PIANURA PADANA climate and its enhancement
conditions as well as to air pollution raise due to a huge of factories ? as
industrial area?
All this must be related to the lockdown Italian measure in march – April 2020,
and the red zone of the first phases of virus diffusion in north of Italy.
According a recent interview (18 april 2020) to Professor F. Prodi famous
CLIMATOLOGIST by italian journal it was reported:
“conta il vento, altro grande assente dalla Pianura Padana. Esso diluisce le
concentrazioni degli inquinanti, redistribuendoli negli strati più alti e attenua la
forza contagiosa del virus “.
And in the same interview: “Sono molto preoccupato. La clausura, il distacco
sociale, vengono imposti come unica soluzione possibile per contrastare la
diffusione del Covid-19, implicitamente attribuendo il contagio alla sola
interazione tra persone. Ma non è così, tant'è che la segregazione degli
individui all'interno delle loro abitazioni fatica a portare i vantaggi attesi, pur
essendo al momento assolutamente necessaria.”
All this variable must be strictly applied to the lockdown of Italian measure in
march – April 2020, and the red zone of the first stages of virus diffusion in
north of Italia.
CHAPTHER 3 ) Material and methods
A monitoring approach point out observing some figure related to the topics of
this works and some global relevant literature conclusion is produced to
submit for a wide range of researchers for a new research topics.
From literature and on line resource :
According https://www.scienzainrete.it/articolo/coronavirus-ha-viaggiato-
autostrada/giovanni-sebastiani/2020-04-09
An hypotesis of work is related some characteristic of Italian relevant way of
travel communication .
“La diffusione è maggiore vicino ai grandi nodi autostradali» ( spread is greater
near the major motor-way junctions)
Figure n 2 Italian high way – covid -19 distribution work SEBASTIANI 2020
As the diffusion or transport of coronavirus seem to follow great travel
communication pathway.
North Italia is a known as real industrial area and present whit a high
interconnection more then that of the south region.
However, connected with other part of Italia but also it connected with other
world regions.
It is a fact that today some north Italian region are most involved in viruses
diffusion.
In addiction, to other fact shown in this region of north italia there are ALPI
MOUNTAIN and in south part there are existence of the APPENNINI
MOUNTAINS that function and create an particular climate conditions :
PIANURA PADANA
Besides ,other fact proved that in this AREA have great level of air pollution as
it were previously mentioned in many scientific publications.
The mortality rate is variable in all italia region but in Lombardia mortality
represented about 17,9% ( in 7 april 2020)
While in general medium data of mortality in Italy reach about 12,5%, but if
we excluded lombardia region this percent will become 9%.
However , this data depends on the real number of infected peoples ( this data
demonstrate of some problems to be correctly detected related to the
laboratory diagnostic )
Figure n. 3 covid -19 distribution Italy February- march 2020
CHAPTER 4) Results
As reported in SEBASTIANI work it is interesting to observe that the APPENINI
MOUNTAIN seem to be a Kind of natural limit that acts as restricted barriers for
spread or diffusion of COVID -19 in high rate( until today).
Anyhow ,this not mean that the diffusion will not go to the south of Italy: now
various cases are registered but what Relevant is the velocity in this process.
In various publication relationship related diffusion of some relevant virus and
air pollution are showed
And the same the influence of latitude and humidity rate, as it were
aforementioned by other Italian researchers .
In a recent POSITION PAPER: “Relazione circa l’effetto dell’inquinamento da
particolato atmosferico e la diffusione di virus nella popolazione” univ. BARI,
BOLOGNA e SIMA :
“Si evidenzia come la specificità della velocità di incremento dei casi di
contagio che ha
interessato in particolare alcune zone del Nord Italia potrebbe essere legata
alle condizioni di
inquinamento da particolato atmosferico che ha esercitato un’azione di carrier
di
boost.
Come già riportato in casi precedenti di elevata diffusione di infezione virale in
relazione ad
elevati livelli di contaminazione da particolato atmosferico, si suggerisce di
tenere conto di
questo contributo sollecitando misure restrittive di contenimento
dell’inquinamento.” (3)
Figure n. 4 PIANURA PADANA and geographic morphology :ALPI mountain in
north and APPENINI in the south part
Figure n 5 Air pollution north Italy N02
Fig. 6 ITALY diffusion covid- 19 April 2020
Fig 7 Lombardia region involvement
(7 march 2020),formhttps://primapavia.it/cronaca/coronavirus-tutta-la-
lombardia-diventa-zona-rossa/
According PROTEZIONE CIVILE ITALY 12 april 2020:
“i casi attualmente- positivi sono 31.265 in Lombardia, 13.672 in Emilia-
Romagna, 12.505 in Piemonte, 10.729 in Veneto, 6.162 in Toscana, 3.817 nel
Lazio, 3.333 in Liguria, 3.114 nelle Marche, 3.057 in Campania, 2.452 in Puglia,
2.082 nella Provincia- autonoma di Trento, 2.030 in Sicilia, 1.742 in Abruzzo,
1.326 in Friuli Venezia Giulia, 1.515 nella Provincia autonoma di Bolzano, 903 in
Sardegna, 795 in Calabria, 687 in Umbria, 588 in Valle d’Aosta, 277 in
Basilicata e 202 in Molise.”
Accordin article published in
https://www.lastampa.it/blogs/2017/11/07/news/inquinamento-atmosferico-
perche-l-aria-della-pianura-padana-e-tra-le-peggiori-d-europa-1.37181946
“climate Network Inquinamento- atmosferico: perché l’aria della Pianura
Padana è tra le peggiori d’Europa?
La relazione è semplice: più polveri, più malattie. Ogni anno questa realtà si
rende- evidente, visibile all’occhio e percepibile dai polmoni
Inquinamento atmosferico: perché l’aria della Pianura Padana è tra le peggiori
d’Europa?
Non vogliamo rinunciare all’automobile.
Non riusciamo a- rinunciare al riscaldamento.
Non possiamo rinunciare all’agricoltura.Ma stiamo rinunciando alla nostra-
salute.
La relazione è semplice: più polveri, più malattie. Ogni anno questa realtà si
rende evidente, visibile all’occhio e percepibile dai polmoni. Secondo l’Agenzia
Europea per l’Ambiente -(EEA) oggi l’inquinamento-- atmosferico provoca
461mila decessi -prematuri l’anno solo in Europa, 20 volte di più delle vittime
per incidenti stradali. Per chi abita in Pianura Padana, una delle zone più
inquinate del continente, sembra un destino inevitabile.
Ma l’inquinamento sta aumentando? Quali sono le cause principali? Come
possiamo difenderci? Il Centro Epson Meteo risponde a queste domande,
impegnandosi nel percorso verso un’aria di qualità. I dati sorprendono: le
principali fonti di PM10 sono estremamente -diversificate, dalle pizze cotte a
legna alle cattive pratiche agricole. L’analisi della Presidente di Italian Climate-
Network S. Giacomin.
L’inquinamento sta davvero aumentando sempre di più?
Prendiamo la Lombardia, ben rappresentativa delle concentrazioni complessive
del bacino padano e i cui dati d’inquinamento (in particolare delle polveri
sottili, PM10 su cui ci concentreremo) sono ampiamente disponibili sul sito
dell’ARPA della- Regione. Nonostante le oscillazioni nelle concentrazioni di PM
determinate anche dalle condizioni meteorologiche, i dati dimostrano una
tendenza al miglioramento negli ultimi- decenni. L’aria resta troppo inquinata,
ma l’inquinamento è in calo. Le concentrazioni che si misurano oggi sono
anche di ordini di grandezza inferiori a quelle rilevate negli anni ‘70 ,‘80 e ‘90
del secolo scorso. Uno sforzo mirabile per la Pianura Padana, ma comunque
non sufficiente per rientrare nei limiti di legge (d.lgs 155/2010 che ha recepito
la direttiva- Ue sulla qualità dell’aria) abbondantemente- superati tutti gli anni.
Quali sono le condizioni meteo che tappano il ‘catino padano’?
“I fattori orografici e meteorologici contribuiscono in modo significativo alle
elevate concentrazioni di inquinanti atmosferici che fanno della Val Padana una
delle zone più inquinante d’Europa, nonostante le emissioni siano paragonabili
a quelle di altre aree- sviluppate” - conferma il meteorologo del Centro Epson--
Meteo Flavio Galbiati - “questo perché il ‘catino’ padano è circondato dalla
catena montuosa alpina che influenza il regime dei venti, la cui intensità risulta
generalmente molto debole. Un altro importante fattore è l’elevata frequenza
di situazioni meteorologiche caratterizzate da stabilità atmosferica. Queste
condizioni, tipiche del semestre invernale in caso di alta pressione, hanno
origine dal fenomeno meteorologico dell’inversione termica. In pratica in
atmosfera la temperatura non diminuisce salendo di quota, come ci si
aspetterebbe, ma ad un’altezza di 800/1000 metri si riscontra una temperatura
più alta di quella dello strato- inferiore. Si modifica così la circolazione- locale
dell’aria: quella più fredda dei bassi strati, essendo più densa e più pesante,
non può sollevarsi verticalmente oltre la quota dell’inversione. Si viene a creare
quindi un vero e proprio ‘tappo’ che impedisce il ricambio d’aria, intrappolando
gli inquinanti in prossimità del suolo, dove la loro concentrazione, giorno- dopo
giorno, non potrà che aumentare”. (4)
According Marc Lipsitch et al:“Controlled influenza transmission studies
conducted in mice in the 1960s were the first to suggest that transmissibility
varied with temperature, relative humidity, and season . Experimental-
infections in humans further high-lighted seasonal variation in disease severity
and in the rate of immune sero-conversion . Most recently, the concept that
temperature and relative humidity may alter influenza transmission has been
confirmed in a guinea-pig model . These data, together with laboratory
experiments testing virus survival under- controlled environmental conditions ,
are carefully revisited in the new study by Shaman and Kohn .
Additional evidence on mechanisms of seasonality comes from- population-
level studies, which typically attempt to correlate fluctuation in meteorological
variables with influenza epidemiological data in a specific locale.
reinterpretation of experimental data on survival of airborne influenza virus
particles demonstrates that virus- survival increases with low levels of vapor
pressure. The authors note that vapor pressure is minimal during winter in
indoor and outdoor settings in temperate regions and conclude that vapor
-pressure is a parsimonious mechanism of influenza seasonality, consistent
with increased disease transmission in winter.”(5)
Jeffrey Shaman et al: “Influenza A incidence peaks during winter in temperate-
regions. The basis for this pronounced seasonality is not understood, nor is it
well documented how influenza A transmission principally occurs. Previous-
studies indicate that relative humidity (RH) affects both influenza virus
transmission (IVT) and influenza virus survival (IVS). we reanalyze these data
to explore the effects of absolute humidity on IVT and IVS. We find that
absolute humidity (AH) constrains both trans-mission efficiency and IVS much
more significantly than RH. In the studies presented, 50% of IVT variability and
90% of IVS variability are explained by AH, whereas, respectively, only 12%
and 36% are explained by RH. In temperate -regions, both outdoor and indoor
AH possess a strong seasonal- cycle that minimizes in winter. This seasonal
cycle is consistent with a wintertime increase in IVS and IVT and may explain
the seasonality of influenza. Thus, differences in AH provide a single, coherent,
more physically sound explanation for the observed variability of IVS, IVT and
influenza seasonality in temperate regions. This hypothesis can be further
tested through future, additional laboratory, epidemiological and modeling
studies.Absolute- humidity is predicted to increase in a warming -world . The
findings presented here indicate that such changes would decrease IVS and IVT
rates. This potential outcome, as well as any effects on the seasonality of
influenza -incidence, needs to be explored carefully through additional
laboratory and modeling experiments”.(6)
According a Preprint SCAFETTA N :“This paper investigates whether the
Severe Acute Respiratory Syndrome CoronaVirus 2 (SARSCoV-2) pandemic –
also known as CoronaVIrus Disease 19 (COVID-19) – could have been favored
by specific weather- conditions. It was found that the 2020 winter weather in
the region of Wuhan (Hubei, Central China) – where the virus first broke out in
December and spread widely from January to February 2020–was strikingly
similar to that of the Northern Italian provinces of Milan, Brescia and Bergamo,
where the pandemic has been very severe from February to March. The
similarity suggests that this pandemic worsens under weather temperatures-
between 4°C and 11°C. Based on this result, specific isotherm world- maps
were generated to locate, month by month, the world regions that share similar
temperature ranges. From January to March, this isotherm zone extended
mostly from Central- China toward Iran, Turkey, West-Mediterranean- Europe
(Italy, Spain and France) up to the United State of America, coinciding with the
geographic regions most affected by the pandemic from January to March. It is
predicted that next spring,as the weather gets warm,the pandemic will likely
worsenin northern regions(United Kingdom, Germany, East Europe, Russia and
-North America)while the situation will likely improve in the southern
regions(Italy and Spain). However,in autumn,the pandemic could come back
and affect the same regions again. The Tropical- Zone and the entire Southern
Hemisphere, but in restricted southern- regions, could avoid a strong pandemic
because of the sufficiently warm weather during the entire year. Google-Earth-
Pro interactive-maps are provided as supplements”(7)
Chen P-s et al :“The spread of influenza and highly pathogenic avian- influenza
(H5N1) presents a significant threat to human health. Avian influenza outbreaks
in downwind areas of Asian dust storms (ADS) suggest that viruses might be
transported by dust -storms
We developed a technique to measure ambient- influenza and avian influenza
viruses. We then used this technique to measure concentrations of these
viruses on ADS days and background days, and to assess the relationships
between ambient influenza and avian influenza viruses, and air pollutants.
A high-volume air sampler was used in parallel with a filter cassette to evaluate
spiked- samples and un-spiked samples. Then, air samples were monitored
during ADS seasons using a filter- cassette coupled with a real-time
quantitative polymerase chain reaction (qPCR) assay. Air samples were
monitored during ADS- season (1 January to 31 May 2006).
We successfully quantified ambient influenza virus using the filtration/real-time
qPCR method during ADS days and back-ground days. this is the first report
describing the concentration of influenza virus in ambient air. In both the
spiked and un-spiked samples, the concentration of influenza virus sampled
using the filter cassette was higher than that using the high-volume sampler.
The concentration of ambient influenza- A virus was significantly higher during
the ADS days than during the background days.
Our data imply the possibility of long-range transport of influenza virus.”
Cui et al :“Ecologic analysis conducted among 5 regions with 100 or more
SARS cases showed that case fatality rate increased with the increment of API
(case fatality = - 0.063 + 0.001 * API). Partially ecologic study based on short-
term exposure demonstrated that SARS- patients from regions with moderate
APIs had an 84% increased risk of dying from SARS compared to those from
regions with low APIs (RR = 1.84, 95% CI: 1.41–2.40). Similarly, SARS patients
from regions with high APIs were twice as likely to die from SARS compared to
those from regions with low- APIs. (RR = 2.18, 95% CI: 1.31–3.65). Partially
ecologic analysis based on long-term exposure to ambient air pollution showed
the similar- association.
Our studies demonstrated a positive- association between air pollution and
SARS case fatality in Chinese population by utilizing publicly- accessible data
on SARS statistics and air pollution indices. Although ecologic fallacy and
uncontrolled confounding effect might have biased the results, the possibility of
a detrimental effect of air pollution on the prognosis of SARS patients deserves
further investigation” (9)
Q YE et al :“This study investigated whether respiratory syncytial virus (RSV)
infection in children was associated with ambient temperature and air-
pollutants in Hangzhou-China. A distributed lag non-linear model (DLNM) was
used to estimate the effects of daily meteorological data and air
pollutants on the incidence of RSV infection among children. A total of 3650
childhood RSV infection cases were included in the study. The highest air-
pollutant concentrations were in January to May and October to December
during the year. The yearly RSV-positive rate was 10.0 % among children with
an average age of 4.3 months. The highest RSV-positive rate occurred among
patients 0 to 3 months old. Children under 6.5 months old accounted for 80 %
of the total patients infected by RSV. A negative correlation was found between
ambient- temperature and RSV infection, and it was strongest with minimum
-ambient temperature (r = −0.804, P < 0.001). There was a positive correlation
between the infection rate and the particulate matter (PM) 2.5 (r = 0.446, P <
0.001), PM10 (r = 0.397, P < 0.001), SO2 (r = 0.389, P < 0.001), NO2 (r =
0.365, P < 0.001) and CO (r = 0.532, P < 0.001). The current study suggested
that temperature was an important- factor associated with RSV infection
among children in Hangzhou. Air pollutants significantly increased the risk of
RSV infection with dosage, lag and cumulative effects.” (10)
“the unprecedented 2015 outbreaks of highly pathogenic avian influenza (HPAI)
H5N2 in the U.S. devastated its poultry industry and resulted in over $3 billion
economic impacts. Today HPAI continues eroding poultry operations and
disrupting animal protein supply- chains around the world. Anecdotal evidence
in 2015 suggested that in some cases the AI virus was aerially introduced into
poultry houses, as abnormal bird- mortality started near air inlets of the
infected houses. This study modeled air- movement trajectories and virus
concentrations that were used to assess the probability or risk of airborne
transmission for the 77 HPAI cases in Iowa. The results show that majority of
the positive cases in Iowa might have received airborne- virus, carried by fine
particulate matter, from infected farms within the state (i.e., intrastate) and
infected farms from the neighboring states (i.e., interstate). The modeled
airborne- virus concentrations at the Iowa recipient sites never exceeded the
minimal infective doses for poultry; however, the continuous exposure might
have increased airborne- infection risks. In the worst-case scenario (i.e.,
maximum virus shedding rate, highest emission- rate, and longest half-life), 33
Iowa cases had > 10% (three cases > 50%) infection probability, indicating a
medium to high risk of airborne- transmission for these cases. Probability of
airborne HPAI infection could be affected by farm type, flock size, and distance
to previously infected farms; and more importantly, it can be markedly reduced
by swift depopulation and inlet air filtration. The research results provide
insights into the risk of airborne- transmission of HPAI virus via fine dust
particles and the importance of preventative and containment strategies such
as air filtration and quick depopulation of infected flocks.”(11)
According a Preprint :“Oliveiros et al. regressed the doubling time of COVID-19
cases by temperature and humidity, and they did not find significant
association for wind speed. In our study, though wind- speed was not an
important factor if modeled singly, it is a necessary factor in the final model
and adding wind speed in the model would significantly improve model
prediction performance”(12)
According L.Settis et al preprint “we present the first results of the analyses
that we have performed on 34 PM10 samples of outdoor/airborne PM10 from
an industrial site of Bergamo Province, collected with two different air
samplers over a continuous 3-weeks period, from February 21 st to March 13
th. Because of the nature of the sample, and considering that the sampling
has not been carried out for clinical- diagnostic purposes but for environmental
-pollution tests (taking also into account that filters were stored for at least
four weeks before undergoing molecular genetic analyses, as consequence of
the Italian shutdown), we can confirm to have reasonably demonstrated the
presence of SARS-CoV-2 viral RNA by detecting highly specific “RtDR gene” on
8 filters.”(13)
According to L.Morawska et al : “Is it likely that the SARS-CoV-2 virus spreads
by air? Its predecessor, SARS-CoV-1, did spread in the air. This was reported in
several studies and retrospectively explained the pathway of transmission in
Hong- Kong’s Prince of Wales Hospital (Li et al., 2005, Xiao et al., 2017;12., Yu
et al., 2005), as well as in health care facilities in Toronto, Canada (Booth et al.
2005), and in aircraft (Olsen et al. 2003). These studies concluded that airborne
transmission was the main transmission route in the indoor cases studied.
Other examples of airborne transmission of viral- infections include the spread
of Norwalk-like virus between school children (Marks et al. 2003), and the
transmission of influenza A/H5N1 virus between ferrets (Herfst et al. 2012). A
World Health Organization (WHO 2009)- review of the evidence stated that viral
infectious diseases can be transmitted across distances relevant to indoor
environments by aerosols (e.g. airborne infections), and can result in large
clusters of infection in a short period. Considering the many similarities
between the two SARS viruses and the evidence on virus- transport in general,
it is highly likely that the SARS-CoV-2 virus also spreads by air (Fineberg 2020).
Experts in droplet dynamics and airflow in buildings agree on this (Lewis
2020).”(14)
According Sander Hersft et al :“Highly pathogenic avian influenza A/H5N1 virus
can cause morbidity and mortality in humans but thus far has not acquired the
ability to be transmitted by aerosol or respiratory droplet (“airborne
-transmission”) between humans. To address the concern that the virus could
acquire this ability under natural conditions, we genetically modified A/H5N1
virus by site-directed mutagenesis and subsequent serial passage in ferrets.
The genetically modified A/H5N1 virus acquired mutations during passage in
ferrets, ultimately becoming airborne- transmissible in ferrets. None of the
recipient ferrets died after airborne infection with the mutant A/H5N1 viruses.
Four amino acid substitutions in the host receptor-binding protein
hemagglutinin, and one in the polymerase complex protein basic polymerase 2,
were consistently present in airborne-transmitted viruses. The transmissible-
viruses were sensitive to the antiviral drug oseltamivir and reacted well with
antisera raised against H5 influenza vaccine strains. Thus, avian A/H5N1
influenza viruses can acquire the capacity for airborne transmission between
mammals without recombination in an intermediate host and therefore
constitute a risk for human pandemic influenza.” (16)
According YU IT et al in an article published in new England journal of medicine
2004 was written:
“There is uncertainty about the mode of transmission of the severe acute
respiratory syndrome SARS - virus. We analyzed the temporal and spatial
distributions of cases in a large community outbreak of SARS in Hong Kong and
examined the correlation of these data with the three-dimensional spread of a
virus-laden aerosol plume that was modeled using studies of airflow -dynamics.
We determined the distribution of the initial 187 cases of SARS in the Amoy-
Gardens housing complex in 2003 according to the date of onset and location
of residence. We then studied the association between the location (building,
floor, and direction the apartment unit faced) and the probability of infection
using logistic- regression. The spread of the airborne, virus-laden aerosols
generated by the index patient was modeled with the use of airflow-dynamics
studies, including studies performed with the use of computational fluid-
dynamics and multizone modeling. For building E, apartment units (not
persons) on the middle and upper floors had higher probabilities of infection
than did units on lower floors, with an odds ratio of 5.15 (95 percent
confidence interval,2.6 to 10.3; P<0.001) for the middle floors and 3.1 (95
percent confidence interval, 1.6 to 6.2; P<0.01) for the upper floors. The risk of
infection was highest (odds ratio, 14.5; 95 percent confidence interval, 5.5 to
38.4) for units that faced direction Ab
(unit 8 on each floor), and it was also significantly elevated in apartment units
that faced direction
Ad (unit 7) . The units that faced directions Da (unit 6) and Dc (unit 5) appeared
to have a
slightly lower risk of infection than the other- units.
Results of the test for heterogeneity were statistically significant (P<0.001) for
both floor level and direction.
For buildings B, C, and D, the variation among the three categories of floor
level was statistically-
significant (P = 0.01), but the variation among the eight directions was of only
borderline significance (P = 0.06). For middle-level floors and for directions Ad,
Ba, and Da there was a significantly higher risk of infection than on the lower
-floors and in direction Cb, respectively. In the analyses stratified ac- cording to
building, only the model for building C showed significant heterogeneity among
floor levels and directions. The odds ratios for the middle- level floors (16.3)
and for apartment units coded Da (9.9) were statistically significant, whereas
those for the upper-level floors (7.2) and for units coded Ad (6.4) were of
borderline significance. Lo- cation (floor level and direction) was not statistically
significant for buildings B and D., in building B, all apartment units with
windows that faced direction D (either at the front or the side) — that is, the
direction from which the wind blew from building E — had high odds ratios,
between 0 and 5.2;
An investigative team from the World Health Organization found that traps in
the floor
drains in many of the housing units seemed not to have been filled with water
for long periods; the seals in the traps thus dried out, and as a result, a
connection was opened to the vertical soil stack (drainage pipe).
The investigative- team suggested that an exhaust fan that was running
behind a closed
door in the bathroom could have drawn fine drop- lets or aerosols from the soil
stack into the bathroom through the unsealed floor drain and thereby
contaminated the bathroom. The exhaust fan could have transported
contaminated droplets or aerosols from the bathroom into the air shaft. These
contaminated- droplets or aerosols could have been carried
upward by the natural air current and could have entered other apartment
units, even units several floors away from the source of infection, if the virus-
laden aerosols had reached an open window in building D, two directions the
windows faced were of borderline significance — namely, Ab(odds ratio, 6.3)
and Ba (odds ratio, 6.3). We repeated the modeling assuming five or six
residents in each unit and obtained similar results (data not shown).
Our epidemiologic- analysis, experimental studies, and airflow simulations
support
the probability of an airborne spread of the SARS virus in the outbreak in Amoy
Gardens. Virus-laden aerosols generated in the vertical soil stack of unit 7 in
building E returned to the bathroom through the dried-up seals of the floor-
drain traps and then entered the air shaft, probably by means of suction
created by an exhaust fan. The aerosols moved up-ward owing to the buoyancy
of the warm, humid air within the air shaft and could enter apartment units
that bordered the air shaft on the upper floors because of the negative
pressure created by the exhaust fans or the action of wind- flows around the
building.
The horizontal spread of infection to other units in building E was by movement
of the air between
apartment units. After the plume reached the top of the air shaft in building E,
the virus was spread to some units at certain heights in buildings B, C, and D
by the action of a predominant northeasterly wind.
Our hypothesis adequately explains the temporal and spatial distribution of
cases of SARS.
This hypothesis remains to be confirmed by further analytic epidemiologic,
environmental, and experimental -studies and should have important public
health implications for the prevention and control of SARS, should the disease
recur.
Airborne spread of the virus appears to explain this large community outbreak
of SARS, and future efforts at prevention and control must take into
consideration the potential for airborne- spread of this virus.”(17)
Figure n. 8 Distribution of Cases of SARS Infection in Buildings A to G in the
Amoy Gardens Housing Estate. ( from reference n 17 )
The prevailing wind (red- arrows) during the period of possible exposure was
northeasterly, or roughly perpendicular to the exterior walls of apartment units
Dc and Da in building E. The distance between buildings E and B is 60 m. The
direction from which the wind -blew shifted from nearly north to east and even
southeast. The red dot in building E indicates the unit that the index patient-
visited. The directional indicator for the units at the lower right-hand corner
indicates the direction each unit faced. In the directional code (Ab, Ad, Ba, Bc,
Cb, Cd, Da, Dc) used to designate an apartment unit, uppercase letters denote
front-facing windows and lowercase letters side-facing windows.
Fig. n 9 Model of the Movement of the Virus-Laden Plume. ( from reference n. 17)
According to our computational fluid-dynamics modeling, the buoyant plume (blue)
rose from the air shaft between two- housing units in building E (yellow) and was
carried by a northeasterly wind toward the middle-level floors in buildings C and D.
The L-shape structure (Panels A and B) was a nearby construction site that blocked the
wind flowing toward lower-level floors in buildings E, C, and D. The wake flow of the
construction site created a region of negative air- pressure in the space between
buildings E, C, and D (Panel B) that caused the plume to bend downward, toward
buildings C and D
Finally it is interesting to observe that in 8 of march following some news about
a RED ZONE in lombardia by institution produced lots of people in the night to
go in south- region using train.
But it is not possible to verify if in this people there was or not positive one to
covid -19.
This fact can be a factor to be taken in consideration in the diffusion of virus in
south.
Fig. 10 Median annual ITALIA temperature
Related climate is possible to verify that , observing fig.8 it seem there are 2
different ZONE
In north vs south.
Fig. 11 world most polluted regions No2
Fig.12 coronavirus belt – latitude
screenshot from the University of Maryland study shows coronavirus hotspots
along the same climate band. (Screengrab)
Fig. 13v 11 gennaio 2020 Pressione al suolo e vettori vento Pianura padana
And according Prof. Giulio Tarro related covid -19 spread in Italy:
“In Italy the regions more hit are the same ones that have the greatest
productive activity and therefore more millions of tons of special products.”(18)
CHAPTER 5) Discussion and conclusion
The HYPOTESYS of this work It is ranged as opinions of the authors to verify if
the climate condition of PIANURA PADANA and air pollution level may
contribute or not in the speed and severity of global covid -19 great diffusion
in north of Italy as a severe disease.
Factors such kind of geomorphological environment with specific climate
condition and natural separation by mountains presence at north and south
of italia.
In this study the strange velocity in diffusion in north vs south of Italy need new
research: observing lethality rate of Lombardia 17,9 % vs 9 % of the rest of
Italy it seem that could be 2 different AREA in Italy related this virus diffusion.
Latitude, climate , air pollution and what other factor acts ? as well as to known
people direct attachement ( contamination ) and those subclinical infected
persons?
Only The lockdown strategies produced this?
And the role played by high way diffusion ( trucks and other road transport of
goods )in cross APPENINI MOUTNAINS is a fact to be taken in consideration?
The relationship between air pollution and respiratory disease , acute and
chronic are a scientific
Proof of relationship.
In spite of this work have offer some aspect in diffusion of disease but the
authors submit to the researcher the need to verify this HYPOTESYS OF WORK
in diffusion – spread of Covid -19 in Italian regions.
CHAPTHER 6 ) References
1) https://www.scienzainrete.it/articolo/coronavirus-ha-viaggiato-
autostrada/giovanni-sebastiani/2020-04-09
2) Epidemiology and Diffusion of Some Relevant Virus: Latitude, Air
Pollutants and Humidity Role. Hypothesis of Work: COVID 19 Effect on the
Air Pollution in Some World Region: What Implications? Luisetto et al
2020 EC CRONICON J. PULMUNOLOGY AND RESPIRATOY MED.
3) POSITION PAPER: “Relazione circa l’effetto dell’inquinamento da
particolato atmosferico e la diffusione di virus nella popolazione” univ.
BARI, BOLOGNA e SIMA
4) https://www.lastampa.it/blogs/2017/11/07/news/inquinamento-
atmosferico-perche-l-aria-della-pianura-padana-e-tra-le-peggiori-d-
europa-1.37181946
5) Influenza seasonality: Lifting the fog Proc Natl Acad Sci U S A. 2009 Mar
10; 106(10): 3645–3646.
doi: 10.1073/pnas.0900933106 Marc Lipsitcha,1
and Cécile Viboudb
6)
Absolute humidity modulates influenza survival, transmission, and
seasonality Jeffrey Shamana,1 and Melvin Kohnb PNAS March 3, 2009 106
(9) 3243-3248; https://doi.org/10.1073/pnas.0806852106
7)
Scafetta, N.: A Proposal for Isotherm World Maps to Forecast the Seasonal
Evolution of the SARS-CoV-2 Pandemic, Preprints 2020, 2020040063. DOI:
10.20944/preprints202004.0063.v1
8) Ambient Influenza and Avian Influenza Virus during Dust Storm Days
and Background Days Apri l 2010E nvironmental Health Perspectives
118(9):1211-6 DOI:
10.1289/ehp.0901782 Chen P-S et al
9) Air pollution and case fatality of SARS in the People's Republic of
China: an ecologic study Yan Cui, Zuo-Feng Zhang, John Froines, Jinkou
Zhao, Hua Wang, Shun-Zhang Yu & Roger Detels Environmental Health
volume 2, Article number: 15 (2003)
10) DOI:10.1007/s11356-016-7228-6Corpus ID: 43151342
Haze is a risk factor contributing to the rapid spread of respiratory
syncytial virus in children Qing Ye, Jun-Fen F
11) Airborne transmission may have played a role in the spread of 2015
highly pathogenic avian influenza outbreaks in the United States
August 2019Scientific Reports 9(1):11755
12) Roles of meteorological conditions in COVID-19 transmission
on a worldwide scale Biqing Chen et al Preprint MEDRXIV 2020
www.medrxiv.org/content/10.1101/2020.03.16.20037168v1
13) Letter to the EditorSARS-Cov-2 RNA Found on Particulate Matter of
Bergamo
in Northern Italy: First Preliminary Evidence
Leonardo Setti et al preprint medrxiv
https://doi.org/10.1101/2020.04.15.20065995
14)environment international Airborne transmission of SARS-CoV-2: The
world should face the realitylLidiaMorawskaa
JunjiCaob
https://doi.org/10.1016/j.envint.2020.105730
15) Fineberg, H.V. Rapid Expert Consultation on the Possibility of
Bioaerosol Spread of SARS-CoV-2 for the COVID-19 Pandemic (April 1,
2020). In: The National Academies Press N.R.C., ed. Washington, DC: The
National Academies Press, National Research Council 2020; 2020.
16) Airborne Transmission of Influenza A/H5N1 Virus Between Ferrets
Sander Herfst,1 Eefje J. A. Schrauwen,1 Martin Linster,1 Salin
Chutinimitkul,1 Emmie de Wit,1* Vincent J. Munster,1* Erin M. Sorrell,1
Theo M. Bestebroer,1 David F. Burke,2 Derek J. Smith,1,2,3 Guus F.
Rimmelzwaan,1 Albert D. M. E. Osterhaus,1 Ron A. M.
Fouchier1†www.sciencemag.org SCIENCE VOL 336 22 JUNE 2012
17) n engl j med 350;17 www.nejm.org april 22, 2004n engl j med
350;17www.nejm.org april 22, 2004 The new england journal of
Medicine 1731 original article
Evidence of Airborne Transmission of the Severe Acute Respiratory
Syndrome Virus
Ignatius T.S. Yu, M.B., B.S., M.P.H., Yuguo Li, Ph.D., Tze Wai Wong, M.B.,
B.S.,
Wilson Tam, M.Phil., Andy T. Chan, Ph.D., Joseph H.W. Lee, Ph.D.,
Dennis Y.C. Leung, Ph.D., and Tommy Ho, B.Sc
18) Research article THE SPREAD OF THE NEW CORONAVIRUS
Giulio Tarro Asian Journal of Science and Technology
Vol. 11, Issue, 03, pp.10863-10865, March, 2020
Other web references
https://www.liberoquotidiano.it/news/italia/22183857/coronavirus_franco_prodi_
pietro_senaldi_aria_infezione_libero.html
Clarifications :
Some part of this work are in Italian language in order to follow the original
author meaning
This work is produced without any diagnostic or therapeutic intent , only to
produce
HYPOTESIS of work to be submitted to the researcher.
All the rules . governative and regionals normatives, all the measure taken by
Italian and World health organization related preventing the diffusion of covid
19 must to be followed and this work not is produced to avoid this .
All the figure are presented only for scientific scope and the references of
original article are reported.
Conflict of interests: no

More Related Content

Similar to Book pianura padana geomorphology climate condition prevalence and distribution of covid 19 and some other respiratory virus hypotesis of work complete version 2020 luisetto m almukthar n tarro g et al DOI :10.13140/RG.2.2.35611.49449

Facts and Opinions about COVID-19
Facts and Opinions about COVID-19 Facts and Opinions about COVID-19
Facts and Opinions about COVID-19 nathanagustianus
 
Airborne COVID Study (2020) - Texas A&M, The University of Texas at Austin, C...
Airborne COVID Study (2020) - Texas A&M, The University of Texas at Austin, C...Airborne COVID Study (2020) - Texas A&M, The University of Texas at Austin, C...
Airborne COVID Study (2020) - Texas A&M, The University of Texas at Austin, C...chaganomics
 
Covid 19 report commissione salute Lincei
Covid 19 report commissione salute LinceiCovid 19 report commissione salute Lincei
Covid 19 report commissione salute LinceiValentina Corona
 
Dynamics of the COVID-19 Comparison between the Theoretical Predictions and t...
Dynamics of the COVID-19 Comparison between the Theoretical Predictions and t...Dynamics of the COVID-19 Comparison between the Theoretical Predictions and t...
Dynamics of the COVID-19 Comparison between the Theoretical Predictions and t...pateldrona
 
Dynamics of the COVID-19 Comparison between the Theoretical Predictions and t...
Dynamics of the COVID-19 Comparison between the Theoretical Predictions and t...Dynamics of the COVID-19 Comparison between the Theoretical Predictions and t...
Dynamics of the COVID-19 Comparison between the Theoretical Predictions and t...navasreni
 
Annals of Clinical and Medical Case Reports - Acmcasereport
Annals of Clinical and Medical Case Reports - AcmcasereportAnnals of Clinical and Medical Case Reports - Acmcasereport
Annals of Clinical and Medical Case Reports - Acmcasereportsemualkaira
 
Dynamics of the COVID-19 Comparison between the Theoretical Predictions and t...
Dynamics of the COVID-19 Comparison between the Theoretical Predictions and t...Dynamics of the COVID-19 Comparison between the Theoretical Predictions and t...
Dynamics of the COVID-19 Comparison between the Theoretical Predictions and t...SarkarRenon
 
Dynamics of the COVID-19 Comparison between the Theoretical Predictions and t...
Dynamics of the COVID-19 Comparison between the Theoretical Predictions and t...Dynamics of the COVID-19 Comparison between the Theoretical Predictions and t...
Dynamics of the COVID-19 Comparison between the Theoretical Predictions and t...komalicarol
 
Dynamics of the COVID-19 Comparison between the Theoretical Predictions and t...
Dynamics of the COVID-19 Comparison between the Theoretical Predictions and t...Dynamics of the COVID-19 Comparison between the Theoretical Predictions and t...
Dynamics of the COVID-19 Comparison between the Theoretical Predictions and t...AnonIshanvi
 
Abstract congress covid 19.docx30
Abstract congress covid 19.docx30Abstract congress covid 19.docx30
Abstract congress covid 19.docx30Enida Xhaferi
 
Covid 19 and other coronavirus airborne indoor and outdoor transmission sta...
Covid  19 and other coronavirus  airborne indoor and outdoor transmission sta...Covid  19 and other coronavirus  airborne indoor and outdoor transmission sta...
Covid 19 and other coronavirus airborne indoor and outdoor transmission sta...M. Luisetto Pharm.D.Spec. Pharmacology
 
COVID-19 and Italy: what next?
COVID-19 and Italy: what next?COVID-19 and Italy: what next?
COVID-19 and Italy: what next?Valentina Corona
 
Air pollution and COVID-19
Air pollution and COVID-19Air pollution and COVID-19
Air pollution and COVID-19KripaThapaMagar1
 
Ijcv covid 19 new variant and air pollution relationship how airborne mutag...
Ijcv  covid 19 new variant and air pollution relationship  how airborne mutag...Ijcv  covid 19 new variant and air pollution relationship  how airborne mutag...
Ijcv covid 19 new variant and air pollution relationship how airborne mutag...M. Luisetto Pharm.D.Spec. Pharmacology
 
Jebs covid 19 pandemic and the management strategy for business and economy ...
Jebs covid  19 pandemic and the management strategy for business and economy ...Jebs covid  19 pandemic and the management strategy for business and economy ...
Jebs covid 19 pandemic and the management strategy for business and economy ...M. Luisetto Pharm.D.Spec. Pharmacology
 
Jebs covid 19 pandemic and the management strategy for business and economy l...
Jebs covid 19 pandemic and the management strategy for business and economy l...Jebs covid 19 pandemic and the management strategy for business and economy l...
Jebs covid 19 pandemic and the management strategy for business and economy l...M. Luisetto Pharm.D.Spec. Pharmacology
 
COVID-19 AND UROLOGY: A Comprehensive Review of the Literature
COVID-19 AND UROLOGY: A Comprehensive Review of the LiteratureCOVID-19 AND UROLOGY: A Comprehensive Review of the Literature
COVID-19 AND UROLOGY: A Comprehensive Review of the LiteratureValentina Corona
 
Temperature and latitude analysis to predict potential spread and seasonalit...
 Temperature and latitude analysis to predict potential spread and seasonalit... Temperature and latitude analysis to predict potential spread and seasonalit...
Temperature and latitude analysis to predict potential spread and seasonalit...CamilaDuitama
 

Similar to Book pianura padana geomorphology climate condition prevalence and distribution of covid 19 and some other respiratory virus hypotesis of work complete version 2020 luisetto m almukthar n tarro g et al DOI :10.13140/RG.2.2.35611.49449 (20)

Facts and Opinions about COVID-19
Facts and Opinions about COVID-19 Facts and Opinions about COVID-19
Facts and Opinions about COVID-19
 
Airborne COVID Study (2020) - Texas A&M, The University of Texas at Austin, C...
Airborne COVID Study (2020) - Texas A&M, The University of Texas at Austin, C...Airborne COVID Study (2020) - Texas A&M, The University of Texas at Austin, C...
Airborne COVID Study (2020) - Texas A&M, The University of Texas at Austin, C...
 
Covid 19 ppt 1
Covid 19  ppt 1Covid 19  ppt 1
Covid 19 ppt 1
 
Covid 19 report commissione salute Lincei
Covid 19 report commissione salute LinceiCovid 19 report commissione salute Lincei
Covid 19 report commissione salute Lincei
 
Dynamics of the COVID-19 Comparison between the Theoretical Predictions and t...
Dynamics of the COVID-19 Comparison between the Theoretical Predictions and t...Dynamics of the COVID-19 Comparison between the Theoretical Predictions and t...
Dynamics of the COVID-19 Comparison between the Theoretical Predictions and t...
 
Dynamics of the COVID-19 Comparison between the Theoretical Predictions and t...
Dynamics of the COVID-19 Comparison between the Theoretical Predictions and t...Dynamics of the COVID-19 Comparison between the Theoretical Predictions and t...
Dynamics of the COVID-19 Comparison between the Theoretical Predictions and t...
 
Annals of Clinical and Medical Case Reports - Acmcasereport
Annals of Clinical and Medical Case Reports - AcmcasereportAnnals of Clinical and Medical Case Reports - Acmcasereport
Annals of Clinical and Medical Case Reports - Acmcasereport
 
Dynamics of the COVID-19 Comparison between the Theoretical Predictions and t...
Dynamics of the COVID-19 Comparison between the Theoretical Predictions and t...Dynamics of the COVID-19 Comparison between the Theoretical Predictions and t...
Dynamics of the COVID-19 Comparison between the Theoretical Predictions and t...
 
Dynamics of the COVID-19 Comparison between the Theoretical Predictions and t...
Dynamics of the COVID-19 Comparison between the Theoretical Predictions and t...Dynamics of the COVID-19 Comparison between the Theoretical Predictions and t...
Dynamics of the COVID-19 Comparison between the Theoretical Predictions and t...
 
Abstract congress covid 19.docx30
Abstract congress covid 19.docx30Abstract congress covid 19.docx30
Abstract congress covid 19.docx30
 
Covid 19 and other coronavirus airborne indoor and outdoor transmission sta...
Covid  19 and other coronavirus  airborne indoor and outdoor transmission sta...Covid  19 and other coronavirus  airborne indoor and outdoor transmission sta...
Covid 19 and other coronavirus airborne indoor and outdoor transmission sta...
 
COVID-19 and Italy: what next?
COVID-19 and Italy: what next?COVID-19 and Italy: what next?
COVID-19 and Italy: what next?
 
vaksin.pdf
vaksin.pdfvaksin.pdf
vaksin.pdf
 
Air pollution and COVID-19
Air pollution and COVID-19Air pollution and COVID-19
Air pollution and COVID-19
 
Ijcv covid 19 new variant and air pollution relationship how airborne mutag...
Ijcv  covid 19 new variant and air pollution relationship  how airborne mutag...Ijcv  covid 19 new variant and air pollution relationship  how airborne mutag...
Ijcv covid 19 new variant and air pollution relationship how airborne mutag...
 
Jebs covid 19 pandemic and the management strategy for business and economy ...
Jebs covid  19 pandemic and the management strategy for business and economy ...Jebs covid  19 pandemic and the management strategy for business and economy ...
Jebs covid 19 pandemic and the management strategy for business and economy ...
 
Jebs covid 19 pandemic and the management strategy for business and economy l...
Jebs covid 19 pandemic and the management strategy for business and economy l...Jebs covid 19 pandemic and the management strategy for business and economy l...
Jebs covid 19 pandemic and the management strategy for business and economy l...
 
COVID-19 AND UROLOGY: A Comprehensive Review of the Literature
COVID-19 AND UROLOGY: A Comprehensive Review of the LiteratureCOVID-19 AND UROLOGY: A Comprehensive Review of the Literature
COVID-19 AND UROLOGY: A Comprehensive Review of the Literature
 
Temperature and latitude analysis to predict potential spread and seasonalit...
 Temperature and latitude analysis to predict potential spread and seasonalit... Temperature and latitude analysis to predict potential spread and seasonalit...
Temperature and latitude analysis to predict potential spread and seasonalit...
 

More from M. Luisetto Pharm.D.Spec. Pharmacology

Published Book- chimici farmacisti - rassegna normativa- Lulu BOOK STORE 202...
Published Book- chimici farmacisti - rassegna normativa- Lulu BOOK STORE  202...Published Book- chimici farmacisti - rassegna normativa- Lulu BOOK STORE  202...
Published Book- chimici farmacisti - rassegna normativa- Lulu BOOK STORE 202...M. Luisetto Pharm.D.Spec. Pharmacology
 
2BOOK -laureati in chimica e farmacia- equipollenti ed equiparati -rassegna n...
2BOOK -laureati in chimica e farmacia- equipollenti ed equiparati -rassegna n...2BOOK -laureati in chimica e farmacia- equipollenti ed equiparati -rassegna n...
2BOOK -laureati in chimica e farmacia- equipollenti ed equiparati -rassegna n...M. Luisetto Pharm.D.Spec. Pharmacology
 
ATTESTATO_ECM- CANNABIS TERAPEUTICA L'INNOVAZIONE DELLA GALENICA luisetto mau...
ATTESTATO_ECM- CANNABIS TERAPEUTICA L'INNOVAZIONE DELLA GALENICA luisetto mau...ATTESTATO_ECM- CANNABIS TERAPEUTICA L'INNOVAZIONE DELLA GALENICA luisetto mau...
ATTESTATO_ECM- CANNABIS TERAPEUTICA L'INNOVAZIONE DELLA GALENICA luisetto mau...M. Luisetto Pharm.D.Spec. Pharmacology
 
Mauro Luisetto_attesatto WEBINAR 2022 SIFAP GALENICA PREPARATI MULTIPLI QUAL...
Mauro Luisetto_attesatto WEBINAR 2022 SIFAP GALENICA PREPARATI MULTIPLI  QUAL...Mauro Luisetto_attesatto WEBINAR 2022 SIFAP GALENICA PREPARATI MULTIPLI  QUAL...
Mauro Luisetto_attesatto WEBINAR 2022 SIFAP GALENICA PREPARATI MULTIPLI QUAL...M. Luisetto Pharm.D.Spec. Pharmacology
 
APPR.MS.ID.000579.pdf NON STERILE GALENIC LABORATORY 2024 luisetto m et al
APPR.MS.ID.000579.pdf NON STERILE GALENIC LABORATORY 2024 luisetto m et alAPPR.MS.ID.000579.pdf NON STERILE GALENIC LABORATORY 2024 luisetto m et al
APPR.MS.ID.000579.pdf NON STERILE GALENIC LABORATORY 2024 luisetto m et alM. Luisetto Pharm.D.Spec. Pharmacology
 
attestato_6-380924 luisetto mauro IL MEDICINALE MAGISTRALE 2023 (1).pdf
attestato_6-380924 luisetto mauro IL MEDICINALE MAGISTRALE 2023 (1).pdfattestato_6-380924 luisetto mauro IL MEDICINALE MAGISTRALE 2023 (1).pdf
attestato_6-380924 luisetto mauro IL MEDICINALE MAGISTRALE 2023 (1).pdfM. Luisetto Pharm.D.Spec. Pharmacology
 
Dott Mauro Luisetto - Attestato sicurezza - ATN FAD - Potenziali effetti sul...
Dott  Mauro Luisetto - Attestato sicurezza - ATN FAD - Potenziali effetti sul...Dott  Mauro Luisetto - Attestato sicurezza - ATN FAD - Potenziali effetti sul...
Dott Mauro Luisetto - Attestato sicurezza - ATN FAD - Potenziali effetti sul...M. Luisetto Pharm.D.Spec. Pharmacology
 
Ricevuta Quota iscrizione UTIFAR luisetto mauro UNIONE TECNICA ITALIANA FARM...
Ricevuta Quota iscrizione UTIFAR  luisetto mauro UNIONE TECNICA ITALIANA FARM...Ricevuta Quota iscrizione UTIFAR  luisetto mauro UNIONE TECNICA ITALIANA FARM...
Ricevuta Quota iscrizione UTIFAR luisetto mauro UNIONE TECNICA ITALIANA FARM...M. Luisetto Pharm.D.Spec. Pharmacology
 
Mauro Luisetto attestazione evento CAPSULE -fondamenti-controlli di qualita' ...
Mauro Luisetto attestazione evento CAPSULE -fondamenti-controlli di qualita' ...Mauro Luisetto attestazione evento CAPSULE -fondamenti-controlli di qualita' ...
Mauro Luisetto attestazione evento CAPSULE -fondamenti-controlli di qualita' ...M. Luisetto Pharm.D.Spec. Pharmacology
 
IJNRDTH00156_ConfirmationLetter GALENIC LABORATORY INNOVATION AND MANAGEMENT ...
IJNRDTH00156_ConfirmationLetter GALENIC LABORATORY INNOVATION AND MANAGEMENT ...IJNRDTH00156_ConfirmationLetter GALENIC LABORATORY INNOVATION AND MANAGEMENT ...
IJNRDTH00156_ConfirmationLetter GALENIC LABORATORY INNOVATION AND MANAGEMENT ...M. Luisetto Pharm.D.Spec. Pharmacology
 
Valutazione book Luisetto m GALENIC LABORATORY STATE OF THE ART 2024- MNLF.pdf
Valutazione book Luisetto m GALENIC LABORATORY STATE OF THE ART 2024- MNLF.pdfValutazione book Luisetto m GALENIC LABORATORY STATE OF THE ART 2024- MNLF.pdf
Valutazione book Luisetto m GALENIC LABORATORY STATE OF THE ART 2024- MNLF.pdfM. Luisetto Pharm.D.Spec. Pharmacology
 

More from M. Luisetto Pharm.D.Spec. Pharmacology (20)

Chinese chemical Society LUISETTO MAURO 2024-2025 membership.docx
Chinese chemical Society LUISETTO MAURO 2024-2025 membership.docxChinese chemical Society LUISETTO MAURO 2024-2025 membership.docx
Chinese chemical Society LUISETTO MAURO 2024-2025 membership.docx
 
Published Book- chimici farmacisti - rassegna normativa- Lulu BOOK STORE 202...
Published Book- chimici farmacisti - rassegna normativa- Lulu BOOK STORE  202...Published Book- chimici farmacisti - rassegna normativa- Lulu BOOK STORE  202...
Published Book- chimici farmacisti - rassegna normativa- Lulu BOOK STORE 202...
 
RECOGNITION 2024-7 IMA academy official certificate
RECOGNITION 2024-7 IMA academy official certificateRECOGNITION 2024-7 IMA academy official certificate
RECOGNITION 2024-7 IMA academy official certificate
 
2BOOK -laureati in chimica e farmacia- equipollenti ed equiparati -rassegna n...
2BOOK -laureati in chimica e farmacia- equipollenti ed equiparati -rassegna n...2BOOK -laureati in chimica e farmacia- equipollenti ed equiparati -rassegna n...
2BOOK -laureati in chimica e farmacia- equipollenti ed equiparati -rassegna n...
 
REGISTRATION COMMONWEALTH CHEMISTRY LUISETTO MAURO 2024.docx
REGISTRATION COMMONWEALTH CHEMISTRY LUISETTO MAURO 2024.docxREGISTRATION COMMONWEALTH CHEMISTRY LUISETTO MAURO 2024.docx
REGISTRATION COMMONWEALTH CHEMISTRY LUISETTO MAURO 2024.docx
 
PDF SUSCHEM MEMBERSHIP 2024 LUISETTO MAURO SUSTAINABLE CHEMISTRY.pdf
PDF SUSCHEM MEMBERSHIP 2024 LUISETTO MAURO SUSTAINABLE CHEMISTRY.pdfPDF SUSCHEM MEMBERSHIP 2024 LUISETTO MAURO SUSTAINABLE CHEMISTRY.pdf
PDF SUSCHEM MEMBERSHIP 2024 LUISETTO MAURO SUSTAINABLE CHEMISTRY.pdf
 
BOOK MLCF - laurea in chimica e farmacia extended version.pdf
BOOK MLCF - laurea in chimica e farmacia extended version.pdfBOOK MLCF - laurea in chimica e farmacia extended version.pdf
BOOK MLCF - laurea in chimica e farmacia extended version.pdf
 
IJNRDTH00156.pdf galenic laboratory 2024 -innovation and management
IJNRDTH00156.pdf galenic laboratory 2024 -innovation and managementIJNRDTH00156.pdf galenic laboratory 2024 -innovation and management
IJNRDTH00156.pdf galenic laboratory 2024 -innovation and management
 
ATTESTATO_ECM- CANNABIS TERAPEUTICA L'INNOVAZIONE DELLA GALENICA luisetto mau...
ATTESTATO_ECM- CANNABIS TERAPEUTICA L'INNOVAZIONE DELLA GALENICA luisetto mau...ATTESTATO_ECM- CANNABIS TERAPEUTICA L'INNOVAZIONE DELLA GALENICA luisetto mau...
ATTESTATO_ECM- CANNABIS TERAPEUTICA L'INNOVAZIONE DELLA GALENICA luisetto mau...
 
Mauro Luisetto_attesatto WEBINAR 2022 SIFAP GALENICA PREPARATI MULTIPLI QUAL...
Mauro Luisetto_attesatto WEBINAR 2022 SIFAP GALENICA PREPARATI MULTIPLI  QUAL...Mauro Luisetto_attesatto WEBINAR 2022 SIFAP GALENICA PREPARATI MULTIPLI  QUAL...
Mauro Luisetto_attesatto WEBINAR 2022 SIFAP GALENICA PREPARATI MULTIPLI QUAL...
 
APPR.MS.ID.000579.pdf NON STERILE GALENIC LABORATORY 2024 luisetto m et al
APPR.MS.ID.000579.pdf NON STERILE GALENIC LABORATORY 2024 luisetto m et alAPPR.MS.ID.000579.pdf NON STERILE GALENIC LABORATORY 2024 luisetto m et al
APPR.MS.ID.000579.pdf NON STERILE GALENIC LABORATORY 2024 luisetto m et al
 
attestato_6-380924 luisetto mauro IL MEDICINALE MAGISTRALE 2023 (1).pdf
attestato_6-380924 luisetto mauro IL MEDICINALE MAGISTRALE 2023 (1).pdfattestato_6-380924 luisetto mauro IL MEDICINALE MAGISTRALE 2023 (1).pdf
attestato_6-380924 luisetto mauro IL MEDICINALE MAGISTRALE 2023 (1).pdf
 
Dott Mauro Luisetto - Attestato sicurezza - ATN FAD - Potenziali effetti sul...
Dott  Mauro Luisetto - Attestato sicurezza - ATN FAD - Potenziali effetti sul...Dott  Mauro Luisetto - Attestato sicurezza - ATN FAD - Potenziali effetti sul...
Dott Mauro Luisetto - Attestato sicurezza - ATN FAD - Potenziali effetti sul...
 
Ricevuta Quota iscrizione UTIFAR luisetto mauro UNIONE TECNICA ITALIANA FARM...
Ricevuta Quota iscrizione UTIFAR  luisetto mauro UNIONE TECNICA ITALIANA FARM...Ricevuta Quota iscrizione UTIFAR  luisetto mauro UNIONE TECNICA ITALIANA FARM...
Ricevuta Quota iscrizione UTIFAR luisetto mauro UNIONE TECNICA ITALIANA FARM...
 
dott Luisetto MAURO ISCRIZIONE UGI 2024 UNIONE GALENISTI ITALIANI.pdf
dott  Luisetto MAURO ISCRIZIONE UGI 2024 UNIONE GALENISTI ITALIANI.pdfdott  Luisetto MAURO ISCRIZIONE UGI 2024 UNIONE GALENISTI ITALIANI.pdf
dott Luisetto MAURO ISCRIZIONE UGI 2024 UNIONE GALENISTI ITALIANI.pdf
 
Mauro Luisetto attestazione evento CAPSULE -fondamenti-controlli di qualita' ...
Mauro Luisetto attestazione evento CAPSULE -fondamenti-controlli di qualita' ...Mauro Luisetto attestazione evento CAPSULE -fondamenti-controlli di qualita' ...
Mauro Luisetto attestazione evento CAPSULE -fondamenti-controlli di qualita' ...
 
IJNRDTH00156_ConfirmationLetter GALENIC LABORATORY INNOVATION AND MANAGEMENT ...
IJNRDTH00156_ConfirmationLetter GALENIC LABORATORY INNOVATION AND MANAGEMENT ...IJNRDTH00156_ConfirmationLetter GALENIC LABORATORY INNOVATION AND MANAGEMENT ...
IJNRDTH00156_ConfirmationLetter GALENIC LABORATORY INNOVATION AND MANAGEMENT ...
 
ISCRIZIONE ANCTF LUISETTO MAURO- lettera del luglio 1999.pdf
ISCRIZIONE ANCTF LUISETTO MAURO- lettera del luglio  1999.pdfISCRIZIONE ANCTF LUISETTO MAURO- lettera del luglio  1999.pdf
ISCRIZIONE ANCTF LUISETTO MAURO- lettera del luglio 1999.pdf
 
ISCRIZIONE ANCTF LUISETTO MAURO 1996.pdf
ISCRIZIONE ANCTF LUISETTO MAURO 1996.pdfISCRIZIONE ANCTF LUISETTO MAURO 1996.pdf
ISCRIZIONE ANCTF LUISETTO MAURO 1996.pdf
 
Valutazione book Luisetto m GALENIC LABORATORY STATE OF THE ART 2024- MNLF.pdf
Valutazione book Luisetto m GALENIC LABORATORY STATE OF THE ART 2024- MNLF.pdfValutazione book Luisetto m GALENIC LABORATORY STATE OF THE ART 2024- MNLF.pdf
Valutazione book Luisetto m GALENIC LABORATORY STATE OF THE ART 2024- MNLF.pdf
 

Recently uploaded

Climate change Presentation for students who need it
Climate change Presentation for students who need itClimate change Presentation for students who need it
Climate change Presentation for students who need itmaythadar1312
 
New Metrics for Sustainable Prosperity: Options for GDP+3 (preliminary study)
New Metrics for Sustainable Prosperity: Options for GDP+3 (preliminary study)New Metrics for Sustainable Prosperity: Options for GDP+3 (preliminary study)
New Metrics for Sustainable Prosperity: Options for GDP+3 (preliminary study)susannedejong
 
The Key to Sustainable Energy Optimization: A Data-Driven Approach for Manufa...
The Key to Sustainable Energy Optimization: A Data-Driven Approach for Manufa...The Key to Sustainable Energy Optimization: A Data-Driven Approach for Manufa...
The Key to Sustainable Energy Optimization: A Data-Driven Approach for Manufa...Aggregage
 
Lecture 6- Bacteria- Pathathogenesis.ppt
Lecture 6- Bacteria- Pathathogenesis.pptLecture 6- Bacteria- Pathathogenesis.ppt
Lecture 6- Bacteria- Pathathogenesis.pptDiptiPriya6
 
Final Research Report on ‘Common Services activities, Technical & Environmen...
Final  Research Report on ‘Common Services activities, Technical & Environmen...Final  Research Report on ‘Common Services activities, Technical & Environmen...
Final Research Report on ‘Common Services activities, Technical & Environmen...Md Zafar Alam Bhuiyan
 
LANDFILL AND ITS EFFECT(Managing waste).pptx
LANDFILL AND ITS EFFECT(Managing waste).pptxLANDFILL AND ITS EFFECT(Managing waste).pptx
LANDFILL AND ITS EFFECT(Managing waste).pptxKrish DS
 
TEST BANK For Geosystems An Introduction to Physical Geography, 5th Canadian ...
TEST BANK For Geosystems An Introduction to Physical Geography, 5th Canadian ...TEST BANK For Geosystems An Introduction to Physical Geography, 5th Canadian ...
TEST BANK For Geosystems An Introduction to Physical Geography, 5th Canadian ...marcuskenyatta275
 
In vitro evaluation of antibacterial activity of chloroform extract Andrograp...
In vitro evaluation of antibacterial activity of chloroform extract Andrograp...In vitro evaluation of antibacterial activity of chloroform extract Andrograp...
In vitro evaluation of antibacterial activity of chloroform extract Andrograp...Open Access Research Paper
 
poplar trees field in kurdistan region of iraq.pptx
poplar trees field in kurdistan region of iraq.pptxpoplar trees field in kurdistan region of iraq.pptx
poplar trees field in kurdistan region of iraq.pptxjihad19
 
Presentation on GLOBALISATION IN MBA sem
Presentation on GLOBALISATION IN MBA semPresentation on GLOBALISATION IN MBA sem
Presentation on GLOBALISATION IN MBA semAnikaSingh30
 
原版定制(英国Kent毕业证书)肯特大学毕业证Offer录取通知书学校原版一模一样
原版定制(英国Kent毕业证书)肯特大学毕业证Offer录取通知书学校原版一模一样原版定制(英国Kent毕业证书)肯特大学毕业证Offer录取通知书学校原版一模一样
原版定制(英国Kent毕业证书)肯特大学毕业证Offer录取通知书学校原版一模一样muwap
 
Plastic angel or demon/recycling process
Plastic angel or demon/recycling processPlastic angel or demon/recycling process
Plastic angel or demon/recycling processMustafa Alp
 
Learn Creative Upcycling Ideas for Old T-Shirts: Transform Your Wardrobe Now
Learn Creative Upcycling Ideas for Old T-Shirts: Transform Your Wardrobe NowLearn Creative Upcycling Ideas for Old T-Shirts: Transform Your Wardrobe Now
Learn Creative Upcycling Ideas for Old T-Shirts: Transform Your Wardrobe NowSwag Cycle
 
2024-05-16 Composting at Home 101 without link to voucher
2024-05-16 Composting at Home 101 without link to voucher2024-05-16 Composting at Home 101 without link to voucher
2024-05-16 Composting at Home 101 without link to voucherEllen Book
 
Lab Investigation.pptxjjjjjjjjjjjjjjjjjj
Lab Investigation.pptxjjjjjjjjjjjjjjjjjjLab Investigation.pptxjjjjjjjjjjjjjjjjjj
Lab Investigation.pptxjjjjjjjjjjjjjjjjjjjoshuaclack73
 
ch15.pdf 3 environmet geography ba 3rd year
ch15.pdf 3 environmet geography  ba 3rd yearch15.pdf 3 environmet geography  ba 3rd year
ch15.pdf 3 environmet geography ba 3rd yearAdarshMishra17
 
Impacts of agriculture on the environment.
Impacts of agriculture on the environment.Impacts of agriculture on the environment.
Impacts of agriculture on the environment.AyushKumar76331
 
National Tree Planting Day May 2024 Nairobi
National Tree Planting Day May 2024 NairobiNational Tree Planting Day May 2024 Nairobi
National Tree Planting Day May 2024 Nairobiayisiclare_
 
New Metrics for Sustainable Prosperity: Options for GDP+3
New Metrics for Sustainable Prosperity: Options for GDP+3New Metrics for Sustainable Prosperity: Options for GDP+3
New Metrics for Sustainable Prosperity: Options for GDP+3susannedejong
 
LaPlace Transforms 2 with use of Matlab.pptx
LaPlace Transforms 2 with use of Matlab.pptxLaPlace Transforms 2 with use of Matlab.pptx
LaPlace Transforms 2 with use of Matlab.pptxjoshuaclack73
 

Recently uploaded (20)

Climate change Presentation for students who need it
Climate change Presentation for students who need itClimate change Presentation for students who need it
Climate change Presentation for students who need it
 
New Metrics for Sustainable Prosperity: Options for GDP+3 (preliminary study)
New Metrics for Sustainable Prosperity: Options for GDP+3 (preliminary study)New Metrics for Sustainable Prosperity: Options for GDP+3 (preliminary study)
New Metrics for Sustainable Prosperity: Options for GDP+3 (preliminary study)
 
The Key to Sustainable Energy Optimization: A Data-Driven Approach for Manufa...
The Key to Sustainable Energy Optimization: A Data-Driven Approach for Manufa...The Key to Sustainable Energy Optimization: A Data-Driven Approach for Manufa...
The Key to Sustainable Energy Optimization: A Data-Driven Approach for Manufa...
 
Lecture 6- Bacteria- Pathathogenesis.ppt
Lecture 6- Bacteria- Pathathogenesis.pptLecture 6- Bacteria- Pathathogenesis.ppt
Lecture 6- Bacteria- Pathathogenesis.ppt
 
Final Research Report on ‘Common Services activities, Technical & Environmen...
Final  Research Report on ‘Common Services activities, Technical & Environmen...Final  Research Report on ‘Common Services activities, Technical & Environmen...
Final Research Report on ‘Common Services activities, Technical & Environmen...
 
LANDFILL AND ITS EFFECT(Managing waste).pptx
LANDFILL AND ITS EFFECT(Managing waste).pptxLANDFILL AND ITS EFFECT(Managing waste).pptx
LANDFILL AND ITS EFFECT(Managing waste).pptx
 
TEST BANK For Geosystems An Introduction to Physical Geography, 5th Canadian ...
TEST BANK For Geosystems An Introduction to Physical Geography, 5th Canadian ...TEST BANK For Geosystems An Introduction to Physical Geography, 5th Canadian ...
TEST BANK For Geosystems An Introduction to Physical Geography, 5th Canadian ...
 
In vitro evaluation of antibacterial activity of chloroform extract Andrograp...
In vitro evaluation of antibacterial activity of chloroform extract Andrograp...In vitro evaluation of antibacterial activity of chloroform extract Andrograp...
In vitro evaluation of antibacterial activity of chloroform extract Andrograp...
 
poplar trees field in kurdistan region of iraq.pptx
poplar trees field in kurdistan region of iraq.pptxpoplar trees field in kurdistan region of iraq.pptx
poplar trees field in kurdistan region of iraq.pptx
 
Presentation on GLOBALISATION IN MBA sem
Presentation on GLOBALISATION IN MBA semPresentation on GLOBALISATION IN MBA sem
Presentation on GLOBALISATION IN MBA sem
 
原版定制(英国Kent毕业证书)肯特大学毕业证Offer录取通知书学校原版一模一样
原版定制(英国Kent毕业证书)肯特大学毕业证Offer录取通知书学校原版一模一样原版定制(英国Kent毕业证书)肯特大学毕业证Offer录取通知书学校原版一模一样
原版定制(英国Kent毕业证书)肯特大学毕业证Offer录取通知书学校原版一模一样
 
Plastic angel or demon/recycling process
Plastic angel or demon/recycling processPlastic angel or demon/recycling process
Plastic angel or demon/recycling process
 
Learn Creative Upcycling Ideas for Old T-Shirts: Transform Your Wardrobe Now
Learn Creative Upcycling Ideas for Old T-Shirts: Transform Your Wardrobe NowLearn Creative Upcycling Ideas for Old T-Shirts: Transform Your Wardrobe Now
Learn Creative Upcycling Ideas for Old T-Shirts: Transform Your Wardrobe Now
 
2024-05-16 Composting at Home 101 without link to voucher
2024-05-16 Composting at Home 101 without link to voucher2024-05-16 Composting at Home 101 without link to voucher
2024-05-16 Composting at Home 101 without link to voucher
 
Lab Investigation.pptxjjjjjjjjjjjjjjjjjj
Lab Investigation.pptxjjjjjjjjjjjjjjjjjjLab Investigation.pptxjjjjjjjjjjjjjjjjjj
Lab Investigation.pptxjjjjjjjjjjjjjjjjjj
 
ch15.pdf 3 environmet geography ba 3rd year
ch15.pdf 3 environmet geography  ba 3rd yearch15.pdf 3 environmet geography  ba 3rd year
ch15.pdf 3 environmet geography ba 3rd year
 
Impacts of agriculture on the environment.
Impacts of agriculture on the environment.Impacts of agriculture on the environment.
Impacts of agriculture on the environment.
 
National Tree Planting Day May 2024 Nairobi
National Tree Planting Day May 2024 NairobiNational Tree Planting Day May 2024 Nairobi
National Tree Planting Day May 2024 Nairobi
 
New Metrics for Sustainable Prosperity: Options for GDP+3
New Metrics for Sustainable Prosperity: Options for GDP+3New Metrics for Sustainable Prosperity: Options for GDP+3
New Metrics for Sustainable Prosperity: Options for GDP+3
 
LaPlace Transforms 2 with use of Matlab.pptx
LaPlace Transforms 2 with use of Matlab.pptxLaPlace Transforms 2 with use of Matlab.pptx
LaPlace Transforms 2 with use of Matlab.pptx
 

Book pianura padana geomorphology climate condition prevalence and distribution of covid 19 and some other respiratory virus hypotesis of work complete version 2020 luisetto m almukthar n tarro g et al DOI :10.13140/RG.2.2.35611.49449

  • 1. BOOK TITLE : Pianura Padana geo-morphology, climate condition prevalence and distribution of COVID -19 and some other respiratory virus: Hypotesis of work. Authors: 1 )mauro luisetto IMA ACADEMY natural science and toxicology branch Italy 29121 2)Naseer Almukthar, Professor, Department of Physiology /College of Medicine, University of Babylon, Iraq 3) Prof. Giulio Tarro Primario emerito dell’ Azienda Ospedaliera “D. Cotugno”, Napoli Chairman della Commissione sulle Biotecnologie della Virosfera, WABT - UNESCO, Parigi Rector of the University Thomas More U.P.T.M., Rome Presidente della Fondazione de Beaumont Bonelli per le ricerche sul cancro - ONLUS, Napoli 4) Ghulam Rasool Mashori, Full Professor of pharmacology ,Peoples university of medical and health sciences for Women, Nawabshah,Pakistan 5) Ahmed Yesvi Rafa ,Founder and President, Yugen Research Organization, Western Michigan University, MI, USA 6) Oleg yurevich Latyshev President of IMA academy RU
  • 2. Keywords :PIANURA PADANA (an Italian area), geomorphological, climate condition ,covid -19 diffusion ,Worsening factors, air pollution, Regional mortality rate variability, infection speed , coronavirus belt, wind speed ,meteorological factors, humidity, temperature ,latitude, viruses airborne transmission *Corresponding Author: mauro Luisetto , IMA Academy Natural Science, maurolu65@gmail.com CHAPTHER 1 ) Abstract In order to enrich and expand this topic information whit an update searches, new studies and allows widely benefits international. Hence this work was written in Italian and English languages. The recent study was verified the statistical hypotesis of prevalence and distribution of covid- 19 related some Relevant division of high way in italy ( especially north regions ) . The geomorphological characteristic of PIANURA PADANA , an area located in Italia which is also Named PO valley ( a low area land between hills and mountains) This area is surrounded from the north by a close connection with a serial range ALPI mountains and from south by APPENINI MOUNTAINS have created since ancient time particular climate condition. If we observe diffusion of covid -19 in italy at today date is possible to verify a sort of different velocity in diffusion between north region vs the other . There are obvious relationship between this “ closed environment “ and diffusion of some relevant virus? Pianura padana is famous for its kind of climate with lots of fog in some season, but also for air pollution as reported by EPHA and other organization. CHAPTHER 2 ) Introduction
  • 3. It seem that Italian presence and diffusion of covid -19 depends on some travelers that comes from Wu han and other infected region of the globe, but it is interesting to notice that the strange diffusion of virus in north Italia not in a close association with the fact that Chinese from this region not arrive in south cities of Italy using other european airport. Starting from this fact we analyze , with an observational approach ( visual methods) some figure related PIANURA PADANA geomorphografic condition and its related climate condition and the recent study asses to verify as hypotesis of work diffusion of virus according great north high way in the area of north italia. As Italia is also like a PENINSULA therefore it show high development north south. From 35 grades latitude south ( Lampedusa isle ) to 47 grades latitudes north ( ALPI AURINE ) . FIG. N 1 Italy zone : continental peninsular , insular It seem that there are I Italy 2 different velocity for diffusion of covid-19 : with north showing very fast vs south that appear more slowly.
  • 4. Can be related to the famous PIANURA PADANA climate and its enhancement conditions as well as to air pollution raise due to a huge of factories ? as industrial area? All this must be related to the lockdown Italian measure in march – April 2020, and the red zone of the first phases of virus diffusion in north of Italy. According a recent interview (18 april 2020) to Professor F. Prodi famous CLIMATOLOGIST by italian journal it was reported: “conta il vento, altro grande assente dalla Pianura Padana. Esso diluisce le concentrazioni degli inquinanti, redistribuendoli negli strati più alti e attenua la forza contagiosa del virus “. And in the same interview: “Sono molto preoccupato. La clausura, il distacco sociale, vengono imposti come unica soluzione possibile per contrastare la diffusione del Covid-19, implicitamente attribuendo il contagio alla sola interazione tra persone. Ma non è così, tant'è che la segregazione degli individui all'interno delle loro abitazioni fatica a portare i vantaggi attesi, pur essendo al momento assolutamente necessaria.” All this variable must be strictly applied to the lockdown of Italian measure in march – April 2020, and the red zone of the first stages of virus diffusion in north of Italia. CHAPTHER 3 ) Material and methods A monitoring approach point out observing some figure related to the topics of this works and some global relevant literature conclusion is produced to submit for a wide range of researchers for a new research topics. From literature and on line resource : According https://www.scienzainrete.it/articolo/coronavirus-ha-viaggiato- autostrada/giovanni-sebastiani/2020-04-09
  • 5. An hypotesis of work is related some characteristic of Italian relevant way of travel communication . “La diffusione è maggiore vicino ai grandi nodi autostradali» ( spread is greater near the major motor-way junctions) Figure n 2 Italian high way – covid -19 distribution work SEBASTIANI 2020 As the diffusion or transport of coronavirus seem to follow great travel communication pathway. North Italia is a known as real industrial area and present whit a high interconnection more then that of the south region. However, connected with other part of Italia but also it connected with other world regions.
  • 6. It is a fact that today some north Italian region are most involved in viruses diffusion. In addiction, to other fact shown in this region of north italia there are ALPI MOUNTAIN and in south part there are existence of the APPENNINI MOUNTAINS that function and create an particular climate conditions : PIANURA PADANA Besides ,other fact proved that in this AREA have great level of air pollution as it were previously mentioned in many scientific publications. The mortality rate is variable in all italia region but in Lombardia mortality represented about 17,9% ( in 7 april 2020) While in general medium data of mortality in Italy reach about 12,5%, but if we excluded lombardia region this percent will become 9%. However , this data depends on the real number of infected peoples ( this data demonstrate of some problems to be correctly detected related to the laboratory diagnostic ) Figure n. 3 covid -19 distribution Italy February- march 2020 CHAPTER 4) Results
  • 7. As reported in SEBASTIANI work it is interesting to observe that the APPENINI MOUNTAIN seem to be a Kind of natural limit that acts as restricted barriers for spread or diffusion of COVID -19 in high rate( until today). Anyhow ,this not mean that the diffusion will not go to the south of Italy: now various cases are registered but what Relevant is the velocity in this process. In various publication relationship related diffusion of some relevant virus and air pollution are showed And the same the influence of latitude and humidity rate, as it were aforementioned by other Italian researchers . In a recent POSITION PAPER: “Relazione circa l’effetto dell’inquinamento da particolato atmosferico e la diffusione di virus nella popolazione” univ. BARI, BOLOGNA e SIMA : “Si evidenzia come la specificità della velocità di incremento dei casi di contagio che ha interessato in particolare alcune zone del Nord Italia potrebbe essere legata alle condizioni di inquinamento da particolato atmosferico che ha esercitato un’azione di carrier di boost. Come già riportato in casi precedenti di elevata diffusione di infezione virale in relazione ad elevati livelli di contaminazione da particolato atmosferico, si suggerisce di tenere conto di questo contributo sollecitando misure restrittive di contenimento dell’inquinamento.” (3)
  • 8. Figure n. 4 PIANURA PADANA and geographic morphology :ALPI mountain in north and APPENINI in the south part Figure n 5 Air pollution north Italy N02
  • 9. Fig. 6 ITALY diffusion covid- 19 April 2020 Fig 7 Lombardia region involvement (7 march 2020),formhttps://primapavia.it/cronaca/coronavirus-tutta-la- lombardia-diventa-zona-rossa/ According PROTEZIONE CIVILE ITALY 12 april 2020:
  • 10. “i casi attualmente- positivi sono 31.265 in Lombardia, 13.672 in Emilia- Romagna, 12.505 in Piemonte, 10.729 in Veneto, 6.162 in Toscana, 3.817 nel Lazio, 3.333 in Liguria, 3.114 nelle Marche, 3.057 in Campania, 2.452 in Puglia, 2.082 nella Provincia- autonoma di Trento, 2.030 in Sicilia, 1.742 in Abruzzo, 1.326 in Friuli Venezia Giulia, 1.515 nella Provincia autonoma di Bolzano, 903 in Sardegna, 795 in Calabria, 687 in Umbria, 588 in Valle d’Aosta, 277 in Basilicata e 202 in Molise.” Accordin article published in https://www.lastampa.it/blogs/2017/11/07/news/inquinamento-atmosferico- perche-l-aria-della-pianura-padana-e-tra-le-peggiori-d-europa-1.37181946 “climate Network Inquinamento- atmosferico: perché l’aria della Pianura Padana è tra le peggiori d’Europa? La relazione è semplice: più polveri, più malattie. Ogni anno questa realtà si rende- evidente, visibile all’occhio e percepibile dai polmoni Inquinamento atmosferico: perché l’aria della Pianura Padana è tra le peggiori d’Europa? Non vogliamo rinunciare all’automobile. Non riusciamo a- rinunciare al riscaldamento. Non possiamo rinunciare all’agricoltura.Ma stiamo rinunciando alla nostra- salute. La relazione è semplice: più polveri, più malattie. Ogni anno questa realtà si rende evidente, visibile all’occhio e percepibile dai polmoni. Secondo l’Agenzia Europea per l’Ambiente -(EEA) oggi l’inquinamento-- atmosferico provoca 461mila decessi -prematuri l’anno solo in Europa, 20 volte di più delle vittime per incidenti stradali. Per chi abita in Pianura Padana, una delle zone più inquinate del continente, sembra un destino inevitabile. Ma l’inquinamento sta aumentando? Quali sono le cause principali? Come possiamo difenderci? Il Centro Epson Meteo risponde a queste domande, impegnandosi nel percorso verso un’aria di qualità. I dati sorprendono: le principali fonti di PM10 sono estremamente -diversificate, dalle pizze cotte a legna alle cattive pratiche agricole. L’analisi della Presidente di Italian Climate- Network S. Giacomin. L’inquinamento sta davvero aumentando sempre di più?
  • 11. Prendiamo la Lombardia, ben rappresentativa delle concentrazioni complessive del bacino padano e i cui dati d’inquinamento (in particolare delle polveri sottili, PM10 su cui ci concentreremo) sono ampiamente disponibili sul sito dell’ARPA della- Regione. Nonostante le oscillazioni nelle concentrazioni di PM determinate anche dalle condizioni meteorologiche, i dati dimostrano una tendenza al miglioramento negli ultimi- decenni. L’aria resta troppo inquinata, ma l’inquinamento è in calo. Le concentrazioni che si misurano oggi sono anche di ordini di grandezza inferiori a quelle rilevate negli anni ‘70 ,‘80 e ‘90 del secolo scorso. Uno sforzo mirabile per la Pianura Padana, ma comunque non sufficiente per rientrare nei limiti di legge (d.lgs 155/2010 che ha recepito la direttiva- Ue sulla qualità dell’aria) abbondantemente- superati tutti gli anni. Quali sono le condizioni meteo che tappano il ‘catino padano’? “I fattori orografici e meteorologici contribuiscono in modo significativo alle elevate concentrazioni di inquinanti atmosferici che fanno della Val Padana una delle zone più inquinante d’Europa, nonostante le emissioni siano paragonabili a quelle di altre aree- sviluppate” - conferma il meteorologo del Centro Epson-- Meteo Flavio Galbiati - “questo perché il ‘catino’ padano è circondato dalla catena montuosa alpina che influenza il regime dei venti, la cui intensità risulta generalmente molto debole. Un altro importante fattore è l’elevata frequenza di situazioni meteorologiche caratterizzate da stabilità atmosferica. Queste condizioni, tipiche del semestre invernale in caso di alta pressione, hanno origine dal fenomeno meteorologico dell’inversione termica. In pratica in atmosfera la temperatura non diminuisce salendo di quota, come ci si aspetterebbe, ma ad un’altezza di 800/1000 metri si riscontra una temperatura più alta di quella dello strato- inferiore. Si modifica così la circolazione- locale dell’aria: quella più fredda dei bassi strati, essendo più densa e più pesante, non può sollevarsi verticalmente oltre la quota dell’inversione. Si viene a creare quindi un vero e proprio ‘tappo’ che impedisce il ricambio d’aria, intrappolando gli inquinanti in prossimità del suolo, dove la loro concentrazione, giorno- dopo giorno, non potrà che aumentare”. (4) According Marc Lipsitch et al:“Controlled influenza transmission studies conducted in mice in the 1960s were the first to suggest that transmissibility varied with temperature, relative humidity, and season . Experimental- infections in humans further high-lighted seasonal variation in disease severity and in the rate of immune sero-conversion . Most recently, the concept that temperature and relative humidity may alter influenza transmission has been confirmed in a guinea-pig model . These data, together with laboratory experiments testing virus survival under- controlled environmental conditions , are carefully revisited in the new study by Shaman and Kohn .
  • 12. Additional evidence on mechanisms of seasonality comes from- population- level studies, which typically attempt to correlate fluctuation in meteorological variables with influenza epidemiological data in a specific locale. reinterpretation of experimental data on survival of airborne influenza virus particles demonstrates that virus- survival increases with low levels of vapor pressure. The authors note that vapor pressure is minimal during winter in indoor and outdoor settings in temperate regions and conclude that vapor -pressure is a parsimonious mechanism of influenza seasonality, consistent with increased disease transmission in winter.”(5) Jeffrey Shaman et al: “Influenza A incidence peaks during winter in temperate- regions. The basis for this pronounced seasonality is not understood, nor is it well documented how influenza A transmission principally occurs. Previous- studies indicate that relative humidity (RH) affects both influenza virus transmission (IVT) and influenza virus survival (IVS). we reanalyze these data to explore the effects of absolute humidity on IVT and IVS. We find that absolute humidity (AH) constrains both trans-mission efficiency and IVS much more significantly than RH. In the studies presented, 50% of IVT variability and 90% of IVS variability are explained by AH, whereas, respectively, only 12% and 36% are explained by RH. In temperate -regions, both outdoor and indoor AH possess a strong seasonal- cycle that minimizes in winter. This seasonal cycle is consistent with a wintertime increase in IVS and IVT and may explain the seasonality of influenza. Thus, differences in AH provide a single, coherent, more physically sound explanation for the observed variability of IVS, IVT and influenza seasonality in temperate regions. This hypothesis can be further tested through future, additional laboratory, epidemiological and modeling studies.Absolute- humidity is predicted to increase in a warming -world . The findings presented here indicate that such changes would decrease IVS and IVT rates. This potential outcome, as well as any effects on the seasonality of influenza -incidence, needs to be explored carefully through additional laboratory and modeling experiments”.(6) According a Preprint SCAFETTA N :“This paper investigates whether the Severe Acute Respiratory Syndrome CoronaVirus 2 (SARSCoV-2) pandemic – also known as CoronaVIrus Disease 19 (COVID-19) – could have been favored by specific weather- conditions. It was found that the 2020 winter weather in the region of Wuhan (Hubei, Central China) – where the virus first broke out in December and spread widely from January to February 2020–was strikingly similar to that of the Northern Italian provinces of Milan, Brescia and Bergamo, where the pandemic has been very severe from February to March. The similarity suggests that this pandemic worsens under weather temperatures- between 4°C and 11°C. Based on this result, specific isotherm world- maps were generated to locate, month by month, the world regions that share similar temperature ranges. From January to March, this isotherm zone extended mostly from Central- China toward Iran, Turkey, West-Mediterranean- Europe
  • 13. (Italy, Spain and France) up to the United State of America, coinciding with the geographic regions most affected by the pandemic from January to March. It is predicted that next spring,as the weather gets warm,the pandemic will likely worsenin northern regions(United Kingdom, Germany, East Europe, Russia and -North America)while the situation will likely improve in the southern regions(Italy and Spain). However,in autumn,the pandemic could come back and affect the same regions again. The Tropical- Zone and the entire Southern Hemisphere, but in restricted southern- regions, could avoid a strong pandemic because of the sufficiently warm weather during the entire year. Google-Earth- Pro interactive-maps are provided as supplements”(7) Chen P-s et al :“The spread of influenza and highly pathogenic avian- influenza (H5N1) presents a significant threat to human health. Avian influenza outbreaks in downwind areas of Asian dust storms (ADS) suggest that viruses might be transported by dust -storms We developed a technique to measure ambient- influenza and avian influenza viruses. We then used this technique to measure concentrations of these viruses on ADS days and background days, and to assess the relationships between ambient influenza and avian influenza viruses, and air pollutants. A high-volume air sampler was used in parallel with a filter cassette to evaluate spiked- samples and un-spiked samples. Then, air samples were monitored during ADS seasons using a filter- cassette coupled with a real-time quantitative polymerase chain reaction (qPCR) assay. Air samples were monitored during ADS- season (1 January to 31 May 2006). We successfully quantified ambient influenza virus using the filtration/real-time qPCR method during ADS days and back-ground days. this is the first report describing the concentration of influenza virus in ambient air. In both the spiked and un-spiked samples, the concentration of influenza virus sampled using the filter cassette was higher than that using the high-volume sampler. The concentration of ambient influenza- A virus was significantly higher during the ADS days than during the background days. Our data imply the possibility of long-range transport of influenza virus.” Cui et al :“Ecologic analysis conducted among 5 regions with 100 or more SARS cases showed that case fatality rate increased with the increment of API (case fatality = - 0.063 + 0.001 * API). Partially ecologic study based on short- term exposure demonstrated that SARS- patients from regions with moderate APIs had an 84% increased risk of dying from SARS compared to those from
  • 14. regions with low APIs (RR = 1.84, 95% CI: 1.41–2.40). Similarly, SARS patients from regions with high APIs were twice as likely to die from SARS compared to those from regions with low- APIs. (RR = 2.18, 95% CI: 1.31–3.65). Partially ecologic analysis based on long-term exposure to ambient air pollution showed the similar- association. Our studies demonstrated a positive- association between air pollution and SARS case fatality in Chinese population by utilizing publicly- accessible data on SARS statistics and air pollution indices. Although ecologic fallacy and uncontrolled confounding effect might have biased the results, the possibility of a detrimental effect of air pollution on the prognosis of SARS patients deserves further investigation” (9) Q YE et al :“This study investigated whether respiratory syncytial virus (RSV) infection in children was associated with ambient temperature and air- pollutants in Hangzhou-China. A distributed lag non-linear model (DLNM) was used to estimate the effects of daily meteorological data and air pollutants on the incidence of RSV infection among children. A total of 3650 childhood RSV infection cases were included in the study. The highest air- pollutant concentrations were in January to May and October to December during the year. The yearly RSV-positive rate was 10.0 % among children with an average age of 4.3 months. The highest RSV-positive rate occurred among patients 0 to 3 months old. Children under 6.5 months old accounted for 80 % of the total patients infected by RSV. A negative correlation was found between ambient- temperature and RSV infection, and it was strongest with minimum -ambient temperature (r = −0.804, P < 0.001). There was a positive correlation between the infection rate and the particulate matter (PM) 2.5 (r = 0.446, P < 0.001), PM10 (r = 0.397, P < 0.001), SO2 (r = 0.389, P < 0.001), NO2 (r = 0.365, P < 0.001) and CO (r = 0.532, P < 0.001). The current study suggested that temperature was an important- factor associated with RSV infection among children in Hangzhou. Air pollutants significantly increased the risk of RSV infection with dosage, lag and cumulative effects.” (10) “the unprecedented 2015 outbreaks of highly pathogenic avian influenza (HPAI) H5N2 in the U.S. devastated its poultry industry and resulted in over $3 billion economic impacts. Today HPAI continues eroding poultry operations and disrupting animal protein supply- chains around the world. Anecdotal evidence in 2015 suggested that in some cases the AI virus was aerially introduced into poultry houses, as abnormal bird- mortality started near air inlets of the infected houses. This study modeled air- movement trajectories and virus concentrations that were used to assess the probability or risk of airborne transmission for the 77 HPAI cases in Iowa. The results show that majority of the positive cases in Iowa might have received airborne- virus, carried by fine particulate matter, from infected farms within the state (i.e., intrastate) and infected farms from the neighboring states (i.e., interstate). The modeled airborne- virus concentrations at the Iowa recipient sites never exceeded the minimal infective doses for poultry; however, the continuous exposure might
  • 15. have increased airborne- infection risks. In the worst-case scenario (i.e., maximum virus shedding rate, highest emission- rate, and longest half-life), 33 Iowa cases had > 10% (three cases > 50%) infection probability, indicating a medium to high risk of airborne- transmission for these cases. Probability of airborne HPAI infection could be affected by farm type, flock size, and distance to previously infected farms; and more importantly, it can be markedly reduced by swift depopulation and inlet air filtration. The research results provide insights into the risk of airborne- transmission of HPAI virus via fine dust particles and the importance of preventative and containment strategies such as air filtration and quick depopulation of infected flocks.”(11) According a Preprint :“Oliveiros et al. regressed the doubling time of COVID-19 cases by temperature and humidity, and they did not find significant association for wind speed. In our study, though wind- speed was not an important factor if modeled singly, it is a necessary factor in the final model and adding wind speed in the model would significantly improve model prediction performance”(12) According L.Settis et al preprint “we present the first results of the analyses that we have performed on 34 PM10 samples of outdoor/airborne PM10 from an industrial site of Bergamo Province, collected with two different air samplers over a continuous 3-weeks period, from February 21 st to March 13 th. Because of the nature of the sample, and considering that the sampling has not been carried out for clinical- diagnostic purposes but for environmental -pollution tests (taking also into account that filters were stored for at least four weeks before undergoing molecular genetic analyses, as consequence of the Italian shutdown), we can confirm to have reasonably demonstrated the presence of SARS-CoV-2 viral RNA by detecting highly specific “RtDR gene” on 8 filters.”(13) According to L.Morawska et al : “Is it likely that the SARS-CoV-2 virus spreads by air? Its predecessor, SARS-CoV-1, did spread in the air. This was reported in several studies and retrospectively explained the pathway of transmission in Hong- Kong’s Prince of Wales Hospital (Li et al., 2005, Xiao et al., 2017;12., Yu et al., 2005), as well as in health care facilities in Toronto, Canada (Booth et al. 2005), and in aircraft (Olsen et al. 2003). These studies concluded that airborne transmission was the main transmission route in the indoor cases studied. Other examples of airborne transmission of viral- infections include the spread of Norwalk-like virus between school children (Marks et al. 2003), and the transmission of influenza A/H5N1 virus between ferrets (Herfst et al. 2012). A World Health Organization (WHO 2009)- review of the evidence stated that viral infectious diseases can be transmitted across distances relevant to indoor environments by aerosols (e.g. airborne infections), and can result in large clusters of infection in a short period. Considering the many similarities
  • 16. between the two SARS viruses and the evidence on virus- transport in general, it is highly likely that the SARS-CoV-2 virus also spreads by air (Fineberg 2020). Experts in droplet dynamics and airflow in buildings agree on this (Lewis 2020).”(14) According Sander Hersft et al :“Highly pathogenic avian influenza A/H5N1 virus can cause morbidity and mortality in humans but thus far has not acquired the ability to be transmitted by aerosol or respiratory droplet (“airborne -transmission”) between humans. To address the concern that the virus could acquire this ability under natural conditions, we genetically modified A/H5N1 virus by site-directed mutagenesis and subsequent serial passage in ferrets. The genetically modified A/H5N1 virus acquired mutations during passage in ferrets, ultimately becoming airborne- transmissible in ferrets. None of the recipient ferrets died after airborne infection with the mutant A/H5N1 viruses. Four amino acid substitutions in the host receptor-binding protein hemagglutinin, and one in the polymerase complex protein basic polymerase 2, were consistently present in airborne-transmitted viruses. The transmissible- viruses were sensitive to the antiviral drug oseltamivir and reacted well with antisera raised against H5 influenza vaccine strains. Thus, avian A/H5N1 influenza viruses can acquire the capacity for airborne transmission between mammals without recombination in an intermediate host and therefore constitute a risk for human pandemic influenza.” (16) According YU IT et al in an article published in new England journal of medicine 2004 was written: “There is uncertainty about the mode of transmission of the severe acute respiratory syndrome SARS - virus. We analyzed the temporal and spatial distributions of cases in a large community outbreak of SARS in Hong Kong and examined the correlation of these data with the three-dimensional spread of a virus-laden aerosol plume that was modeled using studies of airflow -dynamics. We determined the distribution of the initial 187 cases of SARS in the Amoy- Gardens housing complex in 2003 according to the date of onset and location of residence. We then studied the association between the location (building, floor, and direction the apartment unit faced) and the probability of infection using logistic- regression. The spread of the airborne, virus-laden aerosols generated by the index patient was modeled with the use of airflow-dynamics studies, including studies performed with the use of computational fluid- dynamics and multizone modeling. For building E, apartment units (not persons) on the middle and upper floors had higher probabilities of infection than did units on lower floors, with an odds ratio of 5.15 (95 percent confidence interval,2.6 to 10.3; P<0.001) for the middle floors and 3.1 (95 percent confidence interval, 1.6 to 6.2; P<0.01) for the upper floors. The risk of infection was highest (odds ratio, 14.5; 95 percent confidence interval, 5.5 to 38.4) for units that faced direction Ab
  • 17. (unit 8 on each floor), and it was also significantly elevated in apartment units that faced direction Ad (unit 7) . The units that faced directions Da (unit 6) and Dc (unit 5) appeared to have a slightly lower risk of infection than the other- units. Results of the test for heterogeneity were statistically significant (P<0.001) for both floor level and direction. For buildings B, C, and D, the variation among the three categories of floor level was statistically- significant (P = 0.01), but the variation among the eight directions was of only borderline significance (P = 0.06). For middle-level floors and for directions Ad, Ba, and Da there was a significantly higher risk of infection than on the lower -floors and in direction Cb, respectively. In the analyses stratified ac- cording to building, only the model for building C showed significant heterogeneity among floor levels and directions. The odds ratios for the middle- level floors (16.3) and for apartment units coded Da (9.9) were statistically significant, whereas those for the upper-level floors (7.2) and for units coded Ad (6.4) were of borderline significance. Lo- cation (floor level and direction) was not statistically significant for buildings B and D., in building B, all apartment units with windows that faced direction D (either at the front or the side) — that is, the direction from which the wind blew from building E — had high odds ratios, between 0 and 5.2; An investigative team from the World Health Organization found that traps in the floor drains in many of the housing units seemed not to have been filled with water for long periods; the seals in the traps thus dried out, and as a result, a connection was opened to the vertical soil stack (drainage pipe). The investigative- team suggested that an exhaust fan that was running behind a closed door in the bathroom could have drawn fine drop- lets or aerosols from the soil stack into the bathroom through the unsealed floor drain and thereby contaminated the bathroom. The exhaust fan could have transported contaminated droplets or aerosols from the bathroom into the air shaft. These contaminated- droplets or aerosols could have been carried upward by the natural air current and could have entered other apartment units, even units several floors away from the source of infection, if the virus- laden aerosols had reached an open window in building D, two directions the windows faced were of borderline significance — namely, Ab(odds ratio, 6.3) and Ba (odds ratio, 6.3). We repeated the modeling assuming five or six residents in each unit and obtained similar results (data not shown).
  • 18. Our epidemiologic- analysis, experimental studies, and airflow simulations support the probability of an airborne spread of the SARS virus in the outbreak in Amoy Gardens. Virus-laden aerosols generated in the vertical soil stack of unit 7 in building E returned to the bathroom through the dried-up seals of the floor- drain traps and then entered the air shaft, probably by means of suction created by an exhaust fan. The aerosols moved up-ward owing to the buoyancy of the warm, humid air within the air shaft and could enter apartment units that bordered the air shaft on the upper floors because of the negative pressure created by the exhaust fans or the action of wind- flows around the building. The horizontal spread of infection to other units in building E was by movement of the air between apartment units. After the plume reached the top of the air shaft in building E, the virus was spread to some units at certain heights in buildings B, C, and D by the action of a predominant northeasterly wind. Our hypothesis adequately explains the temporal and spatial distribution of cases of SARS. This hypothesis remains to be confirmed by further analytic epidemiologic, environmental, and experimental -studies and should have important public health implications for the prevention and control of SARS, should the disease recur. Airborne spread of the virus appears to explain this large community outbreak of SARS, and future efforts at prevention and control must take into consideration the potential for airborne- spread of this virus.”(17)
  • 19. Figure n. 8 Distribution of Cases of SARS Infection in Buildings A to G in the Amoy Gardens Housing Estate. ( from reference n 17 ) The prevailing wind (red- arrows) during the period of possible exposure was northeasterly, or roughly perpendicular to the exterior walls of apartment units Dc and Da in building E. The distance between buildings E and B is 60 m. The direction from which the wind -blew shifted from nearly north to east and even southeast. The red dot in building E indicates the unit that the index patient- visited. The directional indicator for the units at the lower right-hand corner indicates the direction each unit faced. In the directional code (Ab, Ad, Ba, Bc, Cb, Cd, Da, Dc) used to designate an apartment unit, uppercase letters denote front-facing windows and lowercase letters side-facing windows. Fig. n 9 Model of the Movement of the Virus-Laden Plume. ( from reference n. 17) According to our computational fluid-dynamics modeling, the buoyant plume (blue) rose from the air shaft between two- housing units in building E (yellow) and was
  • 20. carried by a northeasterly wind toward the middle-level floors in buildings C and D. The L-shape structure (Panels A and B) was a nearby construction site that blocked the wind flowing toward lower-level floors in buildings E, C, and D. The wake flow of the construction site created a region of negative air- pressure in the space between buildings E, C, and D (Panel B) that caused the plume to bend downward, toward buildings C and D Finally it is interesting to observe that in 8 of march following some news about a RED ZONE in lombardia by institution produced lots of people in the night to go in south- region using train. But it is not possible to verify if in this people there was or not positive one to covid -19. This fact can be a factor to be taken in consideration in the diffusion of virus in south.
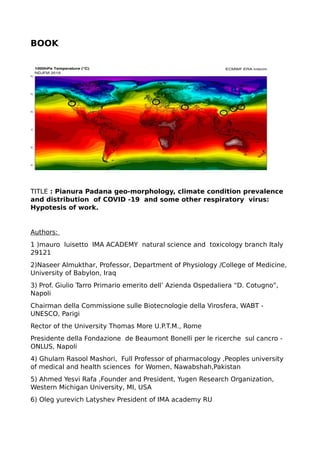
  • 21. Fig. 10 Median annual ITALIA temperature Related climate is possible to verify that , observing fig.8 it seem there are 2 different ZONE In north vs south. Fig. 11 world most polluted regions No2
  • 22. Fig.12 coronavirus belt – latitude screenshot from the University of Maryland study shows coronavirus hotspots along the same climate band. (Screengrab) Fig. 13v 11 gennaio 2020 Pressione al suolo e vettori vento Pianura padana
  • 23. And according Prof. Giulio Tarro related covid -19 spread in Italy: “In Italy the regions more hit are the same ones that have the greatest productive activity and therefore more millions of tons of special products.”(18) CHAPTER 5) Discussion and conclusion The HYPOTESYS of this work It is ranged as opinions of the authors to verify if the climate condition of PIANURA PADANA and air pollution level may contribute or not in the speed and severity of global covid -19 great diffusion in north of Italy as a severe disease. Factors such kind of geomorphological environment with specific climate condition and natural separation by mountains presence at north and south of italia. In this study the strange velocity in diffusion in north vs south of Italy need new research: observing lethality rate of Lombardia 17,9 % vs 9 % of the rest of Italy it seem that could be 2 different AREA in Italy related this virus diffusion. Latitude, climate , air pollution and what other factor acts ? as well as to known people direct attachement ( contamination ) and those subclinical infected persons? Only The lockdown strategies produced this? And the role played by high way diffusion ( trucks and other road transport of goods )in cross APPENINI MOUTNAINS is a fact to be taken in consideration? The relationship between air pollution and respiratory disease , acute and chronic are a scientific Proof of relationship. In spite of this work have offer some aspect in diffusion of disease but the authors submit to the researcher the need to verify this HYPOTESYS OF WORK in diffusion – spread of Covid -19 in Italian regions.
  • 24. CHAPTHER 6 ) References 1) https://www.scienzainrete.it/articolo/coronavirus-ha-viaggiato- autostrada/giovanni-sebastiani/2020-04-09 2) Epidemiology and Diffusion of Some Relevant Virus: Latitude, Air Pollutants and Humidity Role. Hypothesis of Work: COVID 19 Effect on the Air Pollution in Some World Region: What Implications? Luisetto et al 2020 EC CRONICON J. PULMUNOLOGY AND RESPIRATOY MED. 3) POSITION PAPER: “Relazione circa l’effetto dell’inquinamento da particolato atmosferico e la diffusione di virus nella popolazione” univ. BARI, BOLOGNA e SIMA 4) https://www.lastampa.it/blogs/2017/11/07/news/inquinamento- atmosferico-perche-l-aria-della-pianura-padana-e-tra-le-peggiori-d- europa-1.37181946 5) Influenza seasonality: Lifting the fog Proc Natl Acad Sci U S A. 2009 Mar 10; 106(10): 3645–3646. doi: 10.1073/pnas.0900933106 Marc Lipsitcha,1 and Cécile Viboudb 6) Absolute humidity modulates influenza survival, transmission, and seasonality Jeffrey Shamana,1 and Melvin Kohnb PNAS March 3, 2009 106 (9) 3243-3248; https://doi.org/10.1073/pnas.0806852106 7) Scafetta, N.: A Proposal for Isotherm World Maps to Forecast the Seasonal Evolution of the SARS-CoV-2 Pandemic, Preprints 2020, 2020040063. DOI: 10.20944/preprints202004.0063.v1 8) Ambient Influenza and Avian Influenza Virus during Dust Storm Days and Background Days Apri l 2010E nvironmental Health Perspectives 118(9):1211-6 DOI: 10.1289/ehp.0901782 Chen P-S et al 9) Air pollution and case fatality of SARS in the People's Republic of China: an ecologic study Yan Cui, Zuo-Feng Zhang, John Froines, Jinkou Zhao, Hua Wang, Shun-Zhang Yu & Roger Detels Environmental Health volume 2, Article number: 15 (2003) 10) DOI:10.1007/s11356-016-7228-6Corpus ID: 43151342 Haze is a risk factor contributing to the rapid spread of respiratory syncytial virus in children Qing Ye, Jun-Fen F
  • 25. 11) Airborne transmission may have played a role in the spread of 2015 highly pathogenic avian influenza outbreaks in the United States August 2019Scientific Reports 9(1):11755 12) Roles of meteorological conditions in COVID-19 transmission on a worldwide scale Biqing Chen et al Preprint MEDRXIV 2020 www.medrxiv.org/content/10.1101/2020.03.16.20037168v1 13) Letter to the EditorSARS-Cov-2 RNA Found on Particulate Matter of Bergamo in Northern Italy: First Preliminary Evidence Leonardo Setti et al preprint medrxiv https://doi.org/10.1101/2020.04.15.20065995 14)environment international Airborne transmission of SARS-CoV-2: The world should face the realitylLidiaMorawskaa JunjiCaob https://doi.org/10.1016/j.envint.2020.105730 15) Fineberg, H.V. Rapid Expert Consultation on the Possibility of Bioaerosol Spread of SARS-CoV-2 for the COVID-19 Pandemic (April 1, 2020). In: The National Academies Press N.R.C., ed. Washington, DC: The National Academies Press, National Research Council 2020; 2020. 16) Airborne Transmission of Influenza A/H5N1 Virus Between Ferrets Sander Herfst,1 Eefje J. A. Schrauwen,1 Martin Linster,1 Salin Chutinimitkul,1 Emmie de Wit,1* Vincent J. Munster,1* Erin M. Sorrell,1 Theo M. Bestebroer,1 David F. Burke,2 Derek J. Smith,1,2,3 Guus F. Rimmelzwaan,1 Albert D. M. E. Osterhaus,1 Ron A. M. Fouchier1†www.sciencemag.org SCIENCE VOL 336 22 JUNE 2012 17) n engl j med 350;17 www.nejm.org april 22, 2004n engl j med 350;17www.nejm.org april 22, 2004 The new england journal of Medicine 1731 original article Evidence of Airborne Transmission of the Severe Acute Respiratory Syndrome Virus Ignatius T.S. Yu, M.B., B.S., M.P.H., Yuguo Li, Ph.D., Tze Wai Wong, M.B., B.S., Wilson Tam, M.Phil., Andy T. Chan, Ph.D., Joseph H.W. Lee, Ph.D., Dennis Y.C. Leung, Ph.D., and Tommy Ho, B.Sc 18) Research article THE SPREAD OF THE NEW CORONAVIRUS Giulio Tarro Asian Journal of Science and Technology Vol. 11, Issue, 03, pp.10863-10865, March, 2020
  • 26. Other web references https://www.liberoquotidiano.it/news/italia/22183857/coronavirus_franco_prodi_ pietro_senaldi_aria_infezione_libero.html Clarifications : Some part of this work are in Italian language in order to follow the original author meaning This work is produced without any diagnostic or therapeutic intent , only to produce HYPOTESIS of work to be submitted to the researcher. All the rules . governative and regionals normatives, all the measure taken by Italian and World health organization related preventing the diffusion of covid 19 must to be followed and this work not is produced to avoid this . All the figure are presented only for scientific scope and the references of original article are reported. Conflict of interests: no