Download as PDF, PPTX

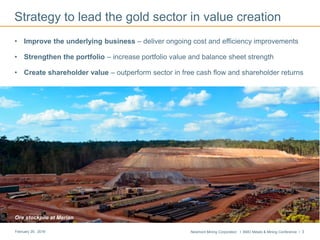
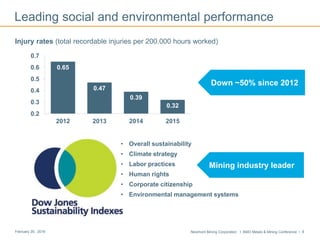
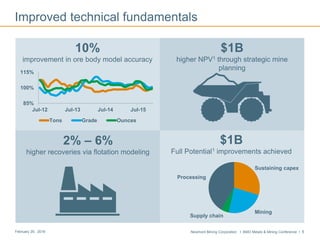
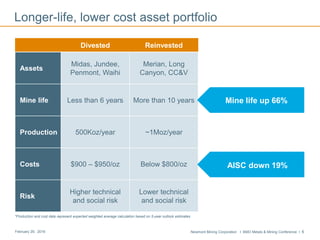
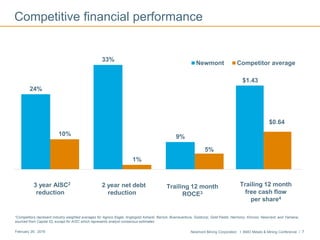
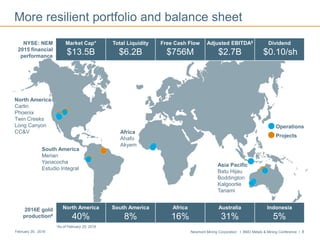
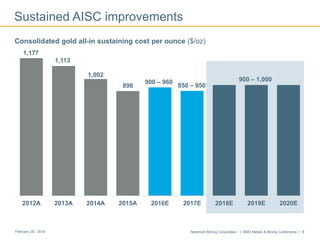
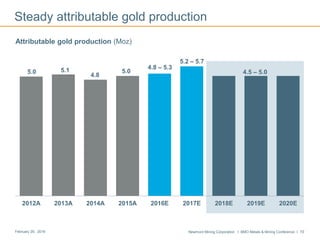
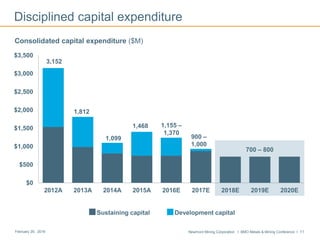
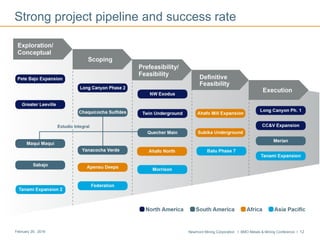
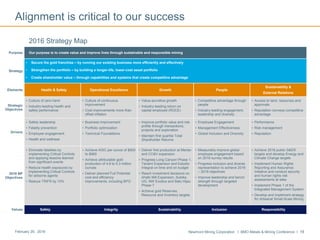
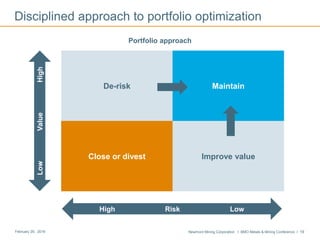
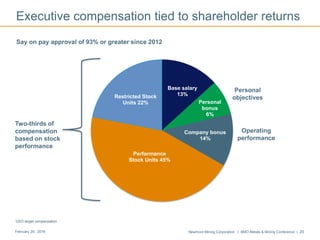
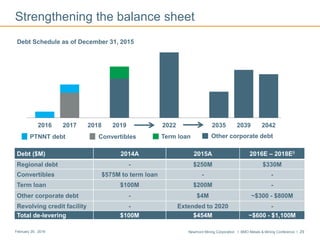
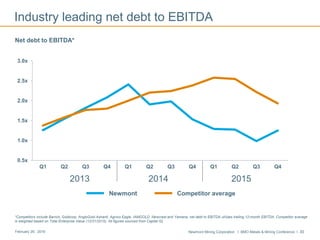
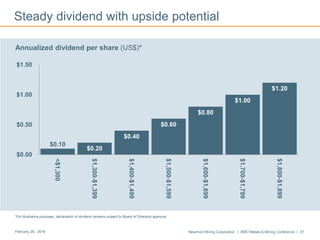
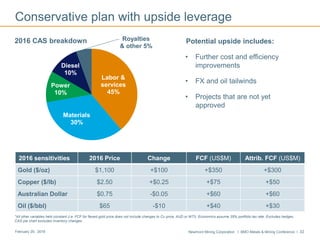
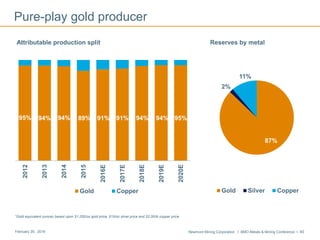


Gary Goldberg, President and CEO of Newmont Mining Corporation, presented at the BMO Metals & Mining Conference on February 29, 2016. The presentation included forward-looking statements and cautioned that actual results could differ materially from expectations. It provided an overview of Newmont's strategy to improve the underlying business, strengthen its portfolio, and create shareholder value. Key highlights included ongoing cost and efficiency improvements, a focus on projects with long mine lives and lower costs, and strong financial and operating performance.


