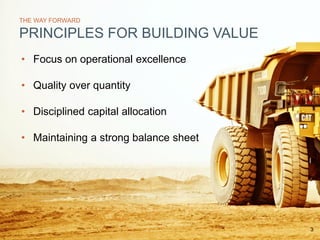
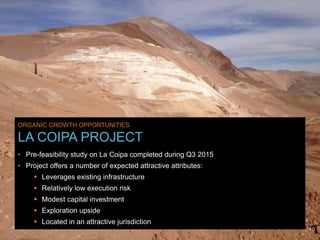
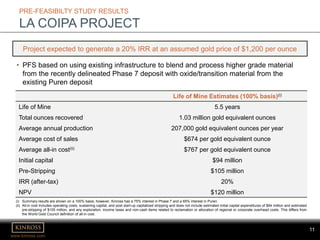
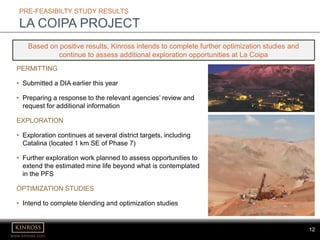
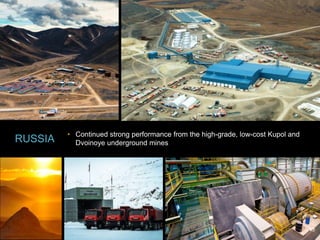
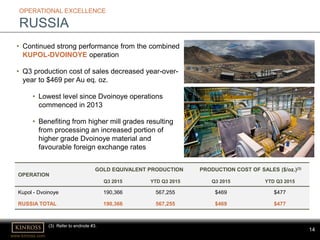
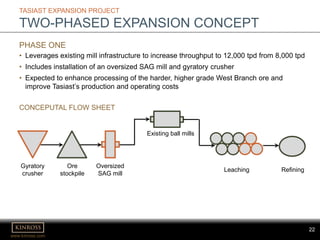
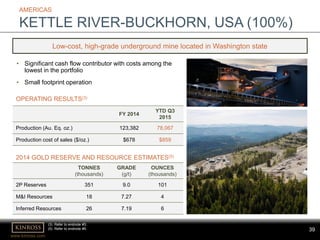
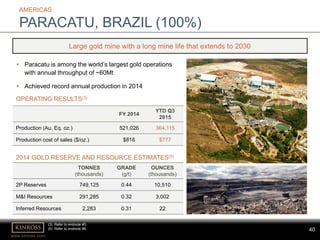
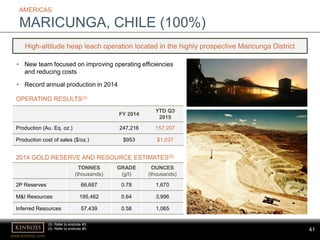
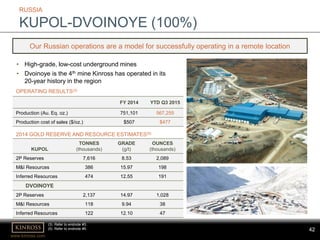
SlideShare a Scribd company logo
www.kinross.com
1
KINROSS GOLD CORPORATION
TD SECURITIES 2016 MINING CONFERENCE
January
2016
www.kinross.com
2
CAUTIONARY STATEMENT ON FORWARD-LOOKING
INFORMATION
All statements, other than statements of historical fact, contained or incorporated by reference in or made in giving this presentation and responses to questions,
including but not limited to any information as to the future performance of Kinross, constitute “forward looking statements” within the meaning of applicable securities
laws, including the provisions of the Securities Act (Ontario) and the provisions for “safe harbour” under the United States Private Securities Litigation Reform Act of
1995 and are based on expectations, estimates and projections as of the date of this presentation. Forward-looking statements contained in this presentation include
those statements on slides with, and statements made under, the headings “The Way Forward - Principles for Building Value”, “2015 Outlook - Guidance Update”, “New
Processing Initiative at Paracatu”, “Organic Growth Opportunities”, “Pre-feasibility Study Results”, Life of Mine Estimates”, “Russia - Near-Site Exploration Targets”,
“Chirano Mine Life Extension”, “Tasiast Expansion Project”, “Strong Balance Sheet”, “Levers for Reducing Costs”, “Compelling Valuation”, “Kinross Value Proposition”
and “2014 Gold Reserve and Resource Estimates”, and include without limitation statements with respect to our guidance for production, production costs of sales, all-in
sustaining cost and capital expenditures, continuous improvement and other cost savings opportunities, as well as references to other possible events include, without
limitation, possible events; opportunities; statements with respect to possible events or opportunities; estimates and the realization of such estimates; future
development, mining activities, production and growth, including but not limited to cost and timing; success of exploration or development of operations; the future price
of gold and silver; currency fluctuations; expected capital requirements; government regulation; and environmental risks. The words “2015E”, “alternatives”,
“compelling”, “concept”, “encouraging”, “estimate”, “expect”, “explore”, “feasibility”, “flexibility”, “forecast”, “focus”, “FS”, “future”, “guidance”, “initiative”, “indicate”,
“intend”, “objective”, “on track”, “opportunity”, “optimize”, “option”, “outlook”, “plan”, “PFS”, “positioned”, “possible”, “potential”, “pre-feasibility”, “principles”, “priority”,
“project”, “prospective”, “pursue”, “risk”, “strategy”, “study”, “target” or “way forward”, or variations of such words and phrases or statements that certain actions, events
or results may, can, could, would, should, might, indicates, achieved or will be taken, and similar expressions identify forward looking statements. Forward-looking
statements are necessarily based upon a number of estimates and assumptions that, while considered reasonable by Kinross as of the date of such statements, are
inherently subject to significant business, economic and competitive uncertainties and contingencies. Statements representing management’s financial and other
outlook have been prepared solely for purposes of expressing their current views regarding the Company’s financial and other outlook and may not be appropriate for
any other purpose. Many of these uncertainties and contingencies can affect, and could cause, Kinross’ actual results to differ materially from those expressed or
implied in any forward looking statements made by, or on behalf of, Kinross. There can be no assurance that forward looking statements will prove to be accurate, as
actual results and future events could differ materially from those anticipated in such statements. All of the forward looking statements made in this presentation are
qualified by these cautionary statements, and those made in our filings with the securities regulators of Canada and the U.S., including but not limited to those
cautionary statements made in the “Risk Factors” section of our most recently filed Annual Information Form, the “Risk Analysis” section of our FYE 2014 and Q3 2015
Management’s Discussion and Analysis, and the “Cautionary Statement on Forward-Looking Information” in our news releases dated November 10 and November 12,
2015, to which readers are referred and which are incorporated by reference in this presentation, all of which qualify any and all forward‐looking statements made in this
presentation. These factors are not intended to represent a complete list of the factors that could affect Kinross. Kinross disclaims any intention or obligation to update
or revise any forward‐looking statements or to explain any material difference between subsequent actual events and such forward‐looking statements, except to the
extent required by applicable law.
Other information
Where we say "we", "us", "our", the "Company", or "Kinross" in this presentation, we mean Kinross Gold Corporation and/or one or more or all of its subsidiaries, as may
be applicable. The technical information about the Company’s mineral properties (other than exploration activities) contained in this presentation has been prepared
under the supervision of Mr. John Sims, an officer of the Company who is a “qualified person” within the meaning of National Instrument 43-101 (“NI 43-101”). The
technical information about the Company’s exploration activities contained in this presentation has been prepared under the supervision of Mr. Sylvain Guerard, an
officer of the Company who is a “qualified person” within the meaning of NI 43-101.
www.kinross.com
3
• Focus on operational excellence
• Quality over quantity
• Disciplined capital allocation
• Maintaining a strong balance sheet
3
THE WAY FORWARD
PRINCIPLES FOR BUILDING VALUE
www.kinross.com
4
DELIVERING OPERATIONAL EXCELLENCE
www.kinross.com
5
Q3 2015 YTD Q3 2015 2015 GUIDANCE(1)
Gold equivalent production (oz.)(2) 680,679 1,970,937 2.5 to 2.6 Moz.
Production cost of sales ($/oz.)(3) $668 $699 $690 to $730
All-in sustaining cost ($/oz.)(4) $941 $970 $975 to $1,025
Capital Expenditures ($M) $171 $449 $650
THIRD QUARTER HIGHLIGHTS
DELIVERING STRONG PERFORMANCE
• Strong performance from operations delivered solid Q3 2015 results
• On track to meet 2015 REVISED guidance for production, cost of sales and all-in
sustaining cost
• Expect to come in BELOW 2015 guidance for capital expenditures and overhead costs
Continuing track record of meeting or beating our operational targets
(1) Refer to endnote #1.
(2) Refer to endnote #2.
(3) Refer to endnote #3.
(4) Refer to endnote #4.
www.kinross.com
6
2015E GOLD EQUIVALENT
PRODUCTION(1,2)
OPERATIONAL EXCELLENCE
DIVERSIFIED PORTFOLIO OF OPERATING MINES
GLOBAL PORTFOLIO
Operating mine
Development project
Round Mountain
Kettle River-Buckhorn
Fort Knox
La Coipa
Paracatu
Maricunga
Kupol
Dvoinoye
Chirano
Tasiast
AMERICASRUSSIA
WEST AFRICA
(3) Refer to endnote #3.
Over 50% of estimated 2015 gold equivalent production from mines located in the Americas
54%
17%
29%
Americas West Africa Russia
2.5-2.6M
ounces
(1) Refer to endnote #1.
(2) Refer to endnote #2.
www.kinross.com
7
• Five mines located in the US, Brazil and Chile
• Over 50% of annual production is from the Americas region
AMERICAS
7
www.kinross.com
8
OPERATIONAL EXCELLENCE
AMERICAS
• ROUND MOUNTAIN benefiting from
continuous improvement initiatives aimed
at improving heap leach operations
• FORT KNOX production cost of sales
benefiting from lower power costs and
higher production
OPERATION
GOLD EQUIVALENT PRODUCTION PRODUCTION COST OF SALES ($/oz.)(3)
Q3 2015 YTD Q3 2015 Q3 2015 YTD Q3 2015
Fort Knox 115,258 313,992 $556 $604
Round Mountain (50%) 58,074 146,784 $687 $769
Kettle River - Buckhorn 24,222 78,067 $795 $859
Paracatu 129,064 364,115 $747 $777
Maricunga 52,672 157,207 $1,004 $1,037
AMERICAS TOTAL 379,290 1,060,165 $718 $769
(3) Refer to endnote #3.
• PARACATU production increased due to
higher mill grades and increased recovery,
which improved cost of sales
 Temporarily suspended Plant 1 and
reduced operations at Plant 2 due to
lack of rainfall
 Not expected to impact 2015 regional or
company-wide guidance
www.kinross.com
9
AMERICAS
NEW PROCESSING INITIATIVE AT PARACATU
Modest capital investment to add low-cost, incremental production
• Low-cost, incremental production
resulting from:
 Enriched grades near discharge
areas of the facility
 Utilization of excess capacity in
Plant 1 due to ore blending strategy
 Lower energy consumption as no
grinding required
• Modest capital investment of $20 million
www.kinross.com
10
ORGANIC GROWTH OPPORTUNITIES
LA COIPA PROJECT
• Pre-feasibility study on La Coipa completed during Q3 2015
• Project offers a number of expected attractive attributes:
 Leverages existing infrastructure
 Relatively low execution risk
 Modest capital investment
 Exploration upside
 Located in an attractive jurisdiction
10
www.kinross.com
11
PRE-FEASIBILTY STUDY RESULTS
LA COIPA PROJECT
Life of Mine Estimates (100% basis)(i)
Life of Mine 5.5 years
Total ounces recovered 1.03 million gold equivalent ounces
Average annual production 207,000 gold equivalent ounces per year
Average cost of sales $674 per gold equivalent ounce
Average all-in cost(ii) $767 per gold equivalent ounce
Initial capital $94 million
Pre-Stripping $105 million
IRR (after-tax) 20%
NPV $120 million
• PFS based on using existing infrastructure to blend and process higher grade material
from the recently delineated Phase 7 deposit with oxide/transition material from the
existing Puren deposit
Project expected to generate a 20% IRR at an assumed gold price of $1,200 per ounce
(i) Summary results are shown on a 100% basis, however, Kinross has a 75% interest in Phase 7 and a 65% interest in Puren.
(ii) All-in cost includes operating costs, sustaining capital, and post start-up capitalized stripping and does not include estimated initial capital expenditures of $94 million and estimated
pre-stripping of $105 million, and any exploration, income taxes and non-cash items related to reclamation or allocation of regional or corporate overhead costs. This differs from
the World Gold Council definition of all-in cost.
www.kinross.com
12
PRE-FEASIBILTY STUDY RESULTS
LA COIPA PROJECT
PERMITTING
• Submitted a DIA earlier this year
• Preparing a response to the relevant agencies’ review and
request for additional information
EXPLORATION
• Exploration continues at several district targets, including
Catalina (located 1 km SE of Phase 7)
• Further exploration work planned to assess opportunities to
extend the estimated mine life beyond what is contemplated
in the PFS
OPTIMIZATION STUDIES
• Intend to complete blending and optimization studies
Based on positive results, Kinross intends to complete further optimization studies and
continue to assess additional exploration opportunities at La Coipa
www.kinross.com
13
• Continued strong performance from the high-grade, low-cost Kupol and
Dvoinoye underground minesRUSSIA
13
www.kinross.com
14
OPERATIONAL EXCELLENCE
RUSSIA
• Continued strong performance from the combined
KUPOL-DVOINOYE operation
• Q3 production cost of sales decreased year-over-
year to $469 per Au eq. oz.
• Lowest level since Dvoinoye operations
commenced in 2013
• Benefiting from higher mill grades resulting
from processing an increased portion of
higher grade Dvoinoye material and
favourable foreign exchange rates
(3) Refer to endnote #3.
OPERATION
GOLD EQUIVALENT PRODUCTION PRODUCTION COST OF SALES ($/oz.)(3)
Q3 2015 YTD Q3 2015 Q3 2015 YTD Q3 2015
Kupol - Dvoinoye 190,366 567,255 $469 $477
RUSSIA TOTAL 190,366 567,255 $469 $477
www.kinross.com
15
RUSSIA
NEAR-SITE EXPLORATION TARGETS
MOROSHKA
• Located approximately 4 km East of Kupol
• Drilling defined ~198koz. gold and ~2.3Moz.
silver of estimated Indicated Mineral
Resources(5)
SEPTEMBER NORTH-EAST
• Located approximately 15 km NW of
Dvoinoye
• Drilling defined high-grade gold
mineralization over a strike length of 150 m
• Work planned in 2015 to define an initial
mineral resource estimate
For additional information, please see Kinross’ news release dated February 10, 2015 and Appendices A and B, which are available on our website at
www.kinross.com , as well as the Explanatory Notes available on slide 47 of this presentation.
(5) Refer to endnote #5.
www.kinross.com
16
RUSSIA
FOREIGN INVESTMENT
The world’s leading companies are continuing to invest in Russia in 2015
www.kinross.com
17
RUSSIA
FOREIGN INVESTMENT ADVISORY COUNCIL
FIAC is chaired by the Russian Prime Minister and includes CEOs from
over 50 international companies
www.kinross.com
18
• Record annual production for Tasiast and Chirano in 2014
• Strong focus on optimizing efficiency and performance
WEST
AFRICA
18
www.kinross.com
19
OPERATIONAL EXCELLENCE
WEST AFRICA
• TASIAST production decreased compared with
Q2 2015 due mainly to the wind-down of dump
leach production
• CHIRANO production decreased as a result of
expected lower grades due to declining
contribution from the Akwaaba underground
deposit
• Development of the Akoti decline continued,
with ~250 metres completed at quarter-end
• Production from Akoti is expected to begin
in the second half of 2016
(2) Refer to endnote #2.
(3) Refer to endnote #3.
OPERATION
GOLD EQUIVALENT PRODUCTION PRODUCTION COST OF SALES ($/oz.)(3)
Q3 2015 YTD Q3 2015 Q3 2015 YTD Q3 2015
Tasiast 53,440 165,339 $1,057 $1,042
Chirano (90%)(2) 57,583 178,178 $701 $675
WEST AFRICA TOTAL 111,023 343,517 $880 $848
www.kinross.com
20
• Extension of estimated mine life to 2020 with additional mineral resource estimates at
two deposits:
 Paboase (currently in production)
 Akoti underground (production expected to begin mid-2016)
• Provides additional time to pursue exploration potential in a highly-prospective region
WEST AFRICA
CHIRANO MINE LIFE EXTENSION
1 km
MAMNAOSARIEHUAKWAABA SURAW PABOASE TANOAKOTI
Mine life extension at one of Kinross’ lowest cost operations
For additional information, please refer to our Annual Mineral Reserve and Mineral Resource Statement as at December 31, 2014 contained in our news
release dated February 10, 2015, available on our website at www.kinross.com.
www.kinross.com
21
ORGANIC GROWTH OPPORTUNITIES
PHASED APPROACH TO A TASIAST MILL EXPANSION
• Concept under study would add incremental capacity to increase mill throughput in
two phases by leveraging existing infrastructure
 PHASE ONE would increase throughput to 12,000 tpd with the addition of a
gyratory crusher and oversized SAG mill
 PHASE TWO could further increase total throughput to as much as 38,000 tpd
with additional milling, leaching, thickening and refining capacity
• Opportunity to realize Tasiast’s growth potential while substantially lowering overall
capital costs compared with the previous estimate of $1.6B
21
www.kinross.com
22
TASIAST EXPANSION PROJECT
TWO-PHASED EXPANSION CONCEPT
CONCEPUTAL FLOW SHEET
PHASE ONE
• Leverages existing mill infrastructure to increase throughput to 12,000 tpd from 8,000 tpd
• Includes installation of an oversized SAG mill and gyratory crusher
• Expected to enhance processing of the harder, higher grade West Branch ore and
improve Tasiast’s production and operating costs
Gyratory
crusher
Ore
stockpile
Oversized
SAG mill
Existing ball mills
Leaching Refining
www.kinross.com
23
Highlights of the early detailed engineering work completed to date on Phase One
TASIAST EXPANSION PROJECT
PHASE ONE ESTIMATES
Metric Estimates
Average annual production – first 2 years 368,000 gold ounces
Cash cost per ounce – first 2 years $575 per gold equivalent ounce
All-in sustaining cost per ounce – first 2 years(i) $725 per gold equivalent ounce
Initial capital $290 million
Construction period 2 years
The initial capital expenditure estimate of
$290 million includes:
• Installation of an oversized SAG mill,
gyratory crusher and 3 leach tanks
• Maintenance improvements to other
components of the processing circuit
Category ($ millions)
Direct cost (including freight) $180
Indirect and owner’s cost $80
Contingency $30
INITIAL CAPITAL ESTIMATE
(i) All-in sustaining cost includes operating costs, royalties, sustaining capital, and does not include estimated initial capital expenditures of $290 million during
the two-year construction period, pre-stripping of $483 million during two-year construction period and first two years of production, and any exploration,
income taxes and non-cash items related to reclamation or allocation of regional or corporate overhead costs. This differs from the World Gold Council
definition of all-in cost.
www.kinross.com
24
TASIAST EXPANSION PROJECT
TWO-PHASED EXPANSION CONCEPT
CONCEPUTAL FLOW SHEET
PHASE TWO
• Could further increase total throughput to as much as 38,000 tpd with the addition of
milling, leaching, thickening and refining capacity
Gyratory
crusher
Ore
stockpile
Oversized
SAG mill Additional ball
milling capacity
Additional leaching
capacity
Thickening
www.kinross.com
25
A FINANCIALLY PRUDENT ALTERNATIVE TO REALIZING TASIAST’S GROWTH POTENTIAL
• A feasibility study on the initial Phase One project to increase throughput to 12,000 tpd is
expected to be completed in Q1 2016
• Upon completion of the FS, further details regarding project economics and Phase Two of a
potential expansion would be released
• Any potential go-forward decision will depend on a range of factors, including gold price
environment, expected economic returns and various technical considerations
TASIAST EXPANSION PROJECT
A PHASED APPROACH TO A MILL EXPANSION
A phased approach would optimize the current operation in the near-term while reducing
overall capital cost of a larger expansion
TASIAST OREBODY & RESOURCE PIT(i)
(i) For additional information, please refer to the Tasiast Technical Report dated March 31, 2014 and to our Annual Mineral Reserve and Mineral Resource
Statement as at December 31, 2014 contained in our news release dated February 10, 2015, both available on our website at www.kinross.com.
www.kinross.com
26
STRONG FINANCIAL DISCIPLINE
www.kinross.com
27
STRONG BALANCE SHEET
SOLID FINANCIAL POSITION(i)
$1.0
$1.5
Cash, cash equivalents and restricted cash
Undrawn credit facilities
STRONG LIQUIDITY POSITION
Maintaining balance sheet strength & financial flexibility remain priority objectives
MAINTAINING FINANCIAL FLEXIBILITY
• Improved balance sheet during the first 9 months of
2015:
 Added $41M to cash position, ending the period
with over $1.0B in cash and cash equivalents
 Repaid over $80M of debt and reduced net debt
position to under $950M
• Only debt maturity prior to 2019 is $250M of senior
notes due in 2016
• Pre-paid the remaining balance of the Kupol loan
which was due in 2016
$2.5B
AS AT SEP. 30, 2015
(i) Information on this slide is as at September 30, 2015 and does not take into account the Nevada asset purchase announced November 12, 2015.
Kinross’ liquidity position proforma the transaction is estimated to be $1.9B.
www.kinross.com
28
FINANCIAL DISCIPLINE
FOCUS ON MANAGING COSTS
REVIEW OF DISCRETIONARY SPENDING
• Completed company-wide review of overhead
spending and organizational structure
• Reduced corporate labour costs by 23%, with
expected annualized savings of $20M
OPERATIONAL IMPROVEMENTS
• Achieving cost savings through continuous
improvement initiatives. Highlights include:
 Transition to self-perform mining at CHIRANO
 Ore-blending strategy at PARACATU
 ROUND MOUNTAIN heap leach enhancements
contributing to highest production in 6 years with
lowest cost of sales since Q3 2012
ALL-IN SUSTAINING COST(4)
($ per gold equivalent ounce)
(4) Refer to endnote #4.
$1,122
$1,082
$973 $970
2012 2013 2014 YTD Q3 2015
www.kinross.com
29
FINANCIAL DISCIPLINE
LEVERS FOR REDUCING COSTS
Proactively managing our business with a strict focus on the health of our balance sheet
Market factors outside of our
control
Levers for reducing costs
FX
Oil
Gold price
Higher cost mines
Discretionary spending
Opex
CASH
FLOW
www.kinross.com
30
COMPELLING VALUATION
www.kinross.com
31
0.0
1.0
2.0
3.0
4.0
5.0
6.0
Barrick Newmont Goldcorp Kinross Agnico Yamana Eldorado
2016E GOLD PRODUCTION(i) (Moz.)
21.8%
14.6%
9.2% 8.9%
7.5%
6.5%
5.1%
Kinross Yamana Goldcorp Newmont Eldorado Barrick Agnico
2016E FREE CASH FLOW YIELD(ii)
(i) Source: TD Securities research: “2016/17 Precious Metals Preview” – January 22, 2016.
(ii) Source: Bloomberg; TD Securities research: “2016/17 Precious Metals Preview” – January 22, 2016
COMPELLING VALUATION
PRODUCTION AND FREE CASH FLOW YIELD
www.kinross.com
32
COMPELLING VALUATION
NET DEBT TO EBITDA (LTM)
Source: Bloomberg, company reports
Information on this slide is as at September 30, 2015 and does not take into account the Nevada asset purchase announced November 12, 2015. Adjusting for
the $610 million in cash paid to Barrick and the EBITDA for Bald Mountain (100%) and Round Mountain (additional 50%) for the last twelve months, Kinross’
proforma net debt to EBITDA ratio for the last twelve months would be 1.4x
2.9
2.6
1.9
1.3
1.2
1.1
0.6
Barrick Yamana Goldcorp Agnico Newmont Kinross Eldorado
www.kinross.com
33
COMPELLING VALUATION
ENTERPRISE VALUE VERSUS PRODUCTION
2016E Gold
Production
(Moz.)(ii)
Delta with
Kinross
(US$B)
Multiple of
Kinross
Enterprise
Value
Barrick 5.4 19.0 7.8
Newmont 5.1 12.4 5.4
Goldcorp 3.4 8.2 3.9
Kinross 2.8 - -
Agnico 1.6 4.1 2.5
Yamana 1.3 0.4 1.1
Eldorado 0.7 (0.7) 0.8
(i) Source: Bloomberg – January 22, 2016; Company reports
(ii) Source: TD Securities research: “2016/17 Precious Metals Preview” – January 22, 2016.
$21.8
$15.2
$11.0
$6.9
$3.2 $2.8
$2.1
Barrick Newmont Goldcorp Agnico Yamana Kinross Eldorado
Enterprisevalue(US$billions)(i)
www.kinross.com
34
Bloomberg analyst consensus – January 22, 2016.
COMPELLING VALUATION
2016E METRICS
Attractive value opportunity relative to peers, considering Kinross’ annual production,
cost structure, track record and growth opportunities
EV / 2016E EBITDA P / 2016E OPERATING CF
9.7
7.8
7.1
6.8 6.8
5.3
3.1
Agnico Eldorado Barrick Goldcorp Newmont Yamana Kinross
9.1
6.9
5.5
4.8 4.7
2.7
2.1
Agnico Eldorado Goldcorp Newmont Barrick Yamana Kinross
www.kinross.com
35
KINROSS VALUE PROPOSITION
EXCELLENT OPERATIONAL TRACK RECORD
• Continuing to meet or outperform our operational targets
STRONG BALANCE SHEET
• $2.5B in liquidity(i) and conservative net debt of ~$950M
• Repaid the Kupol loan during Q3, ahead of schedule
ATTRACTIVE FUTURE GROWTH OPPORTUNITIES
• La Coipa pre-feasibility study generated positive results
• Phased approach to Tasiast expansion offers a financially
prudent alternative to realizing significant growth potential
• Advancing organic production initiatives at Paracatu and
Chirano
COMPELLING VALUATION
• Attractive value opportunity relative to peers, considering
annual production, cost structure, track record and relatively
low-risk growth opportunities
SHARE INFORMATION
K – Toronto Stock Exchange
KGC – New York Stock Exchange
(i) As at September 30, 2015. This figure does not take into account Kinross’ acquisition of Nevada assets announced November 12, 2015.
Kinross’ liquidity position proforma the transaction is $1.9B.
www.kinross.com
36
APPENDIX
www.kinross.com
37
• Impressive track record of operational excellence
AMERICAS
FORT KNOX, USA (100%)
TONNES
(thousands)
GRADE
(g/t)
OUNCES
(thousands)
2P Reserves 163,844 0.46 2,398
M&I Resources 105,453 0.43 1,446
Inferred Resources 13,500 0.44 189
(3) Refer to endnote #3.
(5) Refer to endnote #5.
FY 2014
YTD Q3
2015
Production (Au. Eq. oz.) 379,453 313,992
Production cost of sales ($/oz.) $712 $604
OPERATING RESULTS(3)
2014 GOLD RESERVE AND RESOURCE ESTIMATES(5)
Among the world’s few cold climate heap leach facilities
www.kinross.com
38
• On November 12, 2015, Kinross announced an
agreement to purchase the other 50% of Round
Mountain from Barrick Gold Corporation
AMERICAS
ROUND MOUNTAIN, USA (50%)*
TONNES
(thousands)
GRADE
(g/t)
OUNCES
(thousands)
2P Reserves 27,300 0.79 689
M&I Resources 23,768 0.58 440
Inferred Resources 7,861 0.51 130
FY 2014
YTD Q3
2015
Production (Au. Eq. oz.) 169,839 146,784
Production cost of sales ($/oz.) $855 $769
Round Mountain is a best-practice leader in many areas, including preventative maintenance
OPERATING RESULTS(3)
2014 GOLD RESERVE AND RESOURCE ESTIMATES(5)
(3) Refer to endnote #3.
(5) Refer to endnote #5.
www.kinross.com
39
• Significant cash flow contributor with costs among the
lowest in the portfolio
• Small footprint operation
AMERICAS
KETTLE RIVER-BUCKHORN, USA (100%)
TONNES
(thousands)
GRADE
(g/t)
OUNCES
(thousands)
2P Reserves 351 9.0 101
M&I Resources 18 7.27 4
Inferred Resources 26 7.19 6
FY 2014
YTD Q3
2015
Production (Au. Eq. oz.) 123,382 78,067
Production cost of sales ($/oz.) $678 $859
Low-cost, high-grade underground mine located in Washington state
OPERATING RESULTS(3)
2014 GOLD RESERVE AND RESOURCE ESTIMATES(5)
(3) Refer to endnote #3.
(5) Refer to endnote #5.
www.kinross.com
40
• Paracatu is among the world’s largest gold operations
with annual throughput of ~60Mt
• Achieved record annual production in 2014
AMERICAS
PARACATU, BRAZIL (100%)
TONNES
(thousands)
GRADE
(g/t)
OUNCES
(thousands)
2P Reserves 749,125 0.44 10,510
M&I Resources 291,285 0.32 3,002
Inferred Resources 2,283 0.31 22
FY 2014
YTD Q3
2015
Production (Au. Eq. oz.) 521,026 364,115
Production cost of sales ($/oz.) $816 $777
Large gold mine with a long mine life that extends to 2030
OPERATING RESULTS(3)
2014 GOLD RESERVE AND RESOURCE ESTIMATES(5)
(3) Refer to endnote #3.
(5) Refer to endnote #5.
www.kinross.com
41
• New team focused on improving operating efficiencies
and reducing costs
• Record annual production in 2014
AMERICAS
MARICUNGA, CHILE (100%)
TONNES
(thousands)
GRADE
(g/t)
OUNCES
(thousands)
2P Reserves 66,687 0.78 1,670
M&I Resources 195,462 0.64 3,996
Inferred Resources 57,439 0.58 1,065
FY 2014
YTD Q3
2015
Production (Au. Eq. oz.) 247,216 157,207
Production cost of sales ($/oz.) $953 $1,037
High-altitude heap leach operation located in the highly prospective Maricunga District
OPERATING RESULTS(3)
2014 GOLD RESERVE AND RESOURCE ESTIMATES(5)
(3) Refer to endnote #3.
(5) Refer to endnote #5.
www.kinross.com
42
• High-grade, low-cost underground mines
• Dvoinoye is the 4th mine Kinross has operated in its
20-year history in the region
RUSSIA
KUPOL-DVOINOYE (100%)
KUPOL
TONNES
(thousands)
GRADE
(g/t)
OUNCES
(thousands)
2P Reserves 7,616 8.53 2,089
M&I Resources 386 15.97 198
Inferred Resources 474 12.55 191
DVOINOYE
2P Reserves 2,137 14.97 1,028
M&I Resources 118 9.94 38
Inferred Resources 122 12.10 47
FY 2014 YTD Q3 2015
Production (Au. Eq. oz.) 751,101 567,255
Production cost of sales ($/oz.) $507 $477
OPERATING RESULTS(3)
2014 GOLD RESERVE AND RESOURCE ESTIMATES(5)
Our Russian operations are a model for successfully operating in a remote location
(3) Refer to endnote #3.
(5) Refer to endnote #5.
www.kinross.com
43
• Achieved record annual production in 2014
• Continuing effort to reduce operating costs at existing
operation
WEST AFRICA
TASIAST, MAURITANIA (100%)
TONNES
(thousands)
GRADE
(g/t)
OUNCES
(thousands)
2P Reserves 161,822 1.77 9,196
M&I Resources 85,573 1.14 3,148
Inferred Resources 8,951 1.71 492
FY 2014
YTD Q3
2015
Production (Au. Eq. oz.) 260,485 165,339
Production cost of sales ($/oz.) $998 $1,042
Operating mine with a large gold resource located in a prospective district
OPERATING RESULTS(3)
2014 GOLD RESERVE AND RESOURCE ESTIMATES(5)
(3) Refer to endnote #3.
(5) Refer to endnote #5.
www.kinross.com
44
• Chirano is now among our lowest cost operations
following transition to self-perform mining in open pits
and underground
WEST AFRICA
CHIRANO, GHANA (90%)
TONNES
(thousands)
GRADE
(g/t)
OUNCES
(thousands)
2P Reserves 12,055 2.38 924
M&I Resources 15,356 2.46 1,214
Inferred Resources 1,204 3.43 133
FY 2014
YTD Q3
2015
Production (Au. Eq. oz.) 257,888 178,178
Production cost of sales ($/oz.) $591 $675
Cost reductions achieved at Chirano through transition to self-perform mining
OPERATING RESULTS(2,3)
2014 GOLD RESERVE AND RESOURCE ESTIMATES(5)
(2) Refer to endnote #2.
(3) Refer to endnote #3.
(5) Refer to endnote #5.
www.kinross.com
45
OPERATION
PRODUCTION
(Au eq. oz.)
PRODUCTION COST OF SALES(3)
($ per Au eq. oz.)
Fort Knox 379,453 $712
Round Mountain (50%) 169,839 $855
Kettle River – Buckhorn 123,382 $678
Paracatu 521,026 $816
Maricunga 247,216 $953
AMERICAS TOTAL 1,440,916 $804
Kupol-Dvoinoye 751,101 $507
RUSSIA TOTAL 751,101 $507
Tasiast 260,485 $998
Chirano (90%)(2) 257,888 $591
WEST AFRICA TOTAL 518,373 $795
KINROSS TOTAL 2,710,390 $720
OPERATIONAL EXCELLENCE
FY2014 OPERATING RESULTS
(2) Refer to endnote #2.
(3) Refer to endnote #3.
www.kinross.com
46
PRE-FEASIBILTY STUDY RESULTS
LA COIPA PROJECT
Life of Mine Estimates
Mill throughput capacity 13,000 tonnes per day
Average mining rate 80,000 tonnes per day
Average gold grade 1.69 g/t
Average silver grade 61.5 g/t
Average gold recovery 76%
Average silver recovery 59%
Strip ratio (waste:ore) 5.0
• The pre-feasibility study estimates a 5.5 year mine life, following receipt of permits and
commencement of stripping
 Processing expected to commence 1.5 years after pre-stripping has been initiated and continue
for 4 years
Assumptions
Gold price $1,200 per oz.
Silver price $17 per oz.
Oil price $65 per barrel
Chilean Peso 600 to the US dollar
Discount rate 5%
KEY ASSUMPTIONSADDITIONAL OPERATING METRICS
$1,100 $1,200 $1,300
IRR 15% 20% 26%
GOLD PRICE SENSITIVITY
www.kinross.com
47
EXPLANATORY NOTES: EXPLORATION
Kupol & Dvoinoye Exploration Results
All 28 drill holes in 2014 at Providence were diamond drill core holes (HQ or NQ core diameter). The Providence vein dips sub-vertically, therefore,
drill holes are angled between minus 50° and 75° to the east and west.
The composite intervals reported for Providence diamond drill core are selected mainly by geological parameters but some of the intervals are
included taking into account the elevated Au and Ag values of the assay data. The intervals are calculated by taking a weighted average of all gold
and silver fire assay values included. No more than three consecutive metres of internal waste (<1 grams per tonne) is accepted. High grade
samples are not excluded from the calculation. All composite assay intervals are reported as down-hole widths and are not considered true
thickness.
Results reported for September Northeast (NE) are from 81 diamond drill core holes completed during 2014 and 38 surface trenches (stripped
pavement).
Composite assay intervals reported for September NE diamond drill core results are calculated by taking a weighted average of all gold fire assay
values equal to or above 2.0 gram per tonne gold. No more than three consecutive metres of internal waste (<2.0 grams per tonne) is accepted,
high grade samples are not cut. True widths are estimated to be on average greater than 80% of the drilled intercept.
Results for the exploration drill campaign are reported as Au grams per tonne (Au g/t), Ag grams per tonne (Ag g/t) and as Au Equivalent grams
per tonne (Au Eq g/t). Au Eq is calculated using Ag g/t / 63.64 and added to the Au g/t assay result.
Abbreviations used are:
NSI - No Significant Intersection;
BDL - Below Detection Limit;
TNS - Trench Not sampled
The reader is referred to the Kupol NI 43-101 Technical Report dated May 9, 2011, available under the Company’s profile at www.sedar.com, for a
full description of drilling methods, sampling procedures and QA/QC protocols. Samples from Providence and September NE are prepared and
analyzed by fire assay using a 50 gram charge with a gravimetric finish at the Kupol mine site analytical laboratory in compliance with industry
standards. Field duplicate samples are taken and blanks and standards are added to every batch submitted.
The technical information about the Company’s drilling and exploration activities at Kupol and Dvoinoye contained in this news release has been
prepared under the supervision of and verified by Mr. Sylvain Guerard, an officer with the Company who is a “qualified person” within the meaning
of National Instrument 43-101. The drill hole data base including collar, survey, geology and assay information were reviewed by the “qualified
person” and the composite assay information independently calculated and verified for accuracy of reporting. Assay certificates for the information
disclosed in this news release were verified by the Regional Director Exploration, Russia, but not by Mr. Guerard as the “qualified person”.
www.kinross.com
48
EXPLANATORY NOTES: EXPLORATION
Tasiast Exploration Results
Drill hole identifiers ending with suffix DD are diamond drill core holes (HQ diameter) and those ending with suffix RC are reverse circulation
(RC) holes. Holes with “A” prefixing DD or RC are diamond core or reverse circulation re-drills of the original hole where significant deviation
would have resulted in that hole missing the intended target.
Results provided for Tasiast include all exploration drill holes for which assay results were available from Tamaya at the time of preparation of
this news release. Composite assay intervals reported for exploration drilling at Tasiast are calculated by taking a weighted average of all gold
fire assay values equal to or above 0.3 g/t gold. No more than three consecutive metres of internal waste (<0.3 g/t gold) are accepted and high
grade samples are cut to 20 grams per tonne gold. All assay intervals are reported as down-hole widths. True widths are estimated to be on
average greater than 90% of the drilled intercept.
Composite intervals for reconnaissance reverse circulation holes are calculated by applying a 0.3 gram per tonne cut-off, no more than 6 metres
of internal waste and no top cut. All assay intervals are reported as down-hole thicknesses. There is insufficient information on all targets to
provide estimates of true thickness.
The reader is referred to the Tasiast NI 43-101 Technical Report dated March 31, 2014, available under the Company’s profile at
www.sedar.com, for a full description of drilling methods, sampling procedures and QA/QC protocols. Samples from Tasiast are prepared and
analyzed by fire assay using a 50 gram charge with an AAS finish at ALS (Tasiast mine site, Johannesburg, South Africa and Vancouver,
Canada) in compliance with industry standards. Field duplicate samples are taken and blanks and standards are added to every batch
submitted. Selected samples from this lab are check assayed each month at other ALS and third party commercial laboratories worldwide.
The technical information about the Company’s drilling and exploration activities at Tasiast contained in this news release has been prepared
under the supervision of and verified by Mr. Sylvain Guerard, an officer with the Company who is a “qualified person” within the meaning of
National Instrument 43-101. The drill hole data base including collar, survey, geology and assay information were reviewed by the “qualified
person” and the composite assay information independently calculated and verified for accuracy of reporting. Assay certificates for the
information disclosed in this news release were verified by the Regional Director Exploration, Africa, but not by Mr. Guerard as the “qualified
person”.
www.kinross.com
49
ENDNOTES
1) For more information regarding Kinross’ production, cost and capital expenditures outlook for 2015, please refer to the
news releases dated February 10, 2015 and September 17, 2015, available on our website at www.kinross.com.
Kinross’ outlook for 2015 represents forward-looking information and users are cautioned that actual results may vary.
Please refer to the risks and assumptions contained in the Cautionary Statement on Forward-Looking Information on
slide 2 of this presentation.
2) Unless otherwise noted, gold equivalent production, gold equivalent ounces sold and production cost of sales figures
in this presentation are based on Kinross’ 90% share of Chirano production and sales.
3) Attributable production cost of sales per gold equivalent ounce sold and per gold ounce on a by-product basis are non-
GAAP measures. For more information and a reconciliation of this non-GAAP measure for the three months and nine
months ended September 30, 2015 and 2014, please refer to the news release dated November 10, 2015, under the
heading “Reconciliation of non-GAAP financial measures”, available on our website at www.kinross.com.
4) All-in sustaining cost is a non-GAAP measure. For more information and a reconciliation of this non-GAAP measure
for the three months and nine months ended September 30, 2015 and 2014, please refer to the news release dated
November 10, 2015 under the heading “Reconciliation of non-GAAP financial measures”, available on our website at
www.kinross.com.
5) For more information regarding Kinross’ mineral reserves and mineral resources, please refer to our Annual Mineral
Reserve and Mineral Resource Statement as at December 31, 2014 contained in our news release dated February 10,
2015, which is available on our website at www.kinross.com.
www.kinross.com
50
KINROSS GOLD CORPORATION
25 York Street, 17th Floor │Toronto, ON │ M5J 2V5
www.kinross.com

More Related Content

What's hot

Q4-2015 Results
Q4-2015 ResultsQ4-2015 Results
Q4-2015 Results
Agnico Eagle Mines
 
Dgc 16 01_26 - td conference
Dgc 16 01_26 - td conferenceDgc 16 01_26 - td conference
Dgc 16 01_26 - td conference
DetourGold
 
BMO Capital Markets Global Metals & Mining Conference
BMO Capital Markets Global Metals & Mining Conference BMO Capital Markets Global Metals & Mining Conference
BMO Capital Markets Global Metals & Mining Conference
yamanagold2016
 
Guy april-2017-ir-presentation
Guy april-2017-ir-presentationGuy april-2017-ir-presentation
Guy april-2017-ir-presentation
guygold2016
 
Q3-2015 Results
Q3-2015 ResultsQ3-2015 Results
Q3-2015 Results
Agnico Eagle Mines
 
Alamos Corp Presentation_May 11 2017_FINAL
Alamos Corp Presentation_May 11 2017_FINALAlamos Corp Presentation_May 11 2017_FINAL
Alamos Corp Presentation_May 11 2017_FINAL
alamosgoldinc
 
Alamos corp presentation june 22 2017 final
Alamos corp presentation june 22 2017 finalAlamos corp presentation june 22 2017 final
Alamos corp presentation june 22 2017 final
alamosgoldinc
 
European Gold Forum - April 2016
European Gold Forum - April 2016European Gold Forum - April 2016
European Gold Forum - April 2016
yamanagold2016
 
Corporate presentation april 2016
Corporate presentation   april 2016Corporate presentation   april 2016
Corporate presentation april 2016
newgold2011
 
Alamos corporate presentation sept 19 2016 final
Alamos corporate presentation sept 19 2016 finalAlamos corporate presentation sept 19 2016 final
Alamos corporate presentation sept 19 2016 final
alamosgoldinc
 
Raymond James Institutional Investors Conference Orlando
Raymond James Institutional Investors Conference OrlandoRaymond James Institutional Investors Conference Orlando
Raymond James Institutional Investors Conference Orlando
Agnico Eagle Mines
 
Investor day presentation
Investor day presentation Investor day presentation
Investor day presentation
newgold2011
 
033016 tasiast expansion studies
033016 tasiast expansion studies033016 tasiast expansion studies
033016 tasiast expansion studies
Laura Hildred
 
Alamos corporate presentation dec 2 2016 final
Alamos corporate presentation dec 2 2016 finalAlamos corporate presentation dec 2 2016 final
Alamos corporate presentation dec 2 2016 final
alamosgoldinc
 
Q1 2017 Conference call Presentation
Q1 2017 Conference call PresentationQ1 2017 Conference call Presentation
Q1 2017 Conference call Presentation
yamanagold2016
 
Presentation dgc 17-01_31 _ q4 ops 2017 guidance webcast
Presentation   dgc 17-01_31 _ q4 ops 2017 guidance webcastPresentation   dgc 17-01_31 _ q4 ops 2017 guidance webcast
Presentation dgc 17-01_31 _ q4 ops 2017 guidance webcast
DetourGold
 
Mine Tour Chile Minera Florida Site Visit
Mine Tour  Chile  Minera Florida Site VisitMine Tour  Chile  Minera Florida Site Visit
Mine Tour Chile Minera Florida Site Visit
yamanagold2016
 
BMO Capital Markets Global Metals & Mining Conference
BMO Capital Markets Global Metals & Mining ConferenceBMO Capital Markets Global Metals & Mining Conference
BMO Capital Markets Global Metals & Mining Conference
yamanagold2016
 
Alamos Corporate Presentation - March 2016
Alamos Corporate Presentation - March 2016Alamos Corporate Presentation - March 2016
Alamos Corporate Presentation - March 2016
alamosgoldinc
 
Made in Canada
Made in CanadaMade in Canada
Made in Canada
yamanagold2016
 

What's hot (20)

Q4-2015 Results
Q4-2015 ResultsQ4-2015 Results
Q4-2015 Results
 
Dgc 16 01_26 - td conference
Dgc 16 01_26 - td conferenceDgc 16 01_26 - td conference
Dgc 16 01_26 - td conference
 
BMO Capital Markets Global Metals & Mining Conference
BMO Capital Markets Global Metals & Mining Conference BMO Capital Markets Global Metals & Mining Conference
BMO Capital Markets Global Metals & Mining Conference
 
Guy april-2017-ir-presentation
Guy april-2017-ir-presentationGuy april-2017-ir-presentation
Guy april-2017-ir-presentation
 
Q3-2015 Results
Q3-2015 ResultsQ3-2015 Results
Q3-2015 Results
 
Alamos Corp Presentation_May 11 2017_FINAL
Alamos Corp Presentation_May 11 2017_FINALAlamos Corp Presentation_May 11 2017_FINAL
Alamos Corp Presentation_May 11 2017_FINAL
 
Alamos corp presentation june 22 2017 final
Alamos corp presentation june 22 2017 finalAlamos corp presentation june 22 2017 final
Alamos corp presentation june 22 2017 final
 
European Gold Forum - April 2016
European Gold Forum - April 2016European Gold Forum - April 2016
European Gold Forum - April 2016
 
Corporate presentation april 2016
Corporate presentation   april 2016Corporate presentation   april 2016
Corporate presentation april 2016
 
Alamos corporate presentation sept 19 2016 final
Alamos corporate presentation sept 19 2016 finalAlamos corporate presentation sept 19 2016 final
Alamos corporate presentation sept 19 2016 final
 
Raymond James Institutional Investors Conference Orlando
Raymond James Institutional Investors Conference OrlandoRaymond James Institutional Investors Conference Orlando
Raymond James Institutional Investors Conference Orlando
 
Investor day presentation
Investor day presentation Investor day presentation
Investor day presentation
 
033016 tasiast expansion studies
033016 tasiast expansion studies033016 tasiast expansion studies
033016 tasiast expansion studies
 
Alamos corporate presentation dec 2 2016 final
Alamos corporate presentation dec 2 2016 finalAlamos corporate presentation dec 2 2016 final
Alamos corporate presentation dec 2 2016 final
 
Q1 2017 Conference call Presentation
Q1 2017 Conference call PresentationQ1 2017 Conference call Presentation
Q1 2017 Conference call Presentation
 
Presentation dgc 17-01_31 _ q4 ops 2017 guidance webcast
Presentation   dgc 17-01_31 _ q4 ops 2017 guidance webcastPresentation   dgc 17-01_31 _ q4 ops 2017 guidance webcast
Presentation dgc 17-01_31 _ q4 ops 2017 guidance webcast
 
Mine Tour Chile Minera Florida Site Visit
Mine Tour  Chile  Minera Florida Site VisitMine Tour  Chile  Minera Florida Site Visit
Mine Tour Chile Minera Florida Site Visit
 
BMO Capital Markets Global Metals & Mining Conference
BMO Capital Markets Global Metals & Mining ConferenceBMO Capital Markets Global Metals & Mining Conference
BMO Capital Markets Global Metals & Mining Conference
 
Alamos Corporate Presentation - March 2016
Alamos Corporate Presentation - March 2016Alamos Corporate Presentation - March 2016
Alamos Corporate Presentation - March 2016
 
Made in Canada
Made in CanadaMade in Canada
Made in Canada
 

Similar to 2016 TD Conference Toronto

022916 bmo conference
022916 bmo conference022916 bmo conference
022916 bmo conference
Laura Hildred
 
BMO Capital Markets 25th Global Metals & Mining Conference Presentation
BMO Capital Markets 25th Global Metals & Mining Conference PresentationBMO Capital Markets 25th Global Metals & Mining Conference Presentation
BMO Capital Markets 25th Global Metals & Mining Conference Presentation
KinrossGold
 
091916 denver gold forum pitchbook
091916 denver gold forum   pitchbook091916 denver gold forum   pitchbook
091916 denver gold forum pitchbook
KinrossGold
 
Q1 2016 Results Conference Call & Webcast
Q1 2016 Results Conference Call & WebcastQ1 2016 Results Conference Call & Webcast
Q1 2016 Results Conference Call & Webcast
KinrossGold
 
Q2 2016 Results Conference Call & Webcast
Q2 2016 Results Conference Call & WebcastQ2 2016 Results Conference Call & Webcast
Q2 2016 Results Conference Call & Webcast
KinrossGold
 
Kinross minex 2016
Kinross minex 2016Kinross minex 2016
Kinross minex 2016
Chibezova
 
080217 q2 webcast
080217 q2 webcast080217 q2 webcast
080217 q2 webcast
KinrossGold
 
110316 q3 webcast website
110316 q3 webcast website110316 q3 webcast website
110316 q3 webcast website
KinrossGold
 
ACQUISITION OF TWO QUALITY MINES IN NEVADA
ACQUISITION OF TWO QUALITY MINES IN NEVADAACQUISITION OF TWO QUALITY MINES IN NEVADA
ACQUISITION OF TWO QUALITY MINES IN NEVADAKinrossGold
 
022617 bmo conference
022617 bmo conference022617 bmo conference
022617 bmo conference
KinrossGold
 
050317 q1 2017 webcast
050317 q1 2017 webcast050317 q1 2017 webcast
050317 q1 2017 webcast
KinrossGold
 
021617 q4 fy 2017 webcast
021617 q4 fy 2017 webcast021617 q4 fy 2017 webcast
021617 q4 fy 2017 webcast
KinrossGold
 
021617 q4 fy 2017 webcast
021617 q4 fy 2017 webcast021617 q4 fy 2017 webcast
021617 q4 fy 2017 webcast
KinrossGold
 
Results of the Tasiast Phase Two and Round Mountain Phase W Feasibility Studi...
Results of the Tasiast Phase Two and Round Mountain Phase W Feasibility Studi...Results of the Tasiast Phase Two and Round Mountain Phase W Feasibility Studi...
Results of the Tasiast Phase Two and Round Mountain Phase W Feasibility Studi...
KinrossGold
 
033016 tasiast expansion studies website
033016 tasiast expansion studies   website033016 tasiast expansion studies   website
033016 tasiast expansion studies website
KinrossGold
 
100317 tasiast mine tour presentation final
100317 tasiast mine tour presentation final100317 tasiast mine tour presentation final
100317 tasiast mine tour presentation final
KinrossGold
 
110917 q3 webcast website
110917 q3 webcast website110917 q3 webcast website
110917 q3 webcast website
KinrossGold
 
062916 nevada-mine-tour-presentation-final-printed
062916 nevada-mine-tour-presentation-final-printed062916 nevada-mine-tour-presentation-final-printed
062916 nevada-mine-tour-presentation-final-printed
KinrossGold
 
062916 nevada mine tour presentation final printed
062916 nevada mine tour presentation   final printed062916 nevada mine tour presentation   final printed
062916 nevada mine tour presentation final printed
KinrossGold
 

Similar to 2016 TD Conference Toronto (20)

022916 bmo conference
022916 bmo conference022916 bmo conference
022916 bmo conference
 
BMO Capital Markets 25th Global Metals & Mining Conference Presentation
BMO Capital Markets 25th Global Metals & Mining Conference PresentationBMO Capital Markets 25th Global Metals & Mining Conference Presentation
BMO Capital Markets 25th Global Metals & Mining Conference Presentation
 
091916 denver gold forum pitchbook
091916 denver gold forum   pitchbook091916 denver gold forum   pitchbook
091916 denver gold forum pitchbook
 
Q1 2016 Results Conference Call & Webcast
Q1 2016 Results Conference Call & WebcastQ1 2016 Results Conference Call & Webcast
Q1 2016 Results Conference Call & Webcast
 
Q2 2016 Results Conference Call & Webcast
Q2 2016 Results Conference Call & WebcastQ2 2016 Results Conference Call & Webcast
Q2 2016 Results Conference Call & Webcast
 
Kinross minex 2016
Kinross minex 2016Kinross minex 2016
Kinross minex 2016
 
080217 q2 webcast
080217 q2 webcast080217 q2 webcast
080217 q2 webcast
 
110316 q3 webcast website
110316 q3 webcast website110316 q3 webcast website
110316 q3 webcast website
 
ACQUISITION OF TWO QUALITY MINES IN NEVADA
ACQUISITION OF TWO QUALITY MINES IN NEVADAACQUISITION OF TWO QUALITY MINES IN NEVADA
ACQUISITION OF TWO QUALITY MINES IN NEVADA
 
022617 bmo conference
022617 bmo conference022617 bmo conference
022617 bmo conference
 
050317 q1 2017 webcast
050317 q1 2017 webcast050317 q1 2017 webcast
050317 q1 2017 webcast
 
021617 q4 fy 2017 webcast
021617 q4 fy 2017 webcast021617 q4 fy 2017 webcast
021617 q4 fy 2017 webcast
 
021617 q4 fy 2017 webcast
021617 q4 fy 2017 webcast021617 q4 fy 2017 webcast
021617 q4 fy 2017 webcast
 
Results of the Tasiast Phase Two and Round Mountain Phase W Feasibility Studi...
Results of the Tasiast Phase Two and Round Mountain Phase W Feasibility Studi...Results of the Tasiast Phase Two and Round Mountain Phase W Feasibility Studi...
Results of the Tasiast Phase Two and Round Mountain Phase W Feasibility Studi...
 
Results of the Tasiast Phase Two and Round Mountain Phase W Feasibility Studi...
Results of the Tasiast Phase Two and Round Mountain Phase W Feasibility Studi...Results of the Tasiast Phase Two and Round Mountain Phase W Feasibility Studi...
Results of the Tasiast Phase Two and Round Mountain Phase W Feasibility Studi...
 
033016 tasiast expansion studies website
033016 tasiast expansion studies   website033016 tasiast expansion studies   website
033016 tasiast expansion studies website
 
100317 tasiast mine tour presentation final
100317 tasiast mine tour presentation final100317 tasiast mine tour presentation final
100317 tasiast mine tour presentation final
 
110917 q3 webcast website
110917 q3 webcast website110917 q3 webcast website
110917 q3 webcast website
 
062916 nevada-mine-tour-presentation-final-printed
062916 nevada-mine-tour-presentation-final-printed062916 nevada-mine-tour-presentation-final-printed
062916 nevada-mine-tour-presentation-final-printed
 
062916 nevada mine tour presentation final printed
062916 nevada mine tour presentation   final printed062916 nevada mine tour presentation   final printed
062916 nevada mine tour presentation final printed
 

Recently uploaded

Corporate Presentation Probe June 2024.pdf
Corporate Presentation Probe June 2024.pdfCorporate Presentation Probe June 2024.pdf
Corporate Presentation Probe June 2024.pdf
Probe Gold
 
一比一原版(UW毕业证)华盛顿大学毕业证成绩单专业办理
一比一原版(UW毕业证)华盛顿大学毕业证成绩单专业办理一比一原版(UW毕业证)华盛顿大学毕业证成绩单专业办理
一比一原版(UW毕业证)华盛顿大学毕业证成绩单专业办理
ybout
 
Osisko Gold Royalties Ltd - Corporate Presentation, June 2024
Osisko Gold Royalties Ltd - Corporate Presentation, June 2024Osisko Gold Royalties Ltd - Corporate Presentation, June 2024
Osisko Gold Royalties Ltd - Corporate Presentation, June 2024
Osisko Gold Royalties Ltd
 
Osisko Development - Investor Presentation - June 24
Osisko Development - Investor Presentation - June 24Osisko Development - Investor Presentation - June 24
Osisko Development - Investor Presentation - June 24
Philip Rabenok
 
2024-deutsche-bank-global-consumer-conference.pdf
2024-deutsche-bank-global-consumer-conference.pdf2024-deutsche-bank-global-consumer-conference.pdf
2024-deutsche-bank-global-consumer-conference.pdf
Sysco_Investors
 
cyberagent_For New Investors_EN_240424.pdf
cyberagent_For New Investors_EN_240424.pdfcyberagent_For New Investors_EN_240424.pdf
cyberagent_For New Investors_EN_240424.pdf
CyberAgent, Inc.
 
Snam 2023-27 Industrial Plan - Financial Presentation
Snam 2023-27 Industrial Plan - Financial PresentationSnam 2023-27 Industrial Plan - Financial Presentation
Snam 2023-27 Industrial Plan - Financial Presentation
Valentina Ottini
 

Recently uploaded (7)

Corporate Presentation Probe June 2024.pdf
Corporate Presentation Probe June 2024.pdfCorporate Presentation Probe June 2024.pdf
Corporate Presentation Probe June 2024.pdf
 
一比一原版(UW毕业证)华盛顿大学毕业证成绩单专业办理
一比一原版(UW毕业证)华盛顿大学毕业证成绩单专业办理一比一原版(UW毕业证)华盛顿大学毕业证成绩单专业办理
一比一原版(UW毕业证)华盛顿大学毕业证成绩单专业办理
 
Osisko Gold Royalties Ltd - Corporate Presentation, June 2024
Osisko Gold Royalties Ltd - Corporate Presentation, June 2024Osisko Gold Royalties Ltd - Corporate Presentation, June 2024
Osisko Gold Royalties Ltd - Corporate Presentation, June 2024
 
Osisko Development - Investor Presentation - June 24
Osisko Development - Investor Presentation - June 24Osisko Development - Investor Presentation - June 24
Osisko Development - Investor Presentation - June 24
 
2024-deutsche-bank-global-consumer-conference.pdf
2024-deutsche-bank-global-consumer-conference.pdf2024-deutsche-bank-global-consumer-conference.pdf
2024-deutsche-bank-global-consumer-conference.pdf
 
cyberagent_For New Investors_EN_240424.pdf
cyberagent_For New Investors_EN_240424.pdfcyberagent_For New Investors_EN_240424.pdf
cyberagent_For New Investors_EN_240424.pdf
 
Snam 2023-27 Industrial Plan - Financial Presentation
Snam 2023-27 Industrial Plan - Financial PresentationSnam 2023-27 Industrial Plan - Financial Presentation
Snam 2023-27 Industrial Plan - Financial Presentation
 

2016 TD Conference Toronto

  • 1. www.kinross.com 1 KINROSS GOLD CORPORATION TD SECURITIES 2016 MINING CONFERENCE January 2016
  • 2. www.kinross.com 2 CAUTIONARY STATEMENT ON FORWARD-LOOKING INFORMATION All statements, other than statements of historical fact, contained or incorporated by reference in or made in giving this presentation and responses to questions, including but not limited to any information as to the future performance of Kinross, constitute “forward looking statements” within the meaning of applicable securities laws, including the provisions of the Securities Act (Ontario) and the provisions for “safe harbour” under the United States Private Securities Litigation Reform Act of 1995 and are based on expectations, estimates and projections as of the date of this presentation. Forward-looking statements contained in this presentation include those statements on slides with, and statements made under, the headings “The Way Forward - Principles for Building Value”, “2015 Outlook - Guidance Update”, “New Processing Initiative at Paracatu”, “Organic Growth Opportunities”, “Pre-feasibility Study Results”, Life of Mine Estimates”, “Russia - Near-Site Exploration Targets”, “Chirano Mine Life Extension”, “Tasiast Expansion Project”, “Strong Balance Sheet”, “Levers for Reducing Costs”, “Compelling Valuation”, “Kinross Value Proposition” and “2014 Gold Reserve and Resource Estimates”, and include without limitation statements with respect to our guidance for production, production costs of sales, all-in sustaining cost and capital expenditures, continuous improvement and other cost savings opportunities, as well as references to other possible events include, without limitation, possible events; opportunities; statements with respect to possible events or opportunities; estimates and the realization of such estimates; future development, mining activities, production and growth, including but not limited to cost and timing; success of exploration or development of operations; the future price of gold and silver; currency fluctuations; expected capital requirements; government regulation; and environmental risks. The words “2015E”, “alternatives”, “compelling”, “concept”, “encouraging”, “estimate”, “expect”, “explore”, “feasibility”, “flexibility”, “forecast”, “focus”, “FS”, “future”, “guidance”, “initiative”, “indicate”, “intend”, “objective”, “on track”, “opportunity”, “optimize”, “option”, “outlook”, “plan”, “PFS”, “positioned”, “possible”, “potential”, “pre-feasibility”, “principles”, “priority”, “project”, “prospective”, “pursue”, “risk”, “strategy”, “study”, “target” or “way forward”, or variations of such words and phrases or statements that certain actions, events or results may, can, could, would, should, might, indicates, achieved or will be taken, and similar expressions identify forward looking statements. Forward-looking statements are necessarily based upon a number of estimates and assumptions that, while considered reasonable by Kinross as of the date of such statements, are inherently subject to significant business, economic and competitive uncertainties and contingencies. Statements representing management’s financial and other outlook have been prepared solely for purposes of expressing their current views regarding the Company’s financial and other outlook and may not be appropriate for any other purpose. Many of these uncertainties and contingencies can affect, and could cause, Kinross’ actual results to differ materially from those expressed or implied in any forward looking statements made by, or on behalf of, Kinross. There can be no assurance that forward looking statements will prove to be accurate, as actual results and future events could differ materially from those anticipated in such statements. All of the forward looking statements made in this presentation are qualified by these cautionary statements, and those made in our filings with the securities regulators of Canada and the U.S., including but not limited to those cautionary statements made in the “Risk Factors” section of our most recently filed Annual Information Form, the “Risk Analysis” section of our FYE 2014 and Q3 2015 Management’s Discussion and Analysis, and the “Cautionary Statement on Forward-Looking Information” in our news releases dated November 10 and November 12, 2015, to which readers are referred and which are incorporated by reference in this presentation, all of which qualify any and all forward‐looking statements made in this presentation. These factors are not intended to represent a complete list of the factors that could affect Kinross. Kinross disclaims any intention or obligation to update or revise any forward‐looking statements or to explain any material difference between subsequent actual events and such forward‐looking statements, except to the extent required by applicable law. Other information Where we say "we", "us", "our", the "Company", or "Kinross" in this presentation, we mean Kinross Gold Corporation and/or one or more or all of its subsidiaries, as may be applicable. The technical information about the Company’s mineral properties (other than exploration activities) contained in this presentation has been prepared under the supervision of Mr. John Sims, an officer of the Company who is a “qualified person” within the meaning of National Instrument 43-101 (“NI 43-101”). The technical information about the Company’s exploration activities contained in this presentation has been prepared under the supervision of Mr. Sylvain Guerard, an officer of the Company who is a “qualified person” within the meaning of NI 43-101.
  • 3. www.kinross.com 3 • Focus on operational excellence • Quality over quantity • Disciplined capital allocation • Maintaining a strong balance sheet 3 THE WAY FORWARD PRINCIPLES FOR BUILDING VALUE
  • 5. www.kinross.com 5 Q3 2015 YTD Q3 2015 2015 GUIDANCE(1) Gold equivalent production (oz.)(2) 680,679 1,970,937 2.5 to 2.6 Moz. Production cost of sales ($/oz.)(3) $668 $699 $690 to $730 All-in sustaining cost ($/oz.)(4) $941 $970 $975 to $1,025 Capital Expenditures ($M) $171 $449 $650 THIRD QUARTER HIGHLIGHTS DELIVERING STRONG PERFORMANCE • Strong performance from operations delivered solid Q3 2015 results • On track to meet 2015 REVISED guidance for production, cost of sales and all-in sustaining cost • Expect to come in BELOW 2015 guidance for capital expenditures and overhead costs Continuing track record of meeting or beating our operational targets (1) Refer to endnote #1. (2) Refer to endnote #2. (3) Refer to endnote #3. (4) Refer to endnote #4.
  • 6. www.kinross.com 6 2015E GOLD EQUIVALENT PRODUCTION(1,2) OPERATIONAL EXCELLENCE DIVERSIFIED PORTFOLIO OF OPERATING MINES GLOBAL PORTFOLIO Operating mine Development project Round Mountain Kettle River-Buckhorn Fort Knox La Coipa Paracatu Maricunga Kupol Dvoinoye Chirano Tasiast AMERICASRUSSIA WEST AFRICA (3) Refer to endnote #3. Over 50% of estimated 2015 gold equivalent production from mines located in the Americas 54% 17% 29% Americas West Africa Russia 2.5-2.6M ounces (1) Refer to endnote #1. (2) Refer to endnote #2.
  • 7. www.kinross.com 7 • Five mines located in the US, Brazil and Chile • Over 50% of annual production is from the Americas region AMERICAS 7
  • 8. www.kinross.com 8 OPERATIONAL EXCELLENCE AMERICAS • ROUND MOUNTAIN benefiting from continuous improvement initiatives aimed at improving heap leach operations • FORT KNOX production cost of sales benefiting from lower power costs and higher production OPERATION GOLD EQUIVALENT PRODUCTION PRODUCTION COST OF SALES ($/oz.)(3) Q3 2015 YTD Q3 2015 Q3 2015 YTD Q3 2015 Fort Knox 115,258 313,992 $556 $604 Round Mountain (50%) 58,074 146,784 $687 $769 Kettle River - Buckhorn 24,222 78,067 $795 $859 Paracatu 129,064 364,115 $747 $777 Maricunga 52,672 157,207 $1,004 $1,037 AMERICAS TOTAL 379,290 1,060,165 $718 $769 (3) Refer to endnote #3. • PARACATU production increased due to higher mill grades and increased recovery, which improved cost of sales  Temporarily suspended Plant 1 and reduced operations at Plant 2 due to lack of rainfall  Not expected to impact 2015 regional or company-wide guidance
  • 9. www.kinross.com 9 AMERICAS NEW PROCESSING INITIATIVE AT PARACATU Modest capital investment to add low-cost, incremental production • Low-cost, incremental production resulting from:  Enriched grades near discharge areas of the facility  Utilization of excess capacity in Plant 1 due to ore blending strategy  Lower energy consumption as no grinding required • Modest capital investment of $20 million
  • 10. www.kinross.com 10 ORGANIC GROWTH OPPORTUNITIES LA COIPA PROJECT • Pre-feasibility study on La Coipa completed during Q3 2015 • Project offers a number of expected attractive attributes:  Leverages existing infrastructure  Relatively low execution risk  Modest capital investment  Exploration upside  Located in an attractive jurisdiction 10
  • 11. www.kinross.com 11 PRE-FEASIBILTY STUDY RESULTS LA COIPA PROJECT Life of Mine Estimates (100% basis)(i) Life of Mine 5.5 years Total ounces recovered 1.03 million gold equivalent ounces Average annual production 207,000 gold equivalent ounces per year Average cost of sales $674 per gold equivalent ounce Average all-in cost(ii) $767 per gold equivalent ounce Initial capital $94 million Pre-Stripping $105 million IRR (after-tax) 20% NPV $120 million • PFS based on using existing infrastructure to blend and process higher grade material from the recently delineated Phase 7 deposit with oxide/transition material from the existing Puren deposit Project expected to generate a 20% IRR at an assumed gold price of $1,200 per ounce (i) Summary results are shown on a 100% basis, however, Kinross has a 75% interest in Phase 7 and a 65% interest in Puren. (ii) All-in cost includes operating costs, sustaining capital, and post start-up capitalized stripping and does not include estimated initial capital expenditures of $94 million and estimated pre-stripping of $105 million, and any exploration, income taxes and non-cash items related to reclamation or allocation of regional or corporate overhead costs. This differs from the World Gold Council definition of all-in cost.
  • 12. www.kinross.com 12 PRE-FEASIBILTY STUDY RESULTS LA COIPA PROJECT PERMITTING • Submitted a DIA earlier this year • Preparing a response to the relevant agencies’ review and request for additional information EXPLORATION • Exploration continues at several district targets, including Catalina (located 1 km SE of Phase 7) • Further exploration work planned to assess opportunities to extend the estimated mine life beyond what is contemplated in the PFS OPTIMIZATION STUDIES • Intend to complete blending and optimization studies Based on positive results, Kinross intends to complete further optimization studies and continue to assess additional exploration opportunities at La Coipa
  • 13. www.kinross.com 13 • Continued strong performance from the high-grade, low-cost Kupol and Dvoinoye underground minesRUSSIA 13
  • 14. www.kinross.com 14 OPERATIONAL EXCELLENCE RUSSIA • Continued strong performance from the combined KUPOL-DVOINOYE operation • Q3 production cost of sales decreased year-over- year to $469 per Au eq. oz. • Lowest level since Dvoinoye operations commenced in 2013 • Benefiting from higher mill grades resulting from processing an increased portion of higher grade Dvoinoye material and favourable foreign exchange rates (3) Refer to endnote #3. OPERATION GOLD EQUIVALENT PRODUCTION PRODUCTION COST OF SALES ($/oz.)(3) Q3 2015 YTD Q3 2015 Q3 2015 YTD Q3 2015 Kupol - Dvoinoye 190,366 567,255 $469 $477 RUSSIA TOTAL 190,366 567,255 $469 $477
  • 15. www.kinross.com 15 RUSSIA NEAR-SITE EXPLORATION TARGETS MOROSHKA • Located approximately 4 km East of Kupol • Drilling defined ~198koz. gold and ~2.3Moz. silver of estimated Indicated Mineral Resources(5) SEPTEMBER NORTH-EAST • Located approximately 15 km NW of Dvoinoye • Drilling defined high-grade gold mineralization over a strike length of 150 m • Work planned in 2015 to define an initial mineral resource estimate For additional information, please see Kinross’ news release dated February 10, 2015 and Appendices A and B, which are available on our website at www.kinross.com , as well as the Explanatory Notes available on slide 47 of this presentation. (5) Refer to endnote #5.
  • 16. www.kinross.com 16 RUSSIA FOREIGN INVESTMENT The world’s leading companies are continuing to invest in Russia in 2015
  • 17. www.kinross.com 17 RUSSIA FOREIGN INVESTMENT ADVISORY COUNCIL FIAC is chaired by the Russian Prime Minister and includes CEOs from over 50 international companies
  • 18. www.kinross.com 18 • Record annual production for Tasiast and Chirano in 2014 • Strong focus on optimizing efficiency and performance WEST AFRICA 18
  • 19. www.kinross.com 19 OPERATIONAL EXCELLENCE WEST AFRICA • TASIAST production decreased compared with Q2 2015 due mainly to the wind-down of dump leach production • CHIRANO production decreased as a result of expected lower grades due to declining contribution from the Akwaaba underground deposit • Development of the Akoti decline continued, with ~250 metres completed at quarter-end • Production from Akoti is expected to begin in the second half of 2016 (2) Refer to endnote #2. (3) Refer to endnote #3. OPERATION GOLD EQUIVALENT PRODUCTION PRODUCTION COST OF SALES ($/oz.)(3) Q3 2015 YTD Q3 2015 Q3 2015 YTD Q3 2015 Tasiast 53,440 165,339 $1,057 $1,042 Chirano (90%)(2) 57,583 178,178 $701 $675 WEST AFRICA TOTAL 111,023 343,517 $880 $848
  • 20. www.kinross.com 20 • Extension of estimated mine life to 2020 with additional mineral resource estimates at two deposits:  Paboase (currently in production)  Akoti underground (production expected to begin mid-2016) • Provides additional time to pursue exploration potential in a highly-prospective region WEST AFRICA CHIRANO MINE LIFE EXTENSION 1 km MAMNAOSARIEHUAKWAABA SURAW PABOASE TANOAKOTI Mine life extension at one of Kinross’ lowest cost operations For additional information, please refer to our Annual Mineral Reserve and Mineral Resource Statement as at December 31, 2014 contained in our news release dated February 10, 2015, available on our website at www.kinross.com.
  • 21. www.kinross.com 21 ORGANIC GROWTH OPPORTUNITIES PHASED APPROACH TO A TASIAST MILL EXPANSION • Concept under study would add incremental capacity to increase mill throughput in two phases by leveraging existing infrastructure  PHASE ONE would increase throughput to 12,000 tpd with the addition of a gyratory crusher and oversized SAG mill  PHASE TWO could further increase total throughput to as much as 38,000 tpd with additional milling, leaching, thickening and refining capacity • Opportunity to realize Tasiast’s growth potential while substantially lowering overall capital costs compared with the previous estimate of $1.6B 21
  • 22. www.kinross.com 22 TASIAST EXPANSION PROJECT TWO-PHASED EXPANSION CONCEPT CONCEPUTAL FLOW SHEET PHASE ONE • Leverages existing mill infrastructure to increase throughput to 12,000 tpd from 8,000 tpd • Includes installation of an oversized SAG mill and gyratory crusher • Expected to enhance processing of the harder, higher grade West Branch ore and improve Tasiast’s production and operating costs Gyratory crusher Ore stockpile Oversized SAG mill Existing ball mills Leaching Refining
  • 23. www.kinross.com 23 Highlights of the early detailed engineering work completed to date on Phase One TASIAST EXPANSION PROJECT PHASE ONE ESTIMATES Metric Estimates Average annual production – first 2 years 368,000 gold ounces Cash cost per ounce – first 2 years $575 per gold equivalent ounce All-in sustaining cost per ounce – first 2 years(i) $725 per gold equivalent ounce Initial capital $290 million Construction period 2 years The initial capital expenditure estimate of $290 million includes: • Installation of an oversized SAG mill, gyratory crusher and 3 leach tanks • Maintenance improvements to other components of the processing circuit Category ($ millions) Direct cost (including freight) $180 Indirect and owner’s cost $80 Contingency $30 INITIAL CAPITAL ESTIMATE (i) All-in sustaining cost includes operating costs, royalties, sustaining capital, and does not include estimated initial capital expenditures of $290 million during the two-year construction period, pre-stripping of $483 million during two-year construction period and first two years of production, and any exploration, income taxes and non-cash items related to reclamation or allocation of regional or corporate overhead costs. This differs from the World Gold Council definition of all-in cost.
  • 24. www.kinross.com 24 TASIAST EXPANSION PROJECT TWO-PHASED EXPANSION CONCEPT CONCEPUTAL FLOW SHEET PHASE TWO • Could further increase total throughput to as much as 38,000 tpd with the addition of milling, leaching, thickening and refining capacity Gyratory crusher Ore stockpile Oversized SAG mill Additional ball milling capacity Additional leaching capacity Thickening
  • 25. www.kinross.com 25 A FINANCIALLY PRUDENT ALTERNATIVE TO REALIZING TASIAST’S GROWTH POTENTIAL • A feasibility study on the initial Phase One project to increase throughput to 12,000 tpd is expected to be completed in Q1 2016 • Upon completion of the FS, further details regarding project economics and Phase Two of a potential expansion would be released • Any potential go-forward decision will depend on a range of factors, including gold price environment, expected economic returns and various technical considerations TASIAST EXPANSION PROJECT A PHASED APPROACH TO A MILL EXPANSION A phased approach would optimize the current operation in the near-term while reducing overall capital cost of a larger expansion TASIAST OREBODY & RESOURCE PIT(i) (i) For additional information, please refer to the Tasiast Technical Report dated March 31, 2014 and to our Annual Mineral Reserve and Mineral Resource Statement as at December 31, 2014 contained in our news release dated February 10, 2015, both available on our website at www.kinross.com.
  • 27. www.kinross.com 27 STRONG BALANCE SHEET SOLID FINANCIAL POSITION(i) $1.0 $1.5 Cash, cash equivalents and restricted cash Undrawn credit facilities STRONG LIQUIDITY POSITION Maintaining balance sheet strength & financial flexibility remain priority objectives MAINTAINING FINANCIAL FLEXIBILITY • Improved balance sheet during the first 9 months of 2015:  Added $41M to cash position, ending the period with over $1.0B in cash and cash equivalents  Repaid over $80M of debt and reduced net debt position to under $950M • Only debt maturity prior to 2019 is $250M of senior notes due in 2016 • Pre-paid the remaining balance of the Kupol loan which was due in 2016 $2.5B AS AT SEP. 30, 2015 (i) Information on this slide is as at September 30, 2015 and does not take into account the Nevada asset purchase announced November 12, 2015. Kinross’ liquidity position proforma the transaction is estimated to be $1.9B.
  • 28. www.kinross.com 28 FINANCIAL DISCIPLINE FOCUS ON MANAGING COSTS REVIEW OF DISCRETIONARY SPENDING • Completed company-wide review of overhead spending and organizational structure • Reduced corporate labour costs by 23%, with expected annualized savings of $20M OPERATIONAL IMPROVEMENTS • Achieving cost savings through continuous improvement initiatives. Highlights include:  Transition to self-perform mining at CHIRANO  Ore-blending strategy at PARACATU  ROUND MOUNTAIN heap leach enhancements contributing to highest production in 6 years with lowest cost of sales since Q3 2012 ALL-IN SUSTAINING COST(4) ($ per gold equivalent ounce) (4) Refer to endnote #4. $1,122 $1,082 $973 $970 2012 2013 2014 YTD Q3 2015
  • 29. www.kinross.com 29 FINANCIAL DISCIPLINE LEVERS FOR REDUCING COSTS Proactively managing our business with a strict focus on the health of our balance sheet Market factors outside of our control Levers for reducing costs FX Oil Gold price Higher cost mines Discretionary spending Opex CASH FLOW
  • 31. www.kinross.com 31 0.0 1.0 2.0 3.0 4.0 5.0 6.0 Barrick Newmont Goldcorp Kinross Agnico Yamana Eldorado 2016E GOLD PRODUCTION(i) (Moz.) 21.8% 14.6% 9.2% 8.9% 7.5% 6.5% 5.1% Kinross Yamana Goldcorp Newmont Eldorado Barrick Agnico 2016E FREE CASH FLOW YIELD(ii) (i) Source: TD Securities research: “2016/17 Precious Metals Preview” – January 22, 2016. (ii) Source: Bloomberg; TD Securities research: “2016/17 Precious Metals Preview” – January 22, 2016 COMPELLING VALUATION PRODUCTION AND FREE CASH FLOW YIELD
  • 32. www.kinross.com 32 COMPELLING VALUATION NET DEBT TO EBITDA (LTM) Source: Bloomberg, company reports Information on this slide is as at September 30, 2015 and does not take into account the Nevada asset purchase announced November 12, 2015. Adjusting for the $610 million in cash paid to Barrick and the EBITDA for Bald Mountain (100%) and Round Mountain (additional 50%) for the last twelve months, Kinross’ proforma net debt to EBITDA ratio for the last twelve months would be 1.4x 2.9 2.6 1.9 1.3 1.2 1.1 0.6 Barrick Yamana Goldcorp Agnico Newmont Kinross Eldorado
  • 33. www.kinross.com 33 COMPELLING VALUATION ENTERPRISE VALUE VERSUS PRODUCTION 2016E Gold Production (Moz.)(ii) Delta with Kinross (US$B) Multiple of Kinross Enterprise Value Barrick 5.4 19.0 7.8 Newmont 5.1 12.4 5.4 Goldcorp 3.4 8.2 3.9 Kinross 2.8 - - Agnico 1.6 4.1 2.5 Yamana 1.3 0.4 1.1 Eldorado 0.7 (0.7) 0.8 (i) Source: Bloomberg – January 22, 2016; Company reports (ii) Source: TD Securities research: “2016/17 Precious Metals Preview” – January 22, 2016. $21.8 $15.2 $11.0 $6.9 $3.2 $2.8 $2.1 Barrick Newmont Goldcorp Agnico Yamana Kinross Eldorado Enterprisevalue(US$billions)(i)
  • 34. www.kinross.com 34 Bloomberg analyst consensus – January 22, 2016. COMPELLING VALUATION 2016E METRICS Attractive value opportunity relative to peers, considering Kinross’ annual production, cost structure, track record and growth opportunities EV / 2016E EBITDA P / 2016E OPERATING CF 9.7 7.8 7.1 6.8 6.8 5.3 3.1 Agnico Eldorado Barrick Goldcorp Newmont Yamana Kinross 9.1 6.9 5.5 4.8 4.7 2.7 2.1 Agnico Eldorado Goldcorp Newmont Barrick Yamana Kinross
  • 35. www.kinross.com 35 KINROSS VALUE PROPOSITION EXCELLENT OPERATIONAL TRACK RECORD • Continuing to meet or outperform our operational targets STRONG BALANCE SHEET • $2.5B in liquidity(i) and conservative net debt of ~$950M • Repaid the Kupol loan during Q3, ahead of schedule ATTRACTIVE FUTURE GROWTH OPPORTUNITIES • La Coipa pre-feasibility study generated positive results • Phased approach to Tasiast expansion offers a financially prudent alternative to realizing significant growth potential • Advancing organic production initiatives at Paracatu and Chirano COMPELLING VALUATION • Attractive value opportunity relative to peers, considering annual production, cost structure, track record and relatively low-risk growth opportunities SHARE INFORMATION K – Toronto Stock Exchange KGC – New York Stock Exchange (i) As at September 30, 2015. This figure does not take into account Kinross’ acquisition of Nevada assets announced November 12, 2015. Kinross’ liquidity position proforma the transaction is $1.9B.
  • 37. www.kinross.com 37 • Impressive track record of operational excellence AMERICAS FORT KNOX, USA (100%) TONNES (thousands) GRADE (g/t) OUNCES (thousands) 2P Reserves 163,844 0.46 2,398 M&I Resources 105,453 0.43 1,446 Inferred Resources 13,500 0.44 189 (3) Refer to endnote #3. (5) Refer to endnote #5. FY 2014 YTD Q3 2015 Production (Au. Eq. oz.) 379,453 313,992 Production cost of sales ($/oz.) $712 $604 OPERATING RESULTS(3) 2014 GOLD RESERVE AND RESOURCE ESTIMATES(5) Among the world’s few cold climate heap leach facilities
  • 38. www.kinross.com 38 • On November 12, 2015, Kinross announced an agreement to purchase the other 50% of Round Mountain from Barrick Gold Corporation AMERICAS ROUND MOUNTAIN, USA (50%)* TONNES (thousands) GRADE (g/t) OUNCES (thousands) 2P Reserves 27,300 0.79 689 M&I Resources 23,768 0.58 440 Inferred Resources 7,861 0.51 130 FY 2014 YTD Q3 2015 Production (Au. Eq. oz.) 169,839 146,784 Production cost of sales ($/oz.) $855 $769 Round Mountain is a best-practice leader in many areas, including preventative maintenance OPERATING RESULTS(3) 2014 GOLD RESERVE AND RESOURCE ESTIMATES(5) (3) Refer to endnote #3. (5) Refer to endnote #5.
  • 39. www.kinross.com 39 • Significant cash flow contributor with costs among the lowest in the portfolio • Small footprint operation AMERICAS KETTLE RIVER-BUCKHORN, USA (100%) TONNES (thousands) GRADE (g/t) OUNCES (thousands) 2P Reserves 351 9.0 101 M&I Resources 18 7.27 4 Inferred Resources 26 7.19 6 FY 2014 YTD Q3 2015 Production (Au. Eq. oz.) 123,382 78,067 Production cost of sales ($/oz.) $678 $859 Low-cost, high-grade underground mine located in Washington state OPERATING RESULTS(3) 2014 GOLD RESERVE AND RESOURCE ESTIMATES(5) (3) Refer to endnote #3. (5) Refer to endnote #5.
  • 40. www.kinross.com 40 • Paracatu is among the world’s largest gold operations with annual throughput of ~60Mt • Achieved record annual production in 2014 AMERICAS PARACATU, BRAZIL (100%) TONNES (thousands) GRADE (g/t) OUNCES (thousands) 2P Reserves 749,125 0.44 10,510 M&I Resources 291,285 0.32 3,002 Inferred Resources 2,283 0.31 22 FY 2014 YTD Q3 2015 Production (Au. Eq. oz.) 521,026 364,115 Production cost of sales ($/oz.) $816 $777 Large gold mine with a long mine life that extends to 2030 OPERATING RESULTS(3) 2014 GOLD RESERVE AND RESOURCE ESTIMATES(5) (3) Refer to endnote #3. (5) Refer to endnote #5.
  • 41. www.kinross.com 41 • New team focused on improving operating efficiencies and reducing costs • Record annual production in 2014 AMERICAS MARICUNGA, CHILE (100%) TONNES (thousands) GRADE (g/t) OUNCES (thousands) 2P Reserves 66,687 0.78 1,670 M&I Resources 195,462 0.64 3,996 Inferred Resources 57,439 0.58 1,065 FY 2014 YTD Q3 2015 Production (Au. Eq. oz.) 247,216 157,207 Production cost of sales ($/oz.) $953 $1,037 High-altitude heap leach operation located in the highly prospective Maricunga District OPERATING RESULTS(3) 2014 GOLD RESERVE AND RESOURCE ESTIMATES(5) (3) Refer to endnote #3. (5) Refer to endnote #5.
  • 42. www.kinross.com 42 • High-grade, low-cost underground mines • Dvoinoye is the 4th mine Kinross has operated in its 20-year history in the region RUSSIA KUPOL-DVOINOYE (100%) KUPOL TONNES (thousands) GRADE (g/t) OUNCES (thousands) 2P Reserves 7,616 8.53 2,089 M&I Resources 386 15.97 198 Inferred Resources 474 12.55 191 DVOINOYE 2P Reserves 2,137 14.97 1,028 M&I Resources 118 9.94 38 Inferred Resources 122 12.10 47 FY 2014 YTD Q3 2015 Production (Au. Eq. oz.) 751,101 567,255 Production cost of sales ($/oz.) $507 $477 OPERATING RESULTS(3) 2014 GOLD RESERVE AND RESOURCE ESTIMATES(5) Our Russian operations are a model for successfully operating in a remote location (3) Refer to endnote #3. (5) Refer to endnote #5.
  • 43. www.kinross.com 43 • Achieved record annual production in 2014 • Continuing effort to reduce operating costs at existing operation WEST AFRICA TASIAST, MAURITANIA (100%) TONNES (thousands) GRADE (g/t) OUNCES (thousands) 2P Reserves 161,822 1.77 9,196 M&I Resources 85,573 1.14 3,148 Inferred Resources 8,951 1.71 492 FY 2014 YTD Q3 2015 Production (Au. Eq. oz.) 260,485 165,339 Production cost of sales ($/oz.) $998 $1,042 Operating mine with a large gold resource located in a prospective district OPERATING RESULTS(3) 2014 GOLD RESERVE AND RESOURCE ESTIMATES(5) (3) Refer to endnote #3. (5) Refer to endnote #5.
  • 44. www.kinross.com 44 • Chirano is now among our lowest cost operations following transition to self-perform mining in open pits and underground WEST AFRICA CHIRANO, GHANA (90%) TONNES (thousands) GRADE (g/t) OUNCES (thousands) 2P Reserves 12,055 2.38 924 M&I Resources 15,356 2.46 1,214 Inferred Resources 1,204 3.43 133 FY 2014 YTD Q3 2015 Production (Au. Eq. oz.) 257,888 178,178 Production cost of sales ($/oz.) $591 $675 Cost reductions achieved at Chirano through transition to self-perform mining OPERATING RESULTS(2,3) 2014 GOLD RESERVE AND RESOURCE ESTIMATES(5) (2) Refer to endnote #2. (3) Refer to endnote #3. (5) Refer to endnote #5.
  • 45. www.kinross.com 45 OPERATION PRODUCTION (Au eq. oz.) PRODUCTION COST OF SALES(3) ($ per Au eq. oz.) Fort Knox 379,453 $712 Round Mountain (50%) 169,839 $855 Kettle River – Buckhorn 123,382 $678 Paracatu 521,026 $816 Maricunga 247,216 $953 AMERICAS TOTAL 1,440,916 $804 Kupol-Dvoinoye 751,101 $507 RUSSIA TOTAL 751,101 $507 Tasiast 260,485 $998 Chirano (90%)(2) 257,888 $591 WEST AFRICA TOTAL 518,373 $795 KINROSS TOTAL 2,710,390 $720 OPERATIONAL EXCELLENCE FY2014 OPERATING RESULTS (2) Refer to endnote #2. (3) Refer to endnote #3.
  • 46. www.kinross.com 46 PRE-FEASIBILTY STUDY RESULTS LA COIPA PROJECT Life of Mine Estimates Mill throughput capacity 13,000 tonnes per day Average mining rate 80,000 tonnes per day Average gold grade 1.69 g/t Average silver grade 61.5 g/t Average gold recovery 76% Average silver recovery 59% Strip ratio (waste:ore) 5.0 • The pre-feasibility study estimates a 5.5 year mine life, following receipt of permits and commencement of stripping  Processing expected to commence 1.5 years after pre-stripping has been initiated and continue for 4 years Assumptions Gold price $1,200 per oz. Silver price $17 per oz. Oil price $65 per barrel Chilean Peso 600 to the US dollar Discount rate 5% KEY ASSUMPTIONSADDITIONAL OPERATING METRICS $1,100 $1,200 $1,300 IRR 15% 20% 26% GOLD PRICE SENSITIVITY
  • 47. www.kinross.com 47 EXPLANATORY NOTES: EXPLORATION Kupol & Dvoinoye Exploration Results All 28 drill holes in 2014 at Providence were diamond drill core holes (HQ or NQ core diameter). The Providence vein dips sub-vertically, therefore, drill holes are angled between minus 50° and 75° to the east and west. The composite intervals reported for Providence diamond drill core are selected mainly by geological parameters but some of the intervals are included taking into account the elevated Au and Ag values of the assay data. The intervals are calculated by taking a weighted average of all gold and silver fire assay values included. No more than three consecutive metres of internal waste (<1 grams per tonne) is accepted. High grade samples are not excluded from the calculation. All composite assay intervals are reported as down-hole widths and are not considered true thickness. Results reported for September Northeast (NE) are from 81 diamond drill core holes completed during 2014 and 38 surface trenches (stripped pavement). Composite assay intervals reported for September NE diamond drill core results are calculated by taking a weighted average of all gold fire assay values equal to or above 2.0 gram per tonne gold. No more than three consecutive metres of internal waste (<2.0 grams per tonne) is accepted, high grade samples are not cut. True widths are estimated to be on average greater than 80% of the drilled intercept. Results for the exploration drill campaign are reported as Au grams per tonne (Au g/t), Ag grams per tonne (Ag g/t) and as Au Equivalent grams per tonne (Au Eq g/t). Au Eq is calculated using Ag g/t / 63.64 and added to the Au g/t assay result. Abbreviations used are: NSI - No Significant Intersection; BDL - Below Detection Limit; TNS - Trench Not sampled The reader is referred to the Kupol NI 43-101 Technical Report dated May 9, 2011, available under the Company’s profile at www.sedar.com, for a full description of drilling methods, sampling procedures and QA/QC protocols. Samples from Providence and September NE are prepared and analyzed by fire assay using a 50 gram charge with a gravimetric finish at the Kupol mine site analytical laboratory in compliance with industry standards. Field duplicate samples are taken and blanks and standards are added to every batch submitted. The technical information about the Company’s drilling and exploration activities at Kupol and Dvoinoye contained in this news release has been prepared under the supervision of and verified by Mr. Sylvain Guerard, an officer with the Company who is a “qualified person” within the meaning of National Instrument 43-101. The drill hole data base including collar, survey, geology and assay information were reviewed by the “qualified person” and the composite assay information independently calculated and verified for accuracy of reporting. Assay certificates for the information disclosed in this news release were verified by the Regional Director Exploration, Russia, but not by Mr. Guerard as the “qualified person”.
  • 48. www.kinross.com 48 EXPLANATORY NOTES: EXPLORATION Tasiast Exploration Results Drill hole identifiers ending with suffix DD are diamond drill core holes (HQ diameter) and those ending with suffix RC are reverse circulation (RC) holes. Holes with “A” prefixing DD or RC are diamond core or reverse circulation re-drills of the original hole where significant deviation would have resulted in that hole missing the intended target. Results provided for Tasiast include all exploration drill holes for which assay results were available from Tamaya at the time of preparation of this news release. Composite assay intervals reported for exploration drilling at Tasiast are calculated by taking a weighted average of all gold fire assay values equal to or above 0.3 g/t gold. No more than three consecutive metres of internal waste (<0.3 g/t gold) are accepted and high grade samples are cut to 20 grams per tonne gold. All assay intervals are reported as down-hole widths. True widths are estimated to be on average greater than 90% of the drilled intercept. Composite intervals for reconnaissance reverse circulation holes are calculated by applying a 0.3 gram per tonne cut-off, no more than 6 metres of internal waste and no top cut. All assay intervals are reported as down-hole thicknesses. There is insufficient information on all targets to provide estimates of true thickness. The reader is referred to the Tasiast NI 43-101 Technical Report dated March 31, 2014, available under the Company’s profile at www.sedar.com, for a full description of drilling methods, sampling procedures and QA/QC protocols. Samples from Tasiast are prepared and analyzed by fire assay using a 50 gram charge with an AAS finish at ALS (Tasiast mine site, Johannesburg, South Africa and Vancouver, Canada) in compliance with industry standards. Field duplicate samples are taken and blanks and standards are added to every batch submitted. Selected samples from this lab are check assayed each month at other ALS and third party commercial laboratories worldwide. The technical information about the Company’s drilling and exploration activities at Tasiast contained in this news release has been prepared under the supervision of and verified by Mr. Sylvain Guerard, an officer with the Company who is a “qualified person” within the meaning of National Instrument 43-101. The drill hole data base including collar, survey, geology and assay information were reviewed by the “qualified person” and the composite assay information independently calculated and verified for accuracy of reporting. Assay certificates for the information disclosed in this news release were verified by the Regional Director Exploration, Africa, but not by Mr. Guerard as the “qualified person”.
  • 49. www.kinross.com 49 ENDNOTES 1) For more information regarding Kinross’ production, cost and capital expenditures outlook for 2015, please refer to the news releases dated February 10, 2015 and September 17, 2015, available on our website at www.kinross.com. Kinross’ outlook for 2015 represents forward-looking information and users are cautioned that actual results may vary. Please refer to the risks and assumptions contained in the Cautionary Statement on Forward-Looking Information on slide 2 of this presentation. 2) Unless otherwise noted, gold equivalent production, gold equivalent ounces sold and production cost of sales figures in this presentation are based on Kinross’ 90% share of Chirano production and sales. 3) Attributable production cost of sales per gold equivalent ounce sold and per gold ounce on a by-product basis are non- GAAP measures. For more information and a reconciliation of this non-GAAP measure for the three months and nine months ended September 30, 2015 and 2014, please refer to the news release dated November 10, 2015, under the heading “Reconciliation of non-GAAP financial measures”, available on our website at www.kinross.com. 4) All-in sustaining cost is a non-GAAP measure. For more information and a reconciliation of this non-GAAP measure for the three months and nine months ended September 30, 2015 and 2014, please refer to the news release dated November 10, 2015 under the heading “Reconciliation of non-GAAP financial measures”, available on our website at www.kinross.com. 5) For more information regarding Kinross’ mineral reserves and mineral resources, please refer to our Annual Mineral Reserve and Mineral Resource Statement as at December 31, 2014 contained in our news release dated February 10, 2015, which is available on our website at www.kinross.com.
  • 50. www.kinross.com 50 KINROSS GOLD CORPORATION 25 York Street, 17th Floor │Toronto, ON │ M5J 2V5 www.kinross.com