Federal University ofAgriculture, Abeokuta
College of Natural Sciences
Department of Computer Science
CSC 324 (System Analysis and Design) Lecture Slides
1
2.
Course Objectives
2
To providestudents with new ways of looking at information
in the world in order to solve business problems
To introduce students to concepts and methods of SAD
To describe the systems development life cycle (SDLC)
To teach students effective methods for gathering essential
information during system analysis
To teach students approaches to documenting and modeling
of gathered information
To teach students effective methods for designing systems to
solve problems effectively using appropriate methodology and
technology
3.
Topics to becovered
3
System’s concept
The system development environment
Types of information systems
Rapid application development
Role of the systems analyst
Managing an IT project
Initiating and planning a systems development project
Determining systems requirements
Process modeling
Logic modeling
Project documentation
Understanding the elements of systems design
Designing the user interface
Designing system interfaces, controls and security
4.
Recommended Textbooks
4
Textbook:
Textbook:
Systems Analysisand Design in a Changing World, John
Satzinger, Robert Jackson and Stephen Burd. 5th edition.
Thomson Course Technology, 2009 (ISBN-13: 978-1-4239-0228-
7)
Recommended Reading:
Recommended Reading:
Systems Analysis and Design, Alan Dennis and Barbara Haley Wixom. John
Wiley & Sons, 2000 (ISBN 0-471-24100-8)
Essentials of Systems Analysis and Design, Joseph Valacich, Joey F. George
and Jeffrey A. Hoffer. Prentice Hall, 2001 (ISBN 0-13-018373-3)
Systems Analysis and Design Methods, Jeffrey L. Whitten, Lonnie D. Bentley
and Kevin C. Dittman. Irwin/McGraw-Hill, 1998 (ISBN 0-256-23826-X)
Introduction to Systems Analysis and Design: A Structured Approach, Penny
A. Kendall. Irwin/McGraw-Hill, 1996 (ISBN 0-697-12414-2)
5.
Introduction
5
• Systems Analysismeans understanding and specifying in detail
what an information system should do.
• System Design has to do with specifying in detail how the parts
of an information system should be implemented
Why is it important?
• Success of information systems depends on good SAD
• Widely used in industry - proven techniques
• Part of career growth in IT - lots of interesting and well-paying
jobs!
• Increasing demand for systems analysis skills
6.
SDLC as Partof the IT Project Lifecycle
While every IT project requires Initiation, Feasibility Analysis
and Project Planning, and concludes with a Project
Termination, there are certain steps that are specific to
systems development, which is the focus of this course.
Thus, the SDLC is contained within the generic IT project
lifecycle.
6
7.
Systems Development LifecycleSteps
The SDLC is generally presented as an iterative
sequence of five steps:
Systems Planning
Systems Analysis
Systems Design
Systems Implementation
Systems Operation and Support,
each culminating in a deliverable, either a written
document or a piece of software (or both)
7
SDLC allows organizations to incorporate new requirements,
technology and human resources to IT development
8.
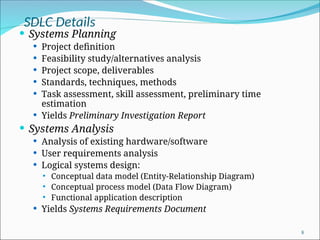
SDLC Details
SystemsPlanning
Project definition
Feasibility study/alternatives analysis
Project scope, deliverables
Standards, techniques, methods
Task assessment, skill assessment, preliminary time
estimation
Yields Preliminary Investigation Report
Systems Analysis
Analysis of existing hardware/software
User requirements analysis
Logical systems design:
Conceptual data model (Entity-Relationship Diagram)
Conceptual process model (Data Flow Diagram)
Functional application description
Yields Systems Requirements Document
8
9.
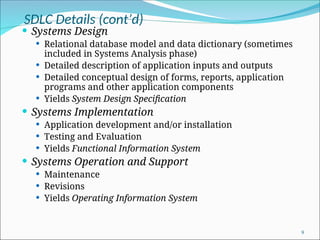
SDLC Details (cont’d)
Systems Design
Relational database model and data dictionary (sometimes
included in Systems Analysis phase)
Detailed description of application inputs and outputs
Detailed conceptual design of forms, reports, application
programs and other application components
Yields System Design Specification
Systems Implementation
Application development and/or installation
Testing and Evaluation
Yields Functional Information System
Systems Operation and Support
Maintenance
Revisions
Yields Operating Information System
9
10.
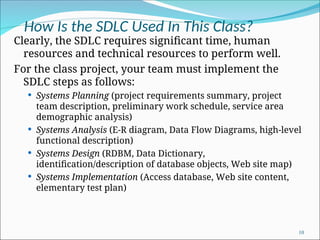
How Is theSDLC Used In This Class?
Clearly, the SDLC requires significant time, human
resources and technical resources to perform well.
For the class project, your team must implement the
SDLC steps as follows:
Systems Planning (project requirements summary, project
team description, preliminary work schedule, service area
demographic analysis)
Systems Analysis (E-R diagram, Data Flow Diagrams, high-level
functional description)
Systems Design (RDBM, Data Dictionary,
identification/description of database objects, Web site map)
Systems Implementation (Access database, Web site content,
elementary test plan)
10
11.
11
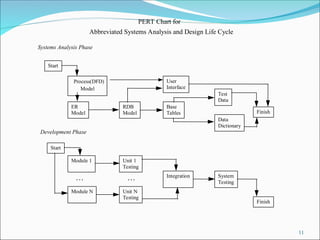
PERT Chart for
AbbreviatedSystems Analysis and Design Life Cycle
Systems Analysis Phase
Start
Process(DFD)
Model
ER
Model
RDB
Model
Test
Data
Data
Dictionary
Start
Module 1 Unit 1
Testing
Module N Unit N
Testing
Base
Tables
User
Interface
Integration System
Testing
Finish
Finish
Development Phase
. . . . . .
12.
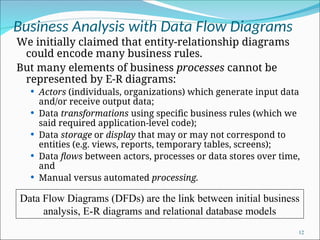
Business Analysis withData Flow Diagrams
We initially claimed that entity-relationship diagrams
could encode many business rules.
But many elements of business processes cannot be
represented by E-R diagrams:
Actors (individuals, organizations) which generate input data
and/or receive output data;
Data transformations using specific business rules (which we
said required application-level code);
Data storage or display that may or may not correspond to
entities (e.g. views, reports, temporary tables, screens);
Data flows between actors, processes or data stores over time,
and
Manual versus automated processing.
12
Data Flow Diagrams (DFDs) are the link between initial business
analysis, E-R diagrams and relational database models
13.
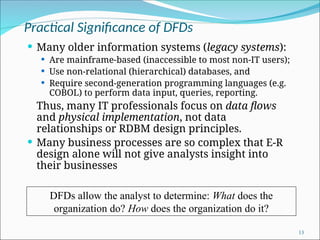
Practical Significance ofDFDs
Many older information systems (legacy systems):
Are mainframe-based (inaccessible to most non-IT users);
Use non-relational (hierarchical) databases, and
Require second-generation programming languages (e.g.
COBOL) to perform data input, queries, reporting.
Thus, many IT professionals focus on data flows
and physical implementation, not data
relationships or RDBM design principles.
Many business processes are so complex that E-R
design alone will not give analysts insight into
their businesses
13
DFDs allow the analyst to determine: What does the
organization do? How does the organization do it?
14.
Creating DFDs
14
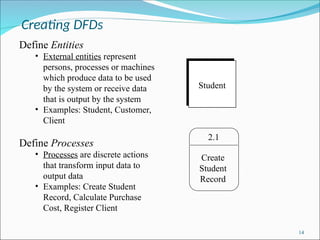
Define Entities
•External entities represent
persons, processes or machines
which produce data to be used
by the system or receive data
that is output by the system
• Examples: Student, Customer,
Client
Define Processes
• Processes are discrete actions
that transform input data to
output data
• Examples: Create Student
Record, Calculate Purchase
Cost, Register Client
Student
2.1
Create
Student
Record
15.
Creating DFDs (cont’d)
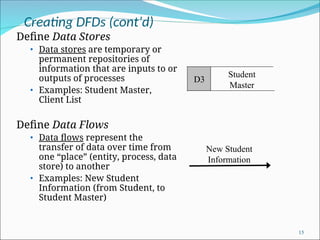
DefineData Stores
• Data stores are temporary or
permanent repositories of
information that are inputs to or
outputs of processes
• Examples: Student Master,
Client List
Define Data Flows
• Data flows represent the
transfer of data over time from
one “place” (entity, process, data
store) to another
• Examples: New Student
Information (from Student, to
Student Master)
15
New Student
Information
Student
Master
D3
16.
Creating DFDs (cont’d)
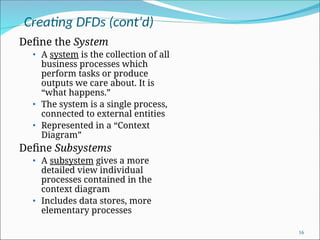
Definethe System
• A system is the collection of all
business processes which
perform tasks or produce
outputs we care about. It is
“what happens.”
• The system is a single process,
connected to external entities
• Represented in a “Context
Diagram”
Define Subsystems
• A subsystem gives a more
detailed view individual
processes contained in the
context diagram
• Includes data stores, more
elementary processes
16
17.
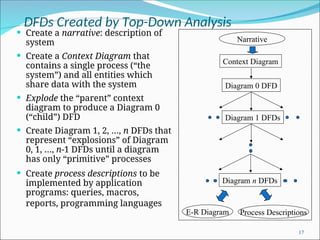
DFDs Created byTop-Down Analysis
Create a narrative: description of
system
Create a Context Diagram that
contains a single process (“the
system”) and all entities which
share data with the system
Explode the “parent” context
diagram to produce a Diagram 0
(“child”) DFD
Create Diagram 1, 2, …, n DFDs that
represent “explosions” of Diagram
0, 1, …, n-1 DFDs until a diagram
has only “primitive” processes
Create process descriptions to be
implemented by application
programs: queries, macros,
reports, programming languages
17
Context Diagram
Diagram 0 DFD
Diagram 1 DFDs
Diagram n DFDs
Narrative
E-R Diagram Process Descriptions
18.
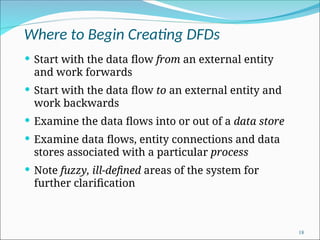
Where to BeginCreating DFDs
Start with the data flow from an external entity
and work forwards
Start with the data flow to an external entity and
work backwards
Examine the data flows into or out of a data store
Examine data flows, entity connections and data
stores associated with a particular process
Note fuzzy, ill-defined areas of the system for
further clarification
18
19.
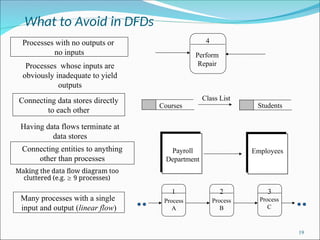
What to Avoidin DFDs
Making the data flow diagram too
cluttered (e.g. 9 processes)
19
4
Perform
Repair
Processes with no outputs or
no inputs
1 2 3
Many processes with a single
input and output (linear flow)
Processes whose inputs are
obviously inadequate to yield
outputs
Having data flows terminate at
data stores
Connecting data stores directly
to each other
Courses Students
Class List
Connecting entities to anything
other than processes
Payroll
Department
Employees
Process
A
Process
B
Process
C
20.
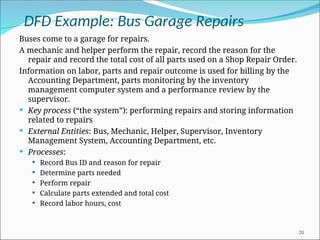
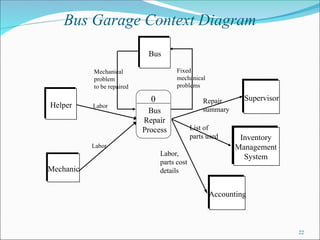
DFD Example: BusGarage Repairs
Buses come to a garage for repairs.
A mechanic and helper perform the repair, record the reason for the
repair and record the total cost of all parts used on a Shop Repair Order.
Information on labor, parts and repair outcome is used for billing by the
Accounting Department, parts monitoring by the inventory
management computer system and a performance review by the
supervisor.
Key process (“the system”): performing repairs and storing information
related to repairs
External Entities: Bus, Mechanic, Helper, Supervisor, Inventory
Management System, Accounting Department, etc.
Processes:
Record Bus ID and reason for repair
Determine parts needed
Perform repair
Calculate parts extended and total cost
Record labor hours, cost
20
21.
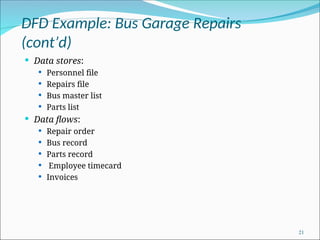
DFD Example: BusGarage Repairs
(cont’d)
Data stores:
Personnel file
Repairs file
Bus master list
Parts list
Data flows:
Repair order
Bus record
Parts record
Employee timecard
Invoices
21