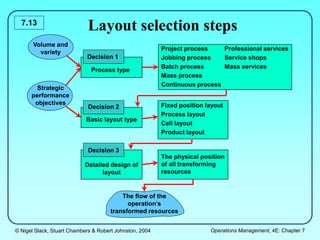
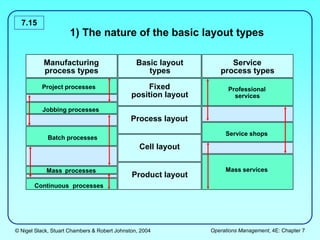
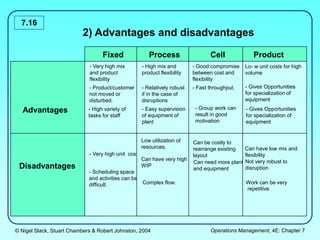
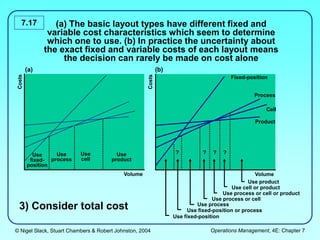
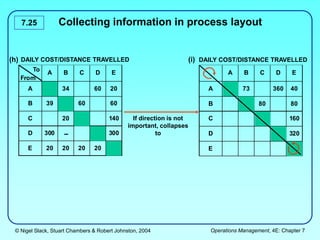
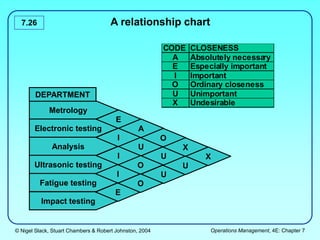
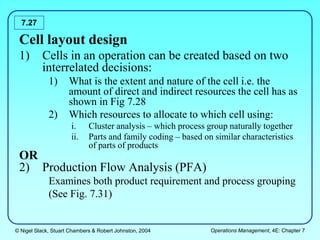
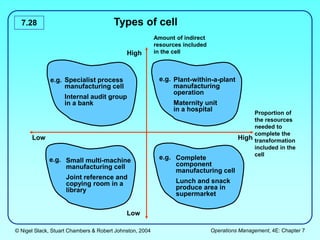
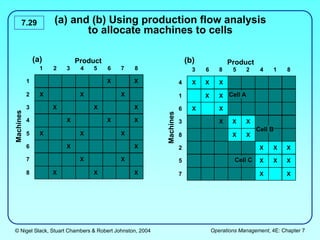
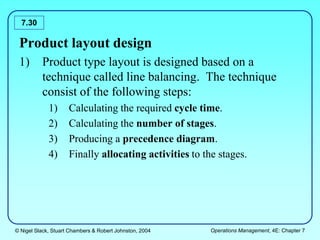
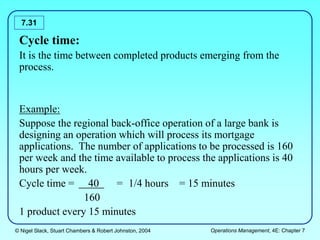
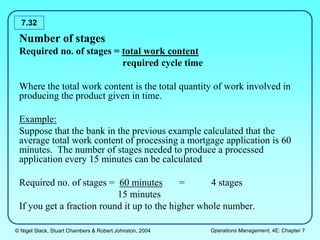
© Nigel Slack, Stuart Chambers & Robert Johnston, 2004 Operations Management, 4E: Chapter 7
7.1
Layout and Flow
© Nigel Slack, Stuart Chambers & Robert Johnston, 2004 Operations Management, 4E: Chapter 7
7.2
Chapter coverage
• Basic layout types
• Selecting a layout type
• Detailed design of a layout
© Nigel Slack, Stuart Chambers & Robert Johnston, 2004 Operations Management, 4E: Chapter 7
7.3
physical location of its transforming resources, that
is deciding where to put the facilities, machines,
equipment and staff in the operation.
Layout types:
1) Fixed position layout
2) Process layout
3) Cell layout
4) Product layout
© Nigel Slack, Stuart Chambers & Robert Johnston, 2004 Operations Management, 4E: Chapter 7
7.4
Fixed position layout
1) In a fixed position layout, the transformed resource
does not move between its transforming resources.
2) Equipment, machinery, plant and people who do
the processing move as necessary because the
product or customer is either:
i. Too large
ii. Too delicate or
iii. Objects being moved
© Nigel Slack, Stuart Chambers & Robert Johnston, 2004 Operations Management, 4E: Chapter 7
7.5
Process layout
1) In a process layout, similar processes or processes
with similar needs are located together because:
i. It is convenient to group them together or
ii. The utilization of the transforming resource is
improved
2) Different products of customer have different
requirements therefore they may take different
routes within the process.
3) The flow in a process layout can be very complex.
© Nigel Slack, Stuart Chambers & Robert Johnston, 2004 Operations Management, 4E: Chapter 7
7.6 An example of a process layout in a library
showing the path of just one customer
Entrance Exit
On-line and
CD-ROM
access room
Loan books in subject order
Enquiries
Store
room
Counter staff
Copying area
Company
reports
To
journal
sack
Current
journals
Reserve
collection
Reference
section
Study desks
© Nigel Slack, Stuart Chambers & Robert Johnston, 2004 Operations Management, 4E: Chapter 7
7.7
Cell layout
1) In a cell layout, the transformed resources entering
the operation move into a cell in which all the
transforming resources it requires in located.
2) After being processed in the cell, the transformed
resource may move to a different cell in the
operation or it may be a finished product or service.
3) Each cell may be arranged in either a process or
product layout.
4) The cell type layout attempts to bring order to the
complex flow seen in a process layout.
© Nigel Slack, Stuart Chambers & Robert Johnston, 2004 Operations Management, 4E: Chapter 7
7.8 The ground floor plan of a department store
showing the sports goods shop-within-a-shop
retail ‘cell’
Sports shop Menswear
Women’s clothes
Luggage
and gifts
Confectionery,
newspaper,
magazines and
stationery
Books
and
videos Footwear
Perfume
& jewellery
Elevators
Entrance
© Nigel Slack, Stuart Chambers & Robert Johnston, 2004 Operations Management, 4E: Chapter 7
7.9
Product layout
1) In a product layout, the transformed resource flow
a long a line of processes that has been
prearranged.
2) Flow is clear, predictable and easy to control.
© Nigel Slack, Stuart Chambers & Robert Johnston, 2004 Operations Management, 4E: Chapter 7
7.10 An army induction centre with uses
product layout
Lecture theatre
Uniform
issuing
area
Uniform
store
Waiting
area
Waiting
area
Doctor
Doctor
Doctor
Doctor
Doctor
Doctor
Blood
test
Blood
test
Blood
test
X-ray
X-ray
X-ray
Record
personal
history and
medical
details
© Nigel Slack, Stuart Chambers & Robert Johnston, 2004 Operations Management, 4E: Chapter 7
7.11 A restaurant complex with all four basic
layout types
Fixed-position layout
service restaurant
Cell layout buffet
Line layout cafeteria
Cool room
Freezer Vegetable prep Grill
Preparation
Oven
Process layout kitchen
Main course
buffet
Starter
buffet
Desert
buffet
Service line
© Nigel Slack, Stuart Chambers & Robert Johnston, 2004 Operations Management, 4E: Chapter 7
7.12
Fixed-position
layout
Product
layout
Cell layout
Process
layout
Volume
Low High
Variety
Low
High
Flow is
intermittent
Regular flow more important
Flow
becomes
continuous
Regular
flow
more
feasible
Volume-variety relationship
© Nigel Slack, Stuart Chambers & Robert Johnston, 2004 Operations Management, 4E: Chapter 7
7.13
Project process
Jobbing process
Batch process
Mass process
Continuous process
Professional services
Service shops
Mass services
Fixed position layout
Process layout
Cell layout
Product layout
The physical position
of all transforming
resources
The flow of the
operation’s
transformed resources
Process type
Basic layout type
Detailed design of
layout
Volume and
variety
Strategic
performance
objectives
Decision 1
Decision 2
Decision 3
Layout selection steps
© Nigel Slack, Stuart Chambers & Robert Johnston, 2004 Operations Management, 4E: Chapter 7
7.14
Selecting a layout type
© Nigel Slack, Stuart Chambers & Robert Johnston, 2004 Operations Management, 4E: Chapter 7
7.15
1) The nature of the basic layout types
Basic layout
types
Manufacturing
process types
Service
process types
Fixed
position layout
Project processes
Process layout
Cell layout
Product layout
Jobbing processes
Batch processes
Mass processes
Continuous processes
Professional
services
Service shops
Mass services
Project processes
© Nigel Slack, Stuart Chambers & Robert Johnston, 2004 Operations Management, 4E: Chapter 7
7.16
2) Advantages and disadvantages
Fixed
position
layout
Process
layout
Cell
layout
Product
layout
Disadvantages
Advantages
- Very high mix
and product
flexibility
- Product/customer
not moved or
disturbed.
- Very high unit cost.
- Scheduling space
and activities can be
difficult.
- High mix and
product flexibility
- Relatively robust
if in the case of
disruptions
Low utilization of
resources.
Can have very high
WIP
Complex flow.
- Good compromise
between cost and
flexibility
- Fast throughput.
- Group work can
result in good
motivation
Can be costly to
rearrange existing
layout
Can need more plant
and equipment
Lo- w unit costs for high
volume
- Gives Opportunities
for specialization of
equipment
Can have low mix and
flexibility
Not very robust to
disruption
Work can be very
repetitive.
- High variety of
tasks for staff
- Easy supervision
of equipment of
plant
- Gives Opportunities
for specialization of
equipment
© Nigel Slack, Stuart Chambers & Robert Johnston, 2004 Operations Management, 4E: Chapter 7
7.17 (a) The basic layout types have different fixed and
variable cost characteristics which seem to determine
which one to use. (b) In practice the uncertainty about
the exact fixed and variable costs of each layout means
the decision can rarely be made on cost alone
Use fixed-position
Use fixed-position or process
Use process
Use process or cell
Use process or cell or product
Use cell or product
Use product
Volume
Costs
Fixed-position
Process
Cell
Product
Volume
Costs
Use
product
Use
cell
Use
process
Use
fixed-
position
(a) (b)
? ? ? ?
3) Consider total cost
© Nigel Slack, Stuart Chambers & Robert Johnston, 2004 Operations Management, 4E: Chapter 7
7.18
Detailed design of a layout
© Nigel Slack, Stuart Chambers & Robert Johnston, 2004 Operations Management, 4E: Chapter 7
7.19
Fixed position layout design:
• The location of resources for each project is unique
and it will be determined on the convenience of
transforming resources themselves.
• Although there are techniques which held to locate
resources on fixed position layouts, they are not
widely used because this layout can be very
complex and planned schedules do change
frequently.
© Nigel Slack, Stuart Chambers & Robert Johnston, 2004 Operations Management, 4E: Chapter 7
7.20
Process layout design:
• When cost of traveling is important:
– Collecting information such as:
• number of loads per day
• cost per distance traveled
• When process relationship is important
– Relationship chart
© Nigel Slack, Stuart Chambers & Robert Johnston, 2004 Operations Management, 4E: Chapter 7
7.21 Collecting information in process layout
If direction is not
important, collapses
to
A B C D E
A 30 60 20
B 30 30
C 80
D 40
E
LOADS/DAY
(b)
To
From
A B C D E
A 17 30 10
B 13 20 20
C 10 70
D 30 30
E 10 10 10 10
LOADS/DAY
(a)
© Nigel Slack, Stuart Chambers & Robert Johnston, 2004 Operations Management, 4E: Chapter 7
7.22 Collecting information in process layout
Or alternatively
A B C D E
A 30 60 20
B 30 30
C 80
D 40
E
LOADS/DAY
(c)
LOADS/DAY
(d)
A
B
C
D
E
30
30
-
40
-
-
80
60
30
20
© Nigel Slack, Stuart Chambers & Robert Johnston, 2004 Operations Management, 4E: Chapter 7
7.23
Collecting information in process layout
To
From
A B C D E
A 17 30 10
B 13 20 20
C 10 70
D 30 30
E 10 10 10 10
If cost of flow differs
between work
centers, combine
with
LOADS/DAY
To
From
A B C D E
A 2 2 2 2
B 3 3 3 4
C 2 2 2 2
D 10 10 10 10
E 2 2 2 2
UNIT COST/DISTANCE TRAVELLED
(e) (f)
© Nigel Slack, Stuart Chambers & Robert Johnston, 2004 Operations Management, 4E: Chapter 7
7.24 Collecting information in process layout
To give
To
From
A B C D E
A 34 60 20
B 39 60 60
C 20 140
D 300 300
E 20 20 20 20
DAILY COST/DISTANCE TRAVELLED
(g)
© Nigel Slack, Stuart Chambers & Robert Johnston, 2004 Operations Management, 4E: Chapter 7
7.25 Collecting information in process layout
If direction is not
important, collapses
to
To
From
A B C D E
A 34 60 20
B 39 60 60
C 20 140
D 300 300
E 20 20 20 20
DAILY COST/DISTANCE TRAVELLED
(h)
A B C D E
A 73 360 40
B 80 80
C 160
D 320
E
DAILY COST/DISTANCE TRAVELLED
(i)
© Nigel Slack, Stuart Chambers & Robert Johnston, 2004 Operations Management, 4E: Chapter 7
7.26 A relationship chart
CODE CLOSENESS
A Absolutely necessa
ry
E Especially important
I Important
O Ordinary closeness
U Unimportant
X Undesirable
X
Metrology
Electronic testing
Analysis
Ultrasonic testing
Fatigue testing
E
I
I
I
A
U
O
O
U
X
DEPARTMENT
Impact testing
E
O
U
U
X
© Nigel Slack, Stuart Chambers & Robert Johnston, 2004 Operations Management, 4E: Chapter 7
7.27
Cell layout design
1) Cells in an operation can be created based on two
interrelated decisions:
1) What is the extent and nature of the cell i.e. the
amount of direct and indirect resources the cell has as
shown in Fig 7.28
2) Which resources to allocate to which cell using:
i. Cluster analysis – which process group naturally together
ii. Parts and family coding – based on similar characteristics
of parts of products
OR
2) Production Flow Analysis (PFA)
Examines both product requirement and process grouping
(See Fig. 7.31)
© Nigel Slack, Stuart Chambers & Robert Johnston, 2004 Operations Management, 4E: Chapter 7
7.28 Types of cell
High
High
Low
Low
Complete
component
manufacturing cell
Lunch and snack
produce area in
supermarket
Small multi-machine
manufacturing cell
Joint reference and
copying room in a
library
Plant-within-a-plant
manufacturing
operation
Maternity unit
in a hospital
Specialist process
manufacturing cell
Internal audit group
in a bank
Amount of indirect
resources included
in the cell
Proportion of
the resources
needed to
complete the
transformation
included in the
cell
e.g. e.g.
e.g. e.g.
© Nigel Slack, Stuart Chambers & Robert Johnston, 2004 Operations Management, 4E: Chapter 7
7.29
1 2 3 4 5 6 7 8
1 X X
2 X X X
3 X X X
4 X X X
5 X X X
6 X X
7 X X
8 X X X
(a) and (b) Using production flow analysis
to allocate machines to cells
Product
Machines
3 6 8 5 2 4 1 8
4 X X X
1 X X
6 X X
3 X X X
8 X X
2 X X X
5 X X X
7 X X
Product
Machines
Cell A
Cell B
Cell C
(a) (b)
© Nigel Slack, Stuart Chambers & Robert Johnston, 2004 Operations Management, 4E: Chapter 7
7.30
Product layout design
1) Product type layout is designed based on a
technique called line balancing. The technique
consist of the following steps:
1) Calculating the required cycle time.
2) Calculating the number of stages.
3) Producing a precedence diagram.
4) Finally allocating activities to the stages.
© Nigel Slack, Stuart Chambers & Robert Johnston, 2004 Operations Management, 4E: Chapter 7
7.31
Cycle time:
It is the time between completed products emerging from the
process.
Example:
Suppose the regional back-office operation of a large bank is
designing an operation which will process its mortgage
applications. The number of applications to be processed is 160
per week and the time available to process the applications is 40
hours per week.
Cycle time = 40 = 1/4 hours = 15 minutes
160
1 product every 15 minutes
© Nigel Slack, Stuart Chambers & Robert Johnston, 2004 Operations Management, 4E: Chapter 7
7.32
Number of stages
Required no. of stages = total work content
required cycle time
Where the total work content is the total quantity of work involved in
producing the product given in time.
Example:
Suppose that the bank in the previous example calculated that the
average total work content of processing a mortgage application is 60
minutes. The number of stages needed to produce a processed
application every 15 minutes can be calculated
Required no. of stages = 60 minutes = 4 stages
15 minutes
If you get a fraction round it up to the higher whole number.
© Nigel Slack, Stuart Chambers & Robert Johnston, 2004 Operations Management, 4E: Chapter 7
7.33
Precedence diagram
This is a diagram representing the ordering of the elements which
comprise the total work content of the product or service.
Two rules when constructing the diagram:
1. The circles which represent the elements are drawn as
far to the left as possible.
2. None of the arrows which shows the precedence of the
elements should be vertical.
a b c d
e
f g
h
i
0.12 mins
0.30 mins
0.36 mins
0.25 mins 0.05 mins
0.17 mins
0.10 mins
0.08 mins
0.25 mins
© Nigel Slack, Stuart Chambers & Robert Johnston, 2004 Operations Management, 4E: Chapter 7
7.34
Allocating activities to the stages
The general approach is to allocate elements from the precedence
diagram to the first stage, starting from the left, until the
work allocated to the stage is as close to, but less than, the
cycle time.
When the stage is full of work without exceeding the cycle time,
move to the next stage.
Two rules help to decide which activities to allocate to a stage:
1. Choose the largest that will fit into the time remaining at
the stage
2. Choose the element with the most ‘followers’.
© Nigel Slack, Stuart Chambers & Robert Johnston, 2004 Operations Management, 4E: Chapter 7
7.35
Balancing loss
The effectiveness of the line balancing activity is measured by the
balancing loss.
This is the time wasted through the unequal allocation of work as
a percentage of the total time invested in processing the product
or service.
Balancing loss = Total idle time
No. of stages x Cycle time
© Nigel Slack, Stuart Chambers & Robert Johnston, 2004 Operations Management, 4E: Chapter 7
7.36 Balancing loss is that proportion of the time
invested in processing the product or service
which is not used productively
0
0.5
1
1.5
2
2.5
3
1 2 3 4
Load
Stage
Cycle time = 2.5 mins
0
0.5
1
1.5
2
2.5
3
3.5
1 2 3 4
Load
Stage
Cycle time = 3.0 mins
2.3
2.5
2.2
3.0
An ideal ‘balance’ where work is
allocated equally between the stages
But if work is not equally allocated the
cycle time will increase and
‘balancing losses’ will occur
Work allocated to stage
Idle time
Calculating balancing loss:
Idle time every cycle =(3.0 - 2.3) +
(3.0 - 2.5) +
(3.0 - 2.2) = 2.0 mins
Balancing loss = 2
4 x 3.0
= 0.1667
= 16.67%
© Nigel Slack, Stuart Chambers & Robert Johnston, 2004 Operations Management, 4E: Chapter 7
7.37
Worked Example
Consider Karlstad Kakes, a manufacturer of specialty cakes, which has
recently obtained contract to supply a major supermarket chain with a specialty
cake in the shape of a space rocket. It has been decided that the volumes
required by the supermarket warrant a special production line to perform the
finishing, decorating and packing of the cake. This line would have to carry
out the elements shown in the next slide, which also shows the precedence
diagram for the total job. The initial order from the supermarket is for 5000
cakes a week and the number of hours worked by the factory is 40 per week.
From this:
The required cycle time = 40 hrs x 60 mins = 0.48 mins
5000
The required number of stages = 1.68 mins (total work content)
0.48 mins (required cycle time)
= 3.5 stages
© Nigel Slack, Stuart Chambers & Robert Johnston, 2004 Operations Management, 4E: Chapter 7
7.38 Element listing and precedence diagram
for Karlstad Kates
Element - - De-tin and trim 0.12 mins
a
Element - Reshape with off-cuts 0.30 mins
b
Element - Clad in almond fondant 0.36 mins
c
Element - Clad in white fondant 0.25 mins
d
Element - Decorate, red icing 0.17 mins
e
Element - Decorate, green icing 0.05 mins
f
Element - Decorate, blue icing 0.10 mins
g
Element - Affix transfers 0.08 mins
h
Element - Transfer to base and pack 0.25 mins
i
Total work content = 1.68 mins
a b c d
e
f g
h
i
0.12 mins
0.30 mins
0.36 mins
0.25 mins 0.05 mins
0.17 mins
0.10 mins
0.08 mins
0.25 mins
© Nigel Slack, Stuart Chambers & Robert Johnston, 2004 Operations Management, 4E: Chapter 7
7.39 Allocation of elements to stages and
balancing loss for Karlstad Kates
a b c d
e
f g
h
i
0.12 mins
0.30 mins
0.36 mins
0.25 mins 0.05 mins
0.17 mins
0.10 mins
0.08 mins
0.25 mins
Stage 1 Stage 2 Stage 3 Stage 4
0
0.1
0.2
0.3
0.4
0.5
0.6
1 2 3 4
Cycle time = 0.48 mins
Idle time every cycle = (0.48 - 0.42) + (0.48 - 0.36) + (0.48 - 0.42) = 0.24 mins
Proportion of idle time per cycle = 0.24 = 12.5%
4 x 0.48

3-layout-and-flow-141221065920-conversion-gate02.ppt

  • 1.
    © Nigel Slack,Stuart Chambers & Robert Johnston, 2004 Operations Management, 4E: Chapter 7 7.1 Layout and Flow
  • 2.
    © Nigel Slack,Stuart Chambers & Robert Johnston, 2004 Operations Management, 4E: Chapter 7 7.2 Chapter coverage • Basic layout types • Selecting a layout type • Detailed design of a layout
  • 3.
    © Nigel Slack,Stuart Chambers & Robert Johnston, 2004 Operations Management, 4E: Chapter 7 7.3 physical location of its transforming resources, that is deciding where to put the facilities, machines, equipment and staff in the operation. Layout types: 1) Fixed position layout 2) Process layout 3) Cell layout 4) Product layout
  • 4.
    © Nigel Slack,Stuart Chambers & Robert Johnston, 2004 Operations Management, 4E: Chapter 7 7.4 Fixed position layout 1) In a fixed position layout, the transformed resource does not move between its transforming resources. 2) Equipment, machinery, plant and people who do the processing move as necessary because the product or customer is either: i. Too large ii. Too delicate or iii. Objects being moved
  • 5.
    © Nigel Slack,Stuart Chambers & Robert Johnston, 2004 Operations Management, 4E: Chapter 7 7.5 Process layout 1) In a process layout, similar processes or processes with similar needs are located together because: i. It is convenient to group them together or ii. The utilization of the transforming resource is improved 2) Different products of customer have different requirements therefore they may take different routes within the process. 3) The flow in a process layout can be very complex.
  • 6.
    © Nigel Slack,Stuart Chambers & Robert Johnston, 2004 Operations Management, 4E: Chapter 7 7.6 An example of a process layout in a library showing the path of just one customer Entrance Exit On-line and CD-ROM access room Loan books in subject order Enquiries Store room Counter staff Copying area Company reports To journal sack Current journals Reserve collection Reference section Study desks
  • 7.
    © Nigel Slack,Stuart Chambers & Robert Johnston, 2004 Operations Management, 4E: Chapter 7 7.7 Cell layout 1) In a cell layout, the transformed resources entering the operation move into a cell in which all the transforming resources it requires in located. 2) After being processed in the cell, the transformed resource may move to a different cell in the operation or it may be a finished product or service. 3) Each cell may be arranged in either a process or product layout. 4) The cell type layout attempts to bring order to the complex flow seen in a process layout.
  • 8.
    © Nigel Slack,Stuart Chambers & Robert Johnston, 2004 Operations Management, 4E: Chapter 7 7.8 The ground floor plan of a department store showing the sports goods shop-within-a-shop retail ‘cell’ Sports shop Menswear Women’s clothes Luggage and gifts Confectionery, newspaper, magazines and stationery Books and videos Footwear Perfume & jewellery Elevators Entrance
  • 9.
    © Nigel Slack,Stuart Chambers & Robert Johnston, 2004 Operations Management, 4E: Chapter 7 7.9 Product layout 1) In a product layout, the transformed resource flow a long a line of processes that has been prearranged. 2) Flow is clear, predictable and easy to control.
  • 10.
    © Nigel Slack,Stuart Chambers & Robert Johnston, 2004 Operations Management, 4E: Chapter 7 7.10 An army induction centre with uses product layout Lecture theatre Uniform issuing area Uniform store Waiting area Waiting area Doctor Doctor Doctor Doctor Doctor Doctor Blood test Blood test Blood test X-ray X-ray X-ray Record personal history and medical details
  • 11.
    © Nigel Slack,Stuart Chambers & Robert Johnston, 2004 Operations Management, 4E: Chapter 7 7.11 A restaurant complex with all four basic layout types Fixed-position layout service restaurant Cell layout buffet Line layout cafeteria Cool room Freezer Vegetable prep Grill Preparation Oven Process layout kitchen Main course buffet Starter buffet Desert buffet Service line
  • 12.
    © Nigel Slack,Stuart Chambers & Robert Johnston, 2004 Operations Management, 4E: Chapter 7 7.12 Fixed-position layout Product layout Cell layout Process layout Volume Low High Variety Low High Flow is intermittent Regular flow more important Flow becomes continuous Regular flow more feasible Volume-variety relationship
  • 13.
    © Nigel Slack,Stuart Chambers & Robert Johnston, 2004 Operations Management, 4E: Chapter 7 7.13 Project process Jobbing process Batch process Mass process Continuous process Professional services Service shops Mass services Fixed position layout Process layout Cell layout Product layout The physical position of all transforming resources The flow of the operation’s transformed resources Process type Basic layout type Detailed design of layout Volume and variety Strategic performance objectives Decision 1 Decision 2 Decision 3 Layout selection steps
  • 14.
    © Nigel Slack,Stuart Chambers & Robert Johnston, 2004 Operations Management, 4E: Chapter 7 7.14 Selecting a layout type
  • 15.
    © Nigel Slack,Stuart Chambers & Robert Johnston, 2004 Operations Management, 4E: Chapter 7 7.15 1) The nature of the basic layout types Basic layout types Manufacturing process types Service process types Fixed position layout Project processes Process layout Cell layout Product layout Jobbing processes Batch processes Mass processes Continuous processes Professional services Service shops Mass services Project processes
  • 16.
    © Nigel Slack,Stuart Chambers & Robert Johnston, 2004 Operations Management, 4E: Chapter 7 7.16 2) Advantages and disadvantages Fixed position layout Process layout Cell layout Product layout Disadvantages Advantages - Very high mix and product flexibility - Product/customer not moved or disturbed. - Very high unit cost. - Scheduling space and activities can be difficult. - High mix and product flexibility - Relatively robust if in the case of disruptions Low utilization of resources. Can have very high WIP Complex flow. - Good compromise between cost and flexibility - Fast throughput. - Group work can result in good motivation Can be costly to rearrange existing layout Can need more plant and equipment Lo- w unit costs for high volume - Gives Opportunities for specialization of equipment Can have low mix and flexibility Not very robust to disruption Work can be very repetitive. - High variety of tasks for staff - Easy supervision of equipment of plant - Gives Opportunities for specialization of equipment
  • 17.
    © Nigel Slack,Stuart Chambers & Robert Johnston, 2004 Operations Management, 4E: Chapter 7 7.17 (a) The basic layout types have different fixed and variable cost characteristics which seem to determine which one to use. (b) In practice the uncertainty about the exact fixed and variable costs of each layout means the decision can rarely be made on cost alone Use fixed-position Use fixed-position or process Use process Use process or cell Use process or cell or product Use cell or product Use product Volume Costs Fixed-position Process Cell Product Volume Costs Use product Use cell Use process Use fixed- position (a) (b) ? ? ? ? 3) Consider total cost
  • 18.
    © Nigel Slack,Stuart Chambers & Robert Johnston, 2004 Operations Management, 4E: Chapter 7 7.18 Detailed design of a layout
  • 19.
    © Nigel Slack,Stuart Chambers & Robert Johnston, 2004 Operations Management, 4E: Chapter 7 7.19 Fixed position layout design: • The location of resources for each project is unique and it will be determined on the convenience of transforming resources themselves. • Although there are techniques which held to locate resources on fixed position layouts, they are not widely used because this layout can be very complex and planned schedules do change frequently.
  • 20.
    © Nigel Slack,Stuart Chambers & Robert Johnston, 2004 Operations Management, 4E: Chapter 7 7.20 Process layout design: • When cost of traveling is important: – Collecting information such as: • number of loads per day • cost per distance traveled • When process relationship is important – Relationship chart
  • 21.
    © Nigel Slack,Stuart Chambers & Robert Johnston, 2004 Operations Management, 4E: Chapter 7 7.21 Collecting information in process layout If direction is not important, collapses to A B C D E A 30 60 20 B 30 30 C 80 D 40 E LOADS/DAY (b) To From A B C D E A 17 30 10 B 13 20 20 C 10 70 D 30 30 E 10 10 10 10 LOADS/DAY (a)
  • 22.
    © Nigel Slack,Stuart Chambers & Robert Johnston, 2004 Operations Management, 4E: Chapter 7 7.22 Collecting information in process layout Or alternatively A B C D E A 30 60 20 B 30 30 C 80 D 40 E LOADS/DAY (c) LOADS/DAY (d) A B C D E 30 30 - 40 - - 80 60 30 20
  • 23.
    © Nigel Slack,Stuart Chambers & Robert Johnston, 2004 Operations Management, 4E: Chapter 7 7.23 Collecting information in process layout To From A B C D E A 17 30 10 B 13 20 20 C 10 70 D 30 30 E 10 10 10 10 If cost of flow differs between work centers, combine with LOADS/DAY To From A B C D E A 2 2 2 2 B 3 3 3 4 C 2 2 2 2 D 10 10 10 10 E 2 2 2 2 UNIT COST/DISTANCE TRAVELLED (e) (f)
  • 24.
    © Nigel Slack,Stuart Chambers & Robert Johnston, 2004 Operations Management, 4E: Chapter 7 7.24 Collecting information in process layout To give To From A B C D E A 34 60 20 B 39 60 60 C 20 140 D 300 300 E 20 20 20 20 DAILY COST/DISTANCE TRAVELLED (g)
  • 25.
    © Nigel Slack,Stuart Chambers & Robert Johnston, 2004 Operations Management, 4E: Chapter 7 7.25 Collecting information in process layout If direction is not important, collapses to To From A B C D E A 34 60 20 B 39 60 60 C 20 140 D 300 300 E 20 20 20 20 DAILY COST/DISTANCE TRAVELLED (h) A B C D E A 73 360 40 B 80 80 C 160 D 320 E DAILY COST/DISTANCE TRAVELLED (i)
  • 26.
    © Nigel Slack,Stuart Chambers & Robert Johnston, 2004 Operations Management, 4E: Chapter 7 7.26 A relationship chart CODE CLOSENESS A Absolutely necessa ry E Especially important I Important O Ordinary closeness U Unimportant X Undesirable X Metrology Electronic testing Analysis Ultrasonic testing Fatigue testing E I I I A U O O U X DEPARTMENT Impact testing E O U U X
  • 27.
    © Nigel Slack,Stuart Chambers & Robert Johnston, 2004 Operations Management, 4E: Chapter 7 7.27 Cell layout design 1) Cells in an operation can be created based on two interrelated decisions: 1) What is the extent and nature of the cell i.e. the amount of direct and indirect resources the cell has as shown in Fig 7.28 2) Which resources to allocate to which cell using: i. Cluster analysis – which process group naturally together ii. Parts and family coding – based on similar characteristics of parts of products OR 2) Production Flow Analysis (PFA) Examines both product requirement and process grouping (See Fig. 7.31)
  • 28.
    © Nigel Slack,Stuart Chambers & Robert Johnston, 2004 Operations Management, 4E: Chapter 7 7.28 Types of cell High High Low Low Complete component manufacturing cell Lunch and snack produce area in supermarket Small multi-machine manufacturing cell Joint reference and copying room in a library Plant-within-a-plant manufacturing operation Maternity unit in a hospital Specialist process manufacturing cell Internal audit group in a bank Amount of indirect resources included in the cell Proportion of the resources needed to complete the transformation included in the cell e.g. e.g. e.g. e.g.
  • 29.
    © Nigel Slack,Stuart Chambers & Robert Johnston, 2004 Operations Management, 4E: Chapter 7 7.29 1 2 3 4 5 6 7 8 1 X X 2 X X X 3 X X X 4 X X X 5 X X X 6 X X 7 X X 8 X X X (a) and (b) Using production flow analysis to allocate machines to cells Product Machines 3 6 8 5 2 4 1 8 4 X X X 1 X X 6 X X 3 X X X 8 X X 2 X X X 5 X X X 7 X X Product Machines Cell A Cell B Cell C (a) (b)
  • 30.
    © Nigel Slack,Stuart Chambers & Robert Johnston, 2004 Operations Management, 4E: Chapter 7 7.30 Product layout design 1) Product type layout is designed based on a technique called line balancing. The technique consist of the following steps: 1) Calculating the required cycle time. 2) Calculating the number of stages. 3) Producing a precedence diagram. 4) Finally allocating activities to the stages.
  • 31.
    © Nigel Slack,Stuart Chambers & Robert Johnston, 2004 Operations Management, 4E: Chapter 7 7.31 Cycle time: It is the time between completed products emerging from the process. Example: Suppose the regional back-office operation of a large bank is designing an operation which will process its mortgage applications. The number of applications to be processed is 160 per week and the time available to process the applications is 40 hours per week. Cycle time = 40 = 1/4 hours = 15 minutes 160 1 product every 15 minutes
  • 32.
    © Nigel Slack,Stuart Chambers & Robert Johnston, 2004 Operations Management, 4E: Chapter 7 7.32 Number of stages Required no. of stages = total work content required cycle time Where the total work content is the total quantity of work involved in producing the product given in time. Example: Suppose that the bank in the previous example calculated that the average total work content of processing a mortgage application is 60 minutes. The number of stages needed to produce a processed application every 15 minutes can be calculated Required no. of stages = 60 minutes = 4 stages 15 minutes If you get a fraction round it up to the higher whole number.
  • 33.
    © Nigel Slack,Stuart Chambers & Robert Johnston, 2004 Operations Management, 4E: Chapter 7 7.33 Precedence diagram This is a diagram representing the ordering of the elements which comprise the total work content of the product or service. Two rules when constructing the diagram: 1. The circles which represent the elements are drawn as far to the left as possible. 2. None of the arrows which shows the precedence of the elements should be vertical. a b c d e f g h i 0.12 mins 0.30 mins 0.36 mins 0.25 mins 0.05 mins 0.17 mins 0.10 mins 0.08 mins 0.25 mins
  • 34.
    © Nigel Slack,Stuart Chambers & Robert Johnston, 2004 Operations Management, 4E: Chapter 7 7.34 Allocating activities to the stages The general approach is to allocate elements from the precedence diagram to the first stage, starting from the left, until the work allocated to the stage is as close to, but less than, the cycle time. When the stage is full of work without exceeding the cycle time, move to the next stage. Two rules help to decide which activities to allocate to a stage: 1. Choose the largest that will fit into the time remaining at the stage 2. Choose the element with the most ‘followers’.
  • 35.
    © Nigel Slack,Stuart Chambers & Robert Johnston, 2004 Operations Management, 4E: Chapter 7 7.35 Balancing loss The effectiveness of the line balancing activity is measured by the balancing loss. This is the time wasted through the unequal allocation of work as a percentage of the total time invested in processing the product or service. Balancing loss = Total idle time No. of stages x Cycle time
  • 36.
    © Nigel Slack,Stuart Chambers & Robert Johnston, 2004 Operations Management, 4E: Chapter 7 7.36 Balancing loss is that proportion of the time invested in processing the product or service which is not used productively 0 0.5 1 1.5 2 2.5 3 1 2 3 4 Load Stage Cycle time = 2.5 mins 0 0.5 1 1.5 2 2.5 3 3.5 1 2 3 4 Load Stage Cycle time = 3.0 mins 2.3 2.5 2.2 3.0 An ideal ‘balance’ where work is allocated equally between the stages But if work is not equally allocated the cycle time will increase and ‘balancing losses’ will occur Work allocated to stage Idle time Calculating balancing loss: Idle time every cycle =(3.0 - 2.3) + (3.0 - 2.5) + (3.0 - 2.2) = 2.0 mins Balancing loss = 2 4 x 3.0 = 0.1667 = 16.67%
  • 37.
    © Nigel Slack,Stuart Chambers & Robert Johnston, 2004 Operations Management, 4E: Chapter 7 7.37 Worked Example Consider Karlstad Kakes, a manufacturer of specialty cakes, which has recently obtained contract to supply a major supermarket chain with a specialty cake in the shape of a space rocket. It has been decided that the volumes required by the supermarket warrant a special production line to perform the finishing, decorating and packing of the cake. This line would have to carry out the elements shown in the next slide, which also shows the precedence diagram for the total job. The initial order from the supermarket is for 5000 cakes a week and the number of hours worked by the factory is 40 per week. From this: The required cycle time = 40 hrs x 60 mins = 0.48 mins 5000 The required number of stages = 1.68 mins (total work content) 0.48 mins (required cycle time) = 3.5 stages
  • 38.
    © Nigel Slack,Stuart Chambers & Robert Johnston, 2004 Operations Management, 4E: Chapter 7 7.38 Element listing and precedence diagram for Karlstad Kates Element - - De-tin and trim 0.12 mins a Element - Reshape with off-cuts 0.30 mins b Element - Clad in almond fondant 0.36 mins c Element - Clad in white fondant 0.25 mins d Element - Decorate, red icing 0.17 mins e Element - Decorate, green icing 0.05 mins f Element - Decorate, blue icing 0.10 mins g Element - Affix transfers 0.08 mins h Element - Transfer to base and pack 0.25 mins i Total work content = 1.68 mins a b c d e f g h i 0.12 mins 0.30 mins 0.36 mins 0.25 mins 0.05 mins 0.17 mins 0.10 mins 0.08 mins 0.25 mins
  • 39.
    © Nigel Slack,Stuart Chambers & Robert Johnston, 2004 Operations Management, 4E: Chapter 7 7.39 Allocation of elements to stages and balancing loss for Karlstad Kates a b c d e f g h i 0.12 mins 0.30 mins 0.36 mins 0.25 mins 0.05 mins 0.17 mins 0.10 mins 0.08 mins 0.25 mins Stage 1 Stage 2 Stage 3 Stage 4 0 0.1 0.2 0.3 0.4 0.5 0.6 1 2 3 4 Cycle time = 0.48 mins Idle time every cycle = (0.48 - 0.42) + (0.48 - 0.36) + (0.48 - 0.42) = 0.24 mins Proportion of idle time per cycle = 0.24 = 12.5% 4 x 0.48