Downloaded 151 times
![UNDERSTANDING PERFORMANCE KPIS…
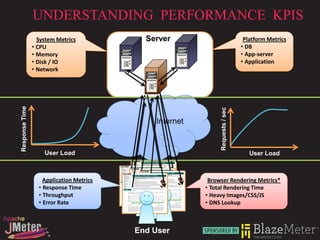
Response Time Throughput
DB
Inter Response Time
Web App
Server
net Server
Server
DB
Server
Total Response Time = Throughput =
Network latency + Application latency + [TRANSACTIONS] / Second
Browser Rendering Time
•Measured from the end-user perspective •Transactions are specific to applications
•Time taken to completely respond to request •In its simplest form, it is requests / sec
•TTLB TTFB
Error
•Defined in terms of the success of the request
•Error at HTTP level (404, 501)
•Application level error](https://image.slidesharecdn.com/blazemetereffectiveperformancereporting-120812080904-phpapp02/85/BlazeMeter-Effective-Performance-Reporting-7-320.jpg)
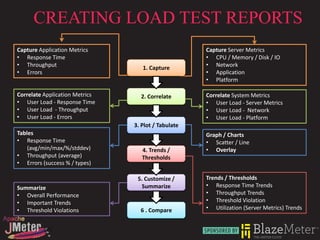

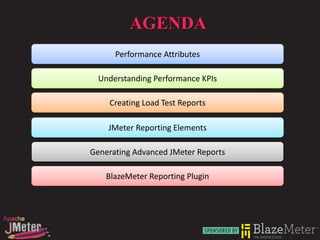
The document discusses effective performance reporting using Apache JMeter, focusing on performance attributes, key performance indicators (KPIs), and creating load test reports. It outlines various metrics to capture, correlate, and visualize, as well as advanced reporting options including the BlazeMeter reporting plugin. Overall, the document serves as a guide for load testing and performance evaluation to ensure applications can handle user loads efficiently and reliably.