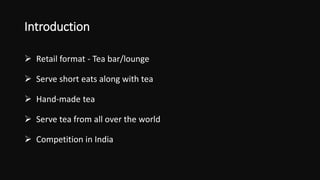
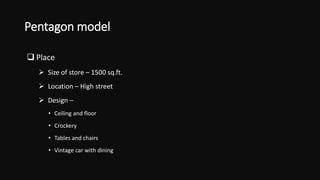
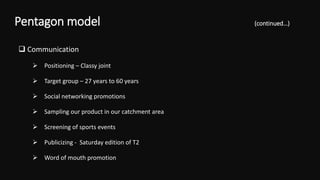
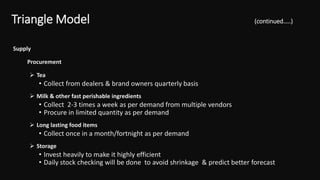
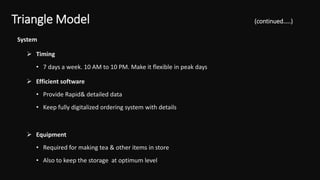
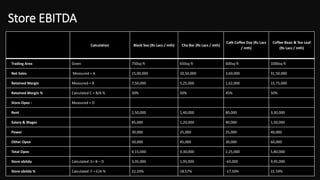
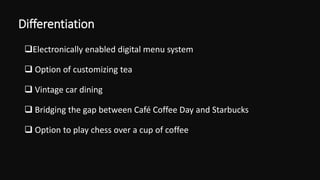
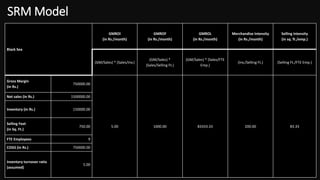
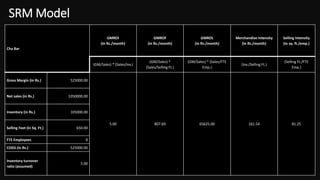
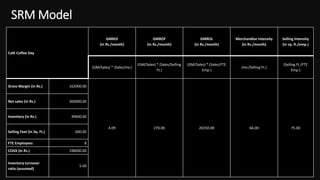
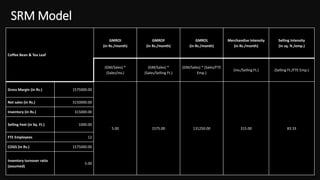
Black Sea We serve Art
Presented by :
Abhijit Dey
Anirban Ghosh
Aswini Sahu
Gaurav Bhattacherjee
Mohd. Umair Athar
Shayan Alam
Agenda
 Introduction
 Pentagon model
 Triangle model
 Store EBITDA model
 Differentiation
 Cost leadership strategy
 Strategic resource management model
Introduction
 Retail format - Tea bar/lounge
 Serve short eats along with tea
 Hand-made tea
 Serve tea from all over the world
 Competition in India
Pentagon model
 Place
 Size of store – 1500 sq.ft.
 Location – High street
 Design –
• Ceiling and floor
• Crockery
• Tables and chairs
• Vintage car with dining
 Layout
Pentagon model (continued…)
 Product
 Menu
• Variants of tea beverages
• Single item snacks
• Combo meals
• Customized tea
 Miscellaneous offerings
• Best-selling books section
• Games – scrabble, chess etc.
Pentagon model (continued…)
 People
 Touch screen enabled digital menu system
 Training – Waiter cum store manager
 Hospitality
 Payback loyalty card
Pentagon model (continued…)
 Value
 Strict quality standards
 Price range of products
 Black Sea Premium card system
Pentagon model (continued…)
 Communication
 Positioning – Classy joint
 Target group – 27 years to 60 years
 Social networking promotions
 Sampling our product in our catchment area
 Screening of sports events
 Publicizing - Saturday edition of T2
 Word of mouth promotion
Triangle Model
Logistics
 Limited requirement
 In-store warehouse
 Ask vendor to deliver at store
Supply
Procurement
 Tea
• Collect from dealers & brand owners quarterly basis
 Milk & other fast perishable ingredients
• Collect 2-3 times a week as per demand from multiple vendors
• Procure in limited quantity as per demand
 Long lasting food items
• Collect once in a month/fortnight as per demand
 Storage
• Invest heavily to make it highly efficient
• Daily stock checking will be done to avoid shrinkage & predict better forecast
Triangle Model (continued…..)
System
 Timing
• 7 days a week. 10 AM to 10 PM. Make it flexible in peak days
 Efficient software
• Provide Rapid& detailed data
• Keep fully digitalized ordering system with details
 Equipment
• Required for making tea & other items in store
• Also to keep the storage at optimum level
Triangle Model (continued…..)
Store EBITDA
Calculation Black Sea (Rs Lacs / mth) Cha Bar (Rs Lacs / mth)
Café Coffee Day (Rs Lacs
/ mth)
Coffee Bean & Tea Leaf
(Rs Lacs / mth)
Trading Area Given 750sq ft 650sq ft 600sq ft 1000sq ft
Net Sales Measured = A 15,00,000 10,50,000 3,60,000 31,50,000
Retained Margin Measured = B 7,50,000 5,25,000 1,62,000 15,75,000
Retained Margin % Calculated C = B/A % 50% 50% 45% 50%
Store Opex : Measured = D
Rent 2,50,000 1,40,000 80,000 3,30,000
Salary & Wages 85,000 1,20,000 90,000 1,50,000
Power 30,000 25,000 25,000 40,000
Other Opex 50,000 45,000 30,000 60,000
Total Opex 4,15,000 3,30,000 2,25,000 5,80,000
Store ebitda Calculated E= B – D 3,35,000 1,95,000 -63,000 9,95,000
Store ebitda % Calculated F = E/A % 22.33% 18.57% -17.50% 31.59%
Differentiation
Electronically enabled digital menu system
 Option of customizing tea
 Vintage car dining
 Bridging the gap between Café Coffee Day and Starbucks
 Option to play chess over a cup of coffee
Cost Leadership
 High Asset Turnover
 One of the area of focus
 Operational costs
 Giving maximum importance
 Value chain
 Not focusing over here at now
Aiming to be cost focus company
SRM Model
Black Sea
GMROI
(in Rs./month)
GMROF
(in Rs./month)
GMROL
(in Rs./month)
Merchandise Intensity
(in Rs./month)
Selling Intensity
(in sq. ft./emp.)
(GM/Sales) * (Sales/Inv.)
(GM/Sales) *
(Sales/Selling Ft.)
(GM/Sales) * (Sales/FTE
Emp.)
(Inv./Selling Ft.) (Selling Ft./FTE Emp.)
Gross Margin
(in Rs.)
750000.00
5.00 1000.00 83333.33 200.00 83.33
Net sales (in Rs.) 1500000.00
Inventory (in Rs.) 150000.00
Selling Feet
(in Sq. Ft.)
750.00
FTE Employees 9
COGS (in Rs.) 750000.00
Inventory turnover ratio
(assumed)
5.00
SRM Model
Cha Bar
GMROI
(in Rs./month)
GMROF
(in Rs./month)
GMROL
(in Rs./month)
Merchandise Intensity
(in Rs./month)
Selling Intensity
(in sq. ft./emp.)
(GM/Sales) * (Sales/Inv.)
(GM/Sales) *
(Sales/Selling Ft.)
(GM/Sales) * (Sales/FTE
Emp.)
(Inv./Selling Ft.)
(Selling Ft./FTE
Emp.)
Gross Margin (in Rs.) 525000.00
5.00 807.69 65625.00 161.54 81.25
Net sales (in Rs.) 1050000.00
Inventory (in Rs.) 105000.00
Selling Feet (in Sq. Ft.) 650.00
FTE Employees 8
COGS (in Rs.) 525000.00
Inventory turnover
ratio (assumed)
5.00
SRM Model
Café Coffee Day
GMROI
(in Rs./month)
GMROF
(in Rs./month)
GMROL
(in Rs./month)
Merchandise Intensity
(in Rs./month)
Selling Intensity
(in sq. ft./emp.)
(GM/Sales) * (Sales/Inv.)
(GM/Sales) * (Sales/Selling
Ft.)
(GM/Sales) * (Sales/FTE
Emp.)
(Inv./Selling Ft.)
(Selling Ft./FTE
Emp.)
Gross Margin (in Rs.) 162000.00
4.09 270.00 20250.00 66.00 75.00
Net sales (in Rs.) 360000.00
Inventory (in Rs.) 39600.00
Selling Feet (in Sq. Ft.) 600.00
FTE Employees 8
COGS (in Rs.) 198000.00
Inventory turnover
ratio (assumed)
5.00
SRM Model
Coffee Bean & Tea Leaf
GMROI
(in Rs./month)
GMROF
(in Rs./month)
GMROL
(in Rs./month)
Merchandise Intensity
(in Rs./month)
Selling Intensity
(in sq. ft./emp.)
(GM/Sales) *
(Sales/Inv.)
(GM/Sales) *
(Sales/Selling Ft.)
(GM/Sales) * (Sales/FTE
Emp.)
(Inv./Selling Ft.) (Selling Ft./FTE Emp.)
Gross Margin (in Rs.) 1575000.00
5.00 1575.00 131250.00 315.00 83.33
Net sales (in Rs.) 3150000.00
Inventory (in Rs.) 315000.00
Selling Feet (in Sq. Ft.) 1000.00
FTE Employees 12
COGS (in Rs.) 1575000.00
Inventory turnover ratio
(assumed)
5.00
THANK YOU…

Black Sea

  • 1.
    Black Sea Weserve Art Presented by : Abhijit Dey Anirban Ghosh Aswini Sahu Gaurav Bhattacherjee Mohd. Umair Athar Shayan Alam
  • 2.
    Agenda  Introduction  Pentagonmodel  Triangle model  Store EBITDA model  Differentiation  Cost leadership strategy  Strategic resource management model
  • 3.
    Introduction  Retail format- Tea bar/lounge  Serve short eats along with tea  Hand-made tea  Serve tea from all over the world  Competition in India
  • 4.
    Pentagon model  Place Size of store – 1500 sq.ft.  Location – High street  Design – • Ceiling and floor • Crockery • Tables and chairs • Vintage car with dining
  • 5.
  • 6.
     Product  Menu •Variants of tea beverages • Single item snacks • Combo meals • Customized tea  Miscellaneous offerings • Best-selling books section • Games – scrabble, chess etc. Pentagon model (continued…)
  • 7.
     People  Touchscreen enabled digital menu system  Training – Waiter cum store manager  Hospitality  Payback loyalty card Pentagon model (continued…)
  • 8.
     Value  Strictquality standards  Price range of products  Black Sea Premium card system Pentagon model (continued…)
  • 9.
    Pentagon model (continued…) Communication  Positioning – Classy joint  Target group – 27 years to 60 years  Social networking promotions  Sampling our product in our catchment area  Screening of sports events  Publicizing - Saturday edition of T2  Word of mouth promotion
  • 10.
    Triangle Model Logistics  Limitedrequirement  In-store warehouse  Ask vendor to deliver at store
  • 11.
    Supply Procurement  Tea • Collectfrom dealers & brand owners quarterly basis  Milk & other fast perishable ingredients • Collect 2-3 times a week as per demand from multiple vendors • Procure in limited quantity as per demand  Long lasting food items • Collect once in a month/fortnight as per demand  Storage • Invest heavily to make it highly efficient • Daily stock checking will be done to avoid shrinkage & predict better forecast Triangle Model (continued…..)
  • 12.
    System  Timing • 7days a week. 10 AM to 10 PM. Make it flexible in peak days  Efficient software • Provide Rapid& detailed data • Keep fully digitalized ordering system with details  Equipment • Required for making tea & other items in store • Also to keep the storage at optimum level Triangle Model (continued…..)
  • 13.
    Store EBITDA Calculation BlackSea (Rs Lacs / mth) Cha Bar (Rs Lacs / mth) Café Coffee Day (Rs Lacs / mth) Coffee Bean & Tea Leaf (Rs Lacs / mth) Trading Area Given 750sq ft 650sq ft 600sq ft 1000sq ft Net Sales Measured = A 15,00,000 10,50,000 3,60,000 31,50,000 Retained Margin Measured = B 7,50,000 5,25,000 1,62,000 15,75,000 Retained Margin % Calculated C = B/A % 50% 50% 45% 50% Store Opex : Measured = D Rent 2,50,000 1,40,000 80,000 3,30,000 Salary & Wages 85,000 1,20,000 90,000 1,50,000 Power 30,000 25,000 25,000 40,000 Other Opex 50,000 45,000 30,000 60,000 Total Opex 4,15,000 3,30,000 2,25,000 5,80,000 Store ebitda Calculated E= B – D 3,35,000 1,95,000 -63,000 9,95,000 Store ebitda % Calculated F = E/A % 22.33% 18.57% -17.50% 31.59%
  • 14.
    Differentiation Electronically enabled digitalmenu system  Option of customizing tea  Vintage car dining  Bridging the gap between Café Coffee Day and Starbucks  Option to play chess over a cup of coffee
  • 15.
    Cost Leadership  HighAsset Turnover  One of the area of focus  Operational costs  Giving maximum importance  Value chain  Not focusing over here at now Aiming to be cost focus company
  • 16.
    SRM Model Black Sea GMROI (inRs./month) GMROF (in Rs./month) GMROL (in Rs./month) Merchandise Intensity (in Rs./month) Selling Intensity (in sq. ft./emp.) (GM/Sales) * (Sales/Inv.) (GM/Sales) * (Sales/Selling Ft.) (GM/Sales) * (Sales/FTE Emp.) (Inv./Selling Ft.) (Selling Ft./FTE Emp.) Gross Margin (in Rs.) 750000.00 5.00 1000.00 83333.33 200.00 83.33 Net sales (in Rs.) 1500000.00 Inventory (in Rs.) 150000.00 Selling Feet (in Sq. Ft.) 750.00 FTE Employees 9 COGS (in Rs.) 750000.00 Inventory turnover ratio (assumed) 5.00
  • 17.
    SRM Model Cha Bar GMROI (inRs./month) GMROF (in Rs./month) GMROL (in Rs./month) Merchandise Intensity (in Rs./month) Selling Intensity (in sq. ft./emp.) (GM/Sales) * (Sales/Inv.) (GM/Sales) * (Sales/Selling Ft.) (GM/Sales) * (Sales/FTE Emp.) (Inv./Selling Ft.) (Selling Ft./FTE Emp.) Gross Margin (in Rs.) 525000.00 5.00 807.69 65625.00 161.54 81.25 Net sales (in Rs.) 1050000.00 Inventory (in Rs.) 105000.00 Selling Feet (in Sq. Ft.) 650.00 FTE Employees 8 COGS (in Rs.) 525000.00 Inventory turnover ratio (assumed) 5.00
  • 18.
    SRM Model Café CoffeeDay GMROI (in Rs./month) GMROF (in Rs./month) GMROL (in Rs./month) Merchandise Intensity (in Rs./month) Selling Intensity (in sq. ft./emp.) (GM/Sales) * (Sales/Inv.) (GM/Sales) * (Sales/Selling Ft.) (GM/Sales) * (Sales/FTE Emp.) (Inv./Selling Ft.) (Selling Ft./FTE Emp.) Gross Margin (in Rs.) 162000.00 4.09 270.00 20250.00 66.00 75.00 Net sales (in Rs.) 360000.00 Inventory (in Rs.) 39600.00 Selling Feet (in Sq. Ft.) 600.00 FTE Employees 8 COGS (in Rs.) 198000.00 Inventory turnover ratio (assumed) 5.00
  • 19.
    SRM Model Coffee Bean& Tea Leaf GMROI (in Rs./month) GMROF (in Rs./month) GMROL (in Rs./month) Merchandise Intensity (in Rs./month) Selling Intensity (in sq. ft./emp.) (GM/Sales) * (Sales/Inv.) (GM/Sales) * (Sales/Selling Ft.) (GM/Sales) * (Sales/FTE Emp.) (Inv./Selling Ft.) (Selling Ft./FTE Emp.) Gross Margin (in Rs.) 1575000.00 5.00 1575.00 131250.00 315.00 83.33 Net sales (in Rs.) 3150000.00 Inventory (in Rs.) 315000.00 Selling Feet (in Sq. Ft.) 1000.00 FTE Employees 12 COGS (in Rs.) 1575000.00 Inventory turnover ratio (assumed) 5.00
  • 20.