1. This chapter introduces public sector projects and their economic evaluation, where the owners and users are citizens rather than private customers or clients.
2. Public sector projects have longer lifetimes, larger investments, and lower interest rates than private sector projects. Their costs, benefits, and potential disbenefits must be estimated.
3. The benefit-cost ratio was developed to introduce objectivity to economic analysis of public sector projects by reducing the effects of politics and special interests, though there is always disagreement about how to define and value benefits.
Comparing alternatives in Engineering Economics and ManagementNzar Braim
Comparing alternatives in Engineering Economics and Management
In the real world, the majority of engineering economic analysis problems are
alternative comparisons. In these problems, two or more mutually exclusive
investments compete for limited funds. A variety of methods exists for selecting
the superior alternative from a group of proposals. Each method has its own merits
and applications
With the increase in public debt, 100% privately funded initiatives are now re-emerging yet experience had shown earlier that early successes of privatization programs were short lived and led later to bailouts / subsidy by Governments. PPP,s are likely to remain a better way to allocate the risks based on each entity’s ability to manage , mitigate and absorb risks. This brief highlights various aspects of PPP’s in terms of explaining the various PPP’s models and PPP’s transactions types, fiscal risks in PPP’s, PPP’s best practices and how to create an enabling PPP Environment. Major MENA PPP’s projects preview of is highlighted.
Connecting global & regional finance to projects - Finance for #SDGs High Level Meeting – #financeforSDGs – Christoph Waldersee – Bellagio – 25-27 February 2015
Presented at the 4th Global Infrastructure Basel Summit 21 & 22 May 2014. Read more at www.gib-foundation.org.
Next Summit: 27 & 28 May 2015 in Switzerland
Infrastructure whether financed through traditional methods or PPPs relies on funding sources to repay financing, whether debt, equity, or a combination. All infrastructure investments ultimately depend on either user fees, government tax revenues, or a combination of both. Transport has a great impact on economic growth and poverty alleviation.
Therefore, community and political support for greater investment of government tax revenues or the imposition of user fees is critical to expanding investment in public infrastructure. The challenge is for PPPs to demonstrate overall cost savings and efficiencies that outweigh the lower-cost financing advantage of traditional procurement.
Creation of Infrastructure has economics both of scale and scope (i.e., minimum size of facilities, inelastic adjustment of capacity to demand, long term project completion, etc..
1. MASTER ➀
Benefit/Cost Analysis
and Public Sector
Economics
The evaluation methods of previous chapters are usually applied to alterna-
tives in the private sector, that is, for-profit and not-for-profit corporations and
businesses. Customers, clients, and employees utilize the installed alter-
natives. This chapter introduces public sector alternatives and their economic
consideration. Here the owners and users (beneficiaries) are the citizens of the
government unit—city, county, state, province, or nation. Government units
provide the mechanisms to raise (investment) capital and operating funds for
projects through taxes, user fees, bond issues, and loans. There are substan-
tial differences in the characteristics of public and private sector alternatives
and their economic evaluation, as outlined in the first section. Partnerships of
the public and private sector have become increasingly common, especially
for large infrastructure construction such as major highways, power genera-
tion plants, water resource projects, and the like.
The benefit/cost (B/C) ratio was developed, in part, to introduce objectiv-
ity into the economic analysis of public sector evaluation, thus reducing the
effects of politics and special interests. However, there is always predictable
disagreement among citizens (individuals and groups) about how the bene-
fits of an alternative are defined and economically valued. The different
formats of B/C analysis, and associated disbenefits of an alternative, are
discussed here. The B/C analysis can use equivalency computations based
on PW, AW, or FW values. Performed correctly, the benefit/cost method will
always select the same alternative as PW, AW, and ROR analyses.
A public sector project to enhance freeway lighting is the subject of the
case study.
CHAPTER
9
bla18632_ch09.qxd 08/20/2004 5:44 PM Page 312
2. MASTER ➀
Purpose: Understand public sector economics; evaluate a project and compare alternatives
using the benefit/cost ratio method.
Multiple alternatives
Alternative selection
B/C for single project
Public sector
LEARNING OBJECTIVES
This chapter will help you:
1. Identify fundamental differences between public and private
sector economic alternatives.
2. Use the benefit/cost ratio to evaluate a single project.
3. Select the better of two alternatives using the incremental
B/C ratio method.
4. Select the best from multiple alternatives using the
incremental B/C method.
bla18632_ch09.qxd 08/20/2004 5:44 PM Page 313
3. 9.1 PUBLIC SECTOR PROJECTS
Public sector projects are owned, used, and financed by the citizenry of any gov-
ernment level, whereas projects in the private sector are owned by corporations,
partnerships, and individuals. The products and services of private sector proj-
ects are used by individual customers and clients. Virtually all the examples in
previous chapters have been from the private sector. Notable exceptions occur
in Chapters 5 and 6 where capitalized cost was introduced as an extension to
PW analysis for long-life alternatives and perpetual investments.
Public sector projects have a primary purpose to provide services to the citi-
zenry for the public good at no profit. Areas such as health, safety, economic
welfare, and utilities comprise a majority of alternatives that require engineering
economic analysis. Some public sector examples are
Hospitals and clinics Transportation: highways, bridges,
Parks and recreation waterways
Utilities: water, electricity, gas, Police and fire protection
sewer, sanitation Courts and prisons
Schools: primary, secondary, Food stamp and rent relief programs
community colleges, universities Job training
Economic development Public housing
Convention centers Emergency relief
Sports arenas Codes and standards
There are significant differences in the characteristics of private and public sector
alternatives.
Characteristic Public sector Private sector
Often alternatives developed to serve public needs require large initial invest-
ments, possibly distributed over several years. Modern highways, public trans-
portation systems, airports, and flood control systems are examples.
The long lives of public projects often prompt the use of the capitalized cost
method, where infinity is used for n and annual costs are calculated as A ϭ P(i).
As n gets larger, especially over 30 years, the differences in calculated A values
become small. For example, at i ϭ 7%, there will be a very small difference in
30 and 50 years, because (A͞P,7%,30) ϭ 0.08059 and (A͞P,7%,50) ϭ 0.07246.
Annual cash flow No profit; costs, benefits, Revenues contribute
estimates and disbenefits, are estimated to profits; costs are estimated
Life estimates Longer (30–50ϩ years) Shorter (2–25 years)
Size of investment Larger Some large; more medium to small
314 CHAPTER 9 Benefit/Cost Analysis and Public Sector Economics
MASTER ➀
Capitalized cost
Sec. 6.4
Sec. 5.5
bla18632_ch09.qxd 08/20/2004 5:44 PM Page 314
4. Public sector projects (also called publicly-owned) do not have profits; they do
have costs that are paid by the appropriate government unit; and they benefit the
citizenry. Public sector projects often have undesirable consequences, as stated
by some portion of the public. It is these consequences that can cause public con-
troversy about the projects. The economic analysis should consider these conse-
quences in monetary terms to the degree estimable. (Often in private sector
analysis, undesirable consequences are not considered, or they may be directly
addressed as costs.) To perform an economic analysis of public alternatives, the
costs (initial and annual), the benefits, and the disbenefits, if considered, must be
estimated as accurately as possible in monetary units.
Costs—estimated expenditures to the government entity for construction,
operation, and maintenance of the project, less any expected salvage value.
Benefits—advantages to be experienced by the owners, the public.
Disbenefits—expected undesirable or negative consequences to the owners
if the alternative is implemented. Disbenefits may be indirect economic
disadvantages of the alternative.
The following is important to realize:
It is difficult to estimate and agree upon the economic impact of benefits
and disbenefits for a public sector alternative.
For example, assume a short bypass around a congested area in town is recom-
mended. How much will it benefit a driver in dollars per driving minute to be
able to bypass five traffic lights while averaging 35 miles per hour, as compared
to currently driving through the lights averaging 20 miles per hour and stopping
at an average of two lights for an average of 45 seconds each? The bases and
standards for benefits estimation are always difficult to establish and verify. Rel-
ative to revenue cash flow estimates in the private sector, benefit estimates are
much harder to make, and vary more widely around uncertain averages. And the
disbenefits that accrue from an alternative are harder to estimate. In fact, the dis-
benefit itself may not be known at the time the evaluation is performed.
The capital used to finance public sector projects is commonly acquired from
taxes, bonds, and fees. Taxes are collected from those who are the owners—the
citizens (e.g., federal gasoline taxes for highways are paid by all gasoline users).
This is also the case for fees, such as toll road fees for drivers. Bonds are often
issued: U.S. Treasury bonds, municipal bond issues, and special-purpose bonds,
such as utility district bonds. Private lenders can provide up-front financing.
Also, private donors may provide funding for museums, memorials, parks, and
garden areas through gifts.
Interest rate Lower Higher, based on market cost of capital
Funding Taxes, fees, bonds, private funds Stocks, bonds, loans,
individual owners
SECTION 9.1 Public Sector Projects 315
MASTER ➀
Bonds
Sec. 5.8
bla18632_ch09.qxd 08/20/2004 5:44 PM Page 315
5. MASTER ➀
316 CHAPTER 9 Benefit/Cost Analysis and Public Sector Economics
Because many of the financing methods for public sector projects are classified as
low-interest, the interest rate is virtually always lower than for private sector alter-
natives. Government agencies are exempt from taxes levied by higher-level units.
For example, municipal projects do not have to pay state taxes. (Private corpora-
tions and individual citizens do pay taxes.) Many loans are very low-interest, and
grants with no repayment requirement from federal programs may share project
costs. This results in interest rates in the 4 to 8% range. It is common that a govern-
ment agency will direct that all projects be evaluated at a specific rate. For example,
the U.S. Office of Management and Budget (OMB) declared at one time that fed-
eral projects should be evaluated at 10% (with no inflation adjustment). As a mat-
ter of standardization, directives to use a specific interest rate are beneficial because
different government agencies are able to obtain varying types of funding at differ-
ent rates. This can result in projects of the same type being rejected in one city or
county, but accepted in a neighboring district. Therefore, standardized rates tend to
increase the consistency of economic decisions and to reduce gamesmanship.
The determination of the interest rate for public sector evaluation is as impor-
tant as the determination of the MARR for a private sector analysis. The public
sector interest rate is identified as i; however, it is referred to by other names to
distinguish it from the private sector rate. The most common terms are discount
rate and social discount rate.
Multiple categories of users, economic as well as noneconomic interests, and
special-interest political and citizen groups make the selection of one alternative
over another much more difficult in public sector economics. Seldom is it possi-
ble to select an alternative on the sole basis of a criterion such as PW or ROR. It
is important to describe and itemize the criteria and selection method prior to the
analysis. This helps determine the perspective or viewpoint when the evaluation
is performed. Viewpoint is discussed below.
There are often public meetings and debates associated with public sector proj-
ects to accommodate the various interests of citizens (owners). Elected officials
commonly assist with the selection, especially when pressure is brought to bear
by voters, developers, environmentalists, and others. The selection process is not
as “clean” as in private sector evaluation.
The viewpoint of the public sector analysis must be determined before cost,
benefit, and disbenefit estimates are made and before the evaluation is for-
mulatedandperformed.Thereareseveralviewpointsforanysituation,and
the different perspectives may alter how a cash flow estimate is classified.
Some example perspectives are the citizen; the city tax base; number of students
in the school district; creation and retention of jobs; economic development
Environment of the evaluation Politically inclined Primarily economic
Alternative selection criteria Multiple criteria Primarily based on rate of return
bla18632_ch09.qxd 08/20/2004 5:44 PM Page 316
6. potential; a particular industry interest, such as agriculture, banking, or electron-
ics manufacturing; and many others. In general, the viewpoint of the analysis
should be as broadly defined as those who will bear the costs of the project and
reap its benefits. Once established, the viewpoint assists in categorizing the costs,
benefits, and disbenefits of each alternative, as illustrated in Example 9.1.
SECTION 9.1 Public Sector Projects 317
MASTER ➀
EXAMPLE 9.1
The citizen-based Capital Improvement Projects (CIP) Committee for the city of
Dundee has recommended a $5 million bond issue for the purchase of greenbelt/flood-
plain land to preserve low-lying green areas and wildlife habitat on the east side of this
rapidly expanding city of 62,000. The proposal is referred to as the Greenway Acquisi-
tion Initiative. Developers immediately opposed the proposal due to the reduction of
available land for commercial development. The city engineer and economic develop-
ment director have made the following preliminary estimates for some obvious areas,
considering the Initiative’s consequences in maintenance, parks, commercial develop-
ment, and flooding over a projected 15-year planning horizon. The inaccuracy of these
estimates is made very clear in the report to the Dundee City Council. The estimates are
not yet classified as costs, benefits, or disbenefits. If the GreenwayAcquisition Initiative
is implemented, the estimates are as follows.
Economic Dimension Estimate
1. Annual cost of $5 million in bonds over $300,000 (years 1–14)
15 years at 6% bond interest rate $5,300,000 (year 15)
2. Annual maintenance, upkeep, $75,000 ϩ 10% per year
and program management
3. Annual parks development budget $500,000 (years 5–10)
4. Annual loss in commercial development $2,000,000 (years 8–10)
5. State sales tax rebates not realized $275,000 ϩ 5% per year (years 8 on)
6. Annual municipal income from park $100,000 ϩ 12% per year (years 6 on)
use and regional sports events
7. Savings in flood control projects $300,000 (years 3–10)
$1,400,000 (years 10–15)
8. Property damage (personal and city) $500,000 (years 10 and 15)
not experienced due to flooding
Identify three different viewpoints for the economic analysis of the proposal, and clas-
sify the estimates accordingly.
Solution
There are many perspectives to take; three are addressed here. The viewpoints and goals
are identified and each estimate is classified as a cost, benefit, or disbenefit. (How the
classification is made will vary depending upon who does the analysis. This solution
offers only one logical answer.)
Viewpoint 1: Citizen of the city. Goal: Maximize the quality and wellness of citizens
with family and neighborhood as prime concerns.
Costs: 1, 2, 3 Benefits: 6, 7, 8 Disbenefits: 4, 5
bla18632_ch09.qxd 08/20/2004 5:44 PM Page 317
7. MASTER ➀
318 CHAPTER 9 Benefit/Cost Analysis and Public Sector Economics
Viewpoint 2: City budget. Goal: Ensure the budget is balanced and of sufficient size to
fund rapidly growing city services.
Costs: 1, 2, 3, 5 Benefits: 6, 7, 8 Disbenefits: 4
Viewpoint 3: Economic development. Goal: Promote new commercial and industrial
economic development for creation and retention of jobs.
Costs: 1, 2, 3, 4, 5 Benefits: 6, 7, 8 Disbenefits: none
Classification of estimates 4 (loss of commercial development) and 5 (loss of sales tax
rebates) changes depending upon the view taken for the economic analysis. If the ana-
lyst favors the economic development goals of the city, commercial development losses
are considered real costs, whereas they are undesirable consequences (disbenefits) from
the citizen and budget viewpoints. Also, the loss of sales tax rebates from the state is in-
terpreted as a real cost from the budget and economic development perspectives, but as
a disbenefit from the citizen viewpoint.
Comment
Disbenefits may be included or disregarded in an analysis, as discussed in the next sec-
tion. This decision can make a distinctive difference in the acceptance or rejection of a
public sector alternative.
During the last several decades, larger public sector projects have been devel-
oped increasingly often through public-private partnerships. This is the trend in
part because of the greater efficiency of the private sector and in part because of
the sizable cost to design, construct, and operate such projects. Full funding by
the government unit may not be possible using traditional means of government
financing—fees, taxes, and bonds. Some examples of the projects are as follows:
Project Some Purposes of the Project
Bridges and tunnels Speed traffic flows; reduce congestion; improve safety
Ports and harbors Increase cargo capacity; support industrial development
Airports Increase capacity; improve passenger safety; support development
Water resources Increased desalination for drinking water; meet irrigation and
industrial needs; improve wastewater treatment
In these joint ventures, the public sector (government) is responsible for the cost
and service to the citizenry, and the private sector partner (corporation) is re-
sponsible for varying aspects of the projects as detailed below. The government
unit cannot make a profit, but the corporation(s) involved can realize a reason-
able profit; in fact the profit margin is usually written into the contract that gov-
erns the design, construction, operation, and ownership of the project.
Traditionally, such construction projects have been designed for and financed
by a government unit with a contractor doing the construction under either a
lump-sum (fixed-price) contract or a cost reimbursement (cost-plus) contract that
specifies the agreed upon margin of profit. In these cases, the contractor does not
share the risk of the project’s success with the government “owner.” When a
bla18632_ch09.qxd 08/20/2004 5:44 PM Page 318
8. MASTER ➀
SECTION 9.2 Benefit/Cost Analysis of a Single Project 319
partnership of public and private interests is developed, the project is commonly
contracted under an arrangement called build-operate-transfer (BOT), which may
also be referred to as BOOT, where the first O is for own. The BOT-administered
project may require that the contractor be responsible partially or completely for
design and financing, and completely responsible for the construction (the build
element), operation (operate), and maintenance activities for a specified number
of years. After this time period, the owner becomes the government unit when
the title of ownership is transferred (transfer) at no or very low cost. This arrange-
ment may have several advantages, some of which are
Better efficiency of resource allocation of private enterprise
Ability to acquire funds (loans) based on financial record of the government
and corporate partners
Environmental, liability, and safety issues addressed by the private sector,
where there usually is greater expertise
Contracting corporation(s) able to realize a return on the investment during
the operation phase
Many of the projects in international settings and in developing countries utilize
the BOT form of partnership. There are, of course, disadvantages to this arrange-
ment. One risk is that the amount of financing committed to the project may not
cover the actual build cost because it is considerably higher than estimated. A
second risk is that a reasonable profit may not be realized by the private corpora-
tion due to low usage of the facility during the operate phase. To plan against
such problems, the original contract may provide for special loans guaranteed by
the government unit and special subsidies. The subsidy may cover costs plus
(contractually agreed-to) profit if usage is lower than a specified level. The level
used may be the breakeven point with the agreed-to profit margin considered.
A variation of the BOT/BOOT method is BOO (build-own-operate), where
the transfer of ownership never takes place. This form of public-private partner-
ship may be used when the project has a relatively short life or the technology de-
ployed is changing quickly.
9.2 BENEFIT/COST ANALYSIS OF A SINGLE PROJECT
The benefit/cost ratio is relied upon as a fundamental analysis method for public
sector projects.The B/C analysis was developed to introduce more objectivity into
public sector economics, and as one response to the U.S. Congress approving the
Flood ControlAct of 1936. There are several variations of the B/C ratio; however,
the fundamental approach is the same.All cost and benefit estimates must be con-
verted to a common equivalent monetary unit (PW, AW, or FW) at the discount
rate (interest rate). The B/C ratio is then calculated using one of these relations:
B/C ϭ ϭ ϭ [9.1]
Present worth and annual worth equivalencies are more used than future worth
values. The sign convention for B/C analysis is positive signs, so costs are pre-
ceded by a ϩ sign. Salvage values, when they are estimated, are subtracted from
FW of benefits
ᎏᎏ
FW of costs
AW of benefits
ᎏᎏ
AW of costs
PW of benefits
ᎏᎏ
PW of costs
bla18632_ch09.qxd 08/20/2004 5:44 PM Page 319
9. costs. Disbenefits are considered in different ways depending upon the model
used. Most commonly, disbenefits are subtracted from benefits and placed in the
numerator. The different formats are discussed below.
The decision guideline is simple:
If B/C Ն 1.0, accept the project as economically acceptable for the esti-
mates and discount rate applied.
If B/C Ͻ 1.0, the project is not economically acceptable.
If the B/C value is exactly or very near 1.0, noneconomic factors will help make
the decision for the “best” alternative.
The conventional B/C ratio, probably the most widely used, is calculated as
follows:
B/C ؍ ؍ [9.2]
In Equation [9.2] disbenefits are subtracted from benefits, not added to costs.
The B/C value could change considerably if disbenefits are regarded as costs.
For example, if the numbers 10, 8, and 8 are used to represent the PW of bene-
fits, disbenefits, and costs, respectively, the correct procedure results in B/C ϭ
(10 Ϫ 8)͞8 ϭ 0.25. The incorrect placement of disbenefits in the denominator
results in B/C ϭ 10͞(8 ϩ 8) ϭ 0.625, which is more than twice the correct B/C
value of 0.25. Clearly, then, the method by which disbenefits are handled affects
the magnitude of the B/C ratio. However, no matter whether disbenefits are (cor-
rectly) subtracted from the numerator or (incorrectly) added to costs in the de-
nominator, a B/C ratio of less than 1.0 by the first method will always yield a B/C
ratio less than 1.0 by the second method, and vice versa.
The modified B/C ratio includes maintenance and operation (M&O) costs in
the numerator and treats them in a manner similar to disbenefits. The denomina-
tor includes only the initial investment. Once all amounts are expressed in PW,
AW, or FW terms, the modified B/C ratio is calculated as
Modified B/C ؍ [9.3]
Salvage value is included in the denominator as a negative cost. The modified B/C
ratio will obviously yield a different value than the conventional B/C method.
However, as with disbenefits, the modified procedure can change the magnitude
of the ratio but not the decision to accept or reject the project.
The benefit and cost difference measure of worth, which does not involve a
ratio, is based on the difference between the PW, AW, or FW of benefits and
costs, that is, B Ϫ C. If (B Ϫ C) Ն 0, the project is acceptable. This method has
the advantage of eliminating the discrepancies noted above when disbenefits are
regarded as costs, because B represents net benefits. Thus, for the numbers 10, 8,
and 8 the same result is obtained regardless of how disbenefits are treated.
Subtracting disbenefits from benefits: B Ϫ C ϭ (10 Ϫ 8) Ϫ 8 ϭ Ϫ6
Adding disbenefits to costs: B Ϫ C ϭ 10 Ϫ (8 ϩ 8) ϭ Ϫ6
benefits ؊ disbenefits ؊ M&O costs
ᎏᎏᎏᎏ
initial investment
B ؊ D
ᎏ
C
benefits ؊ disbenefits
ᎏᎏᎏ
costs
320 CHAPTER 9 Benefit/Cost Analysis and Public Sector Economics
MASTER ➀
bla18632_ch09.qxd 08/20/2004 5:44 PM Page 320
10. Before calculating the B/C ratio by any formula, check whether the alternative
with the larger AW or PW of costs also yields a larger AW or PW of benefits. It
is possible for one alternative with larger costs to generate lower benefits than
other alternatives, thus making it unnecessary to further consider the larger-cost
alternative.
SECTION 9.2 Benefit/Cost Analysis of a Single Project 321
MASTER ➀
The Ford Foundation expects to award $15 million in grants to public high schools to
develop new ways to teach the fundamentals of engineering that prepare students for
university-level material. The grants will extend over a 10-year period and will create
an estimated savings of $1.5 million per year in faculty salaries and student-related
expenses. The Foundation uses a rate of return of 6% per year on all grant awards.
This grants program will share Foundation funding with ongoing activities, so an
estimated $200,000 per year will be removed from other program funding. To make this
program successful, a $500,000 per year operating cost will be incurred from the regu-
lar M&O budget. Use the B/C method to determine if the grants program is economi-
cally justified.
Solution
Use annual worth as the common monetary equivalent. All three B/C models are used
to evaluate the program.
AW of investment cost. $15,000,000(A͞P,6%,10) ϭ $2,038,050 per year
AW of benefit. $1,500,000 per year
AW of disbenefit. $200,000 per year
AW of M&O cost. $500,000 per year
Use Equation [9.2] for conventional B/C analysis, where M&O is placed in the denom-
inator as an annual cost.
B/C ϭ ϭ ϭ 0.51
The project is not justified, since B/C Ͻ 1.0.
By Equation [9.3] the modified B/C ratio treats the M&O cost as a reduction to
benefits.
Modified B/C ϭ ϭ 0.39
The project is also not justified by the modified B/C method, as expected.
For the (B Ϫ C) model, B is the net benefit, and the annual M&O cost is included
with costs.
B Ϫ C ϭ (1,500,000 Ϫ 200,000) Ϫ (2,038,050 ϩ 500,000) ϭ $Ϫ1.24 million
Since (B Ϫ C) Ͻ 0, the program is not justified.
1,500,000 Ϫ 200,000 Ϫ 500,000
ᎏᎏᎏᎏ
2,038,050
1,300,000
ᎏᎏ
2,538,050
1,500,000 Ϫ 200,000
ᎏᎏᎏ
2,038,050 ϩ 500,000
EXAMPLE 9.2
bla18632_ch09.qxd 08/20/2004 5:44 PM Page 321
11. MASTER ➀
322 CHAPTER 9 Benefit/Cost Analysis and Public Sector Economics
Aaron is a new project engineer with the Arizona Department of Transportation (ADOT).
After receiving a degree in engineering from Arizona State University, he decided to gain
experience in the public sector before applying to master’s degree programs. Based on an-
nual worth relations, Aaron performed the conventional B/C analysis of the two separate
proposals shown below.
Bypass proposal: new routing around part of Flagstaff to improve safety and decrease
average travel time.
Source of proposal: State ADOT office of major thoroughfare analysis.
Initial investment in present worth: P ϭ $40 million.
Annual maintenance: $1.5 million.
Annual benefits to public: B ϭ $6.5 million.
Expected life: 20 years.
Funding: Shared 50–50 federal and state funding; federally required 8% discount rate
applies.
Upgrade proposal: widening of roadway through parts of Flagstaff to alleviate traffic
congestion and improve traffic safety.
Source of proposal: Local Flagstaff district office of ADOT.
Initial investment in present worth: P ϭ $4 million.
Annual maintenance: $150,000.
Annual benefits to public: B ϭ $650,000.
Expected life: 12 years.
Funding: 100% state funding required; usual 4% discount rate applies.
Aaron used a hand solution for the conventional B/C analysis in Equation [9.2] with AW
values calculated at 8% per year for the bypass proposal and at 4% per year for the upgrade
proposal.
Bypass proposal: AW of investment ϭ $40,000,000(A͞P,8%,20) ϭ $4,074,000 per
year
B/C ϭ ϭ 1.17
Upgrade proposal: AW of investment ϭ $4,000,000(A͞P,4%,12) ϭ $426,200 per
year
B/C ϭ ϭ 1.13
Both proposals are economically justified since B/C Ͼ 1.0.
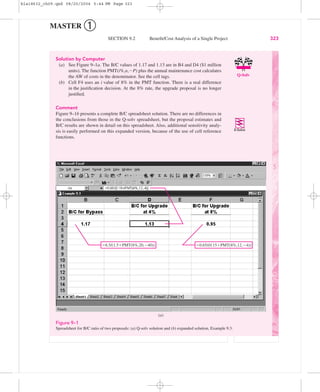
(a) Perform the same analysis by computer, using a minimum number of computa-
tions.
(b) The discount rate for the upgrade proposal is not certain, because ADOT is thinking
of asking for federal funds for it. Is the upgrade economically justified if the 8% dis-
count rate also applies to it?
650,000
ᎏᎏᎏ
426,200 ϩ 150,000
6,500,000
ᎏᎏᎏ
4,074,000 ϩ 1,500,000
EXAMPLE 9.3
bla18632_ch09.qxd 08/20/2004 5:44 PM Page 322
12. MASTER ➀
SECTION 9.2 Benefit/Cost Analysis of a Single Project 323
Solution by Computer
(a) See Figure 9–1a. The B/C values of 1.17 and 1.13 are in B4 and D4 ($1 million
units). The function PMT(i%,n,ϪP) plus the annual maintenance cost calculates
the AW of costs in the denominator. See the cell tags.
(b) Cell F4 uses an i value of 8% in the PMT function. There is a real difference
in the justification decision. At the 8% rate, the upgrade proposal is no longer
justified.
Comment
Figure 9–1b presents a complete B/C spreadsheet solution. There are no differences in
the conclusions from those in the Q-solv spreadsheet, but the proposal estimates and
B/C results are shown in detail on this spreadsheet. Also, additional sensitivity analy-
sis is easily performed on this expanded version, because of the use of cell reference
functions.
Q-Solv
ϭ6.5/(1.5ϩPMT(8%,20,Ϫ40)) ϭ0.65/(0.15ϩPMT(8%,12,Ϫ4))
(a)
Figure 9–1
Spreadsheet for B/C ratio of two proposals: (a) Q-solv solution and (b) expanded solution, Example 9.3.
bla18632_ch09.qxd 08/20/2004 5:44 PM Page 323
13. MASTER ➀
9.3 ALTERNATIVE SELECTION USING INCREMENTAL
B/C ANALYSIS
The technique to compare two mutually exclusive alternatives using benefit/cost
analysis is virtually the same as that for incremental ROR in Chapter 8. The incre-
mental (conventional) B/C ratio is determined using PW,AW, or FW calculations,
and the extra-cost alternative is justified if this B/C ratio is equal to or larger than
1.0. The selection rule is as follows:
If incremental B/C Ն 1.0, choose the higher-cost alternative, because its
extra cost is economically justified.
If incremental B/C Ͻ 1.0, choose the lower-cost alternative.
To perform a correct incremental B/C analysis, it is required that each
alternative be compared only with another alternative for which the
incremental cost is already justified. This same rule was used previously
in incremental ROR analysis.
324 CHAPTER 9 Benefit/Cost Analysis and Public Sector Economics
ϭPMT(C$2,C6,ϪC4)ϩC5
ϭIF(C11Ͼ1,“Yes”,“No”)
ϭE9/E8
(b)
Figure 9–1
(Continued).
bla18632_ch09.qxd 08/20/2004 5:44 PM Page 324
14. MASTER ➀
SECTION 9.3 Alternative Selection Using Incremental B/C Analysis 325
There are several special considerations for B/C analysis that make it slightly
different from that for ROR analysis. As mentioned earlier, all costs have a pos-
itive sign in the B/C ratio. Also, the ordering of alternatives is done on the basis
of total costs in the denominator of the ratio. Thus, if two alternatives, A and B,
have equal initial investments and lives, but B has a larger equivalent annual
cost, then B must be incrementally justified against A. (This is illustrated in the
next example.) If this convention is not correctly followed, it is possible to get a
negative cost value in the denominator, which can incorrectly make B/C Ͻ 1 and
reject a higher-cost alternative that is actually justified.
Follow these steps to correctly perform a conventional B/C ratio analysis of
two alternatives. Equivalent values can be expressed in PW, AW, or FW terms.
1. Determine the total equivalent costs for both alternatives.
2. Order the alternatives by total equivalent cost; smaller first, then larger.
Calculate the incremental cost (⌬C) for the larger-cost alternative. This is
the denominator in B/C.
3. Calculate the total equivalent benefits and any disbenefits estimated for
both alternatives. Calculate the incremental benefits (⌬B) for the larger-
cost alternative. (This is ⌬(B Ϫ D) if disbenefits are considered.)
4. Calculate the incremental B/C ratio using Equation [9.2], (B Ϫ D)͞C.
5. Use the selection guideline to select the higher-cost alternative if B/C Ն 1.0.
When the B/C ratio is determined for the lower-cost alternative, it is a compari-
son with the do-nothing (DN) alternative. If B/C Ͻ 1.0, then DN should be
selected and compared to the second alternative. If neither alternative has an
acceptable B/C value, the DN alternative must be selected. In public sector
analysis, the DN alternative is usually the current condition.
The city of Garden Ridge, Florida, has received designs for a new patient room wing to
the municipal hospital from two architectural consultants. One of the two designs must
be accepted in order to announce it for construction bids. The costs and benefits are the
same in most categories, but the city financial manager decided that the three estimates
below should be considered to determine which design to recommend at the city council
meeting next week and to present to the citizenry in preparation for an upcoming bond
referendum next month.
Design A Design B
Construction cost, $ 10,000,000 15,000,000
Building maintenance cost, $/year 35,000 55,000
Patient usage cost, $/year 450,000 200,000
The patient usage cost is an estimate of the amount paid by patients over the insurance
coverage generally allowed for a hospital room. The discount rate is 5%, and the life of
EXAMPLE 9.4
Incremental ROR
Secs.
8.3 and 8.6
bla18632_ch09.qxd 08/20/2004 5:44 PM Page 325
15. MASTER ➀
326 CHAPTER 9 Benefit/Cost Analysis and Public Sector Economics
the building is estimated at 30 years.
(a) Use conventional B/C ratio analysis to select design A or B.
(b) Once the two designs were publicized, the privately owned hospital in the di-
rectly adjacent city of Forest Glen lodged a complaint that design A will reduce
its own municipal hospital’s income by an estimated $500,000 per year because
some of the day-surgery features of designAduplicate its services. Subsequently,
the Garden Ridge merchants’ association argued that design B could reduce its
annual revenue by an estimated $400,000, because it will eliminate an entire
parking lot used by their patrons for short-term parking. The city financial man-
ager stated that these concerns would be entered into the evaluation as disbene-
fits of the respective designs. Redo the B/C analysis to determine if the economic
decision is still the same as when disbenefits were not considered.
Solution
(a) Since most of the cash flows are already annualized, the incremental B/C ratio
will use AW values. No disbenefit estimates are considered. Follow the steps of
the procedure above:
1. The AW of costs is the sum of construction and maintenance costs.
AWA ϭ 10,000,000(A͞P,5%,30) ϩ 35,000 ϭ $685,500
AWB ϭ 15,000,000(A͞P,5%,30) ϩ 55,000 ϭ $1,030,750
2. Design B has the larger AW of costs, so it is the alternative to be incre-
mentally justified. The incremental cost value is
⌬C ϭ AWB Ϫ AWA ϭ $345,250 per year
3. The AW of benefits is derived from the patient usage costs, since these are
consequences to the public. The benefits for the B/C analysis are not the
costs themselves, but the difference if design B is selected. The lower
usage cost each year is a positive benefit for design B.
⌬B ϭ usageA Ϫ usageB ϭ $450,000 Ϫ $200,000 ϭ $250,000 per year
4. The incremental B/C ratio is calculated by Equation [9.2].
B/C ϭ ϭ 0.72
5. The B/C ratio is less than 1.0, indicating that the extra costs associated
with design B are not justified. Therefore, design A is selected for the con-
struction bid.
(b) The revenue loss estimates are considered disbenefits. Since the disbenefits of
design B are $100,000 less than those of A, this positive difference is added to
the $250,000 benefits of B to give it a total benefit of $350,000. Now
B/C ϭ ϭ 1.01
Design B is slightly favored. In this case the inclusion of disbenefits has reversed
the previous economic decision. This has probably made the situation more dif-
ficult politically. New disbenefits will surely be claimed in the near future by
other special-interest groups.
$350,000
ᎏ
$345,250
$250,000
ᎏ
$345,250
bla18632_ch09.qxd 08/20/2004 5:44 PM Page 326
16. MASTER ➀
SECTION 9.4 Incremental B/C Analysis of Multiple, Mutually Exclusive Alternatives 327
Like other methods, B/C analysis requires equal-service comparison of alter-
natives. Usually, the expected useful life of a public project is long (25 or 30 or
more years), so alternatives generally have equal lives. However, when alterna-
tives do have unequal lives, the use of PW to determine the equivalent costs and
benefits requires that the LCM of lives be used. This is an excellent opportunity
to use the AW equivalency of costs and benefits, if the implied assumption that
the project could be repeated is reasonable. Therefore, use AW-based analysis for
B/C ratios when different-life alternatives are compared.
9.4 INCREMENTAL B/C ANALYSIS OF MULTIPLE,
MUTUALLY EXCLUSIVE ALTERNATIVES
The procedure necessary to select one from three or more mutually exclusive
alternatives using incremental B/C analysis is essentially the same as that of the
last section. The procedure also parallels that for incremental ROR analysis in
Section 8.6. The selection guideline is as follows:
Choose the largest-cost alternative that is justified with an incremental
B/C Ն 1.0 when this selected alternative has been compared with another
justified alternative.
There are two types of benefit estimates—estimation of direct benefits, and
implied benefits based on usage cost estimates. Example 9.4 is a good illustra-
tion of the second type of implied benefit estimation. When direct benefits are
estimated, the B/C ratio for each alternative may be calculated first as an initial
screening mechanism to eliminate unacceptable alternatives. At least one alter-
native must have B/C Ն 1.0 to perform the incremental B/C analysis. If all alter-
natives are unacceptable, the DN alternative is indicated as the choice. (This is
the same approach as that of step 2 for “revenue alternatives only” in the ROR
procedure of Section 8.6. However, the term “revenue alternative” is not applic-
able to public sector projects.)
As in the previous section comparing two alternatives, selection from multi-
ple alternatives by incremental B/C ratio utilizes total equivalent costs to initially
order alternatives from smallest to largest. Pairwise comparison is then under-
taken. Also, remember that all costs are considered positive in B/C calculations.
The terms defender and challenger alternative are used in this procedure, as in
a ROR-based analysis. The procedure for incremental B/C analysis of multiple
alternatives is as follows:
1. Determine the total equivalent cost for all alternatives. (Use AW, PW, or
FW equivalencies for equal lives; use AW for unequal lives.)
2. Order the alternatives by total equivalent cost, smallest first.
3. Determine the total equivalent benefits (and any disbenefits estimated) for
each alternative.
4. Direct benefits estimation only: Calculate the B/C for the first ordered
alternative. (In effect, this makes DN the defender and the first alternative
the challenger.) If B/C Ͻ 1.0, eliminate the challenger, and go to the next
Incremental ROR
Sec. 8.6
bla18632_ch09.qxd 08/20/2004 5:44 PM Page 327
17. MASTER ➀
challenger. Repeat this until B/C Ն 1.0. The defender is eliminated, and the
next alternative is now the challenger. (For analysis by computer, deter-
mine the B/C for all alternatives initially and retain only acceptable ones.)
5. Calculate incremental costs (⌬C) and benefits (⌬B) using the relations
⌬C ϭ challenger cost Ϫ defender cost [9.4]
⌬B ϭ challenger benefits Ϫ defender benefits [9.5]
If relative usage costs are estimated for each alternative, rather than direct
benefits, ⌬B may be found using the relation
⌬B ϭ defender usage costs Ϫ challenger usage costs [9.6]
6. Calculate the incremental B/C for the first challenger compared to the
defender.
B/C ϭ ⌬B͞⌬C [9.7]
If incremental B/C Ն 1.0 in Equation [9.7], the challenger becomes the
defender and the previous defender is eliminated. Conversely, if incremen-
tal B/C Ͻ 1.0, remove the challenger and the defender remains against the
next challenger.
7. Repeat steps 5 and 6 until only one alternative remains. It is the selected one.
In all the steps above, incremental disbenefits may be considered by replacing
⌬B with ⌬(B Ϫ D), as in the conventional B/C ratio, Equation [9.2].
328 CHAPTER 9 Benefit/Cost Analysis and Public Sector Economics
The Economic Development Corporation (EDC) for the city of Bahia, California, and
Moderna County is operated as a not-for-profit corporation. It is seeking a developer that
will place a major water park in the city or county area. Financial incentives will be
awarded. In response to a request for proposal (RFP) to the major water park developers in
the country, four proposals have been received. Larger and more intricate water rides and
increased size of the park will attract more customers, thus different levels of initial incen-
tives are requested in the proposals. One of these proposals will be accepted by the EDC
and recommended to the Bahia City Council and Moderna County Board of Trustees for
approval.
Approved and in-place economic incentive guidelines allow entertainment industry
prospects to receive up to $500,000 cash as a first-year incentive award and 10% of this
amount each year for 8 years in property tax reduction. All the proposals meet the require-
ments for these two incentives. Each proposal includes a provision that residents of the city
or county will benefit from reduced entrance (usage) fees when using the park. This fee re-
duction will be in effect as long as the property tax reduction incentive continues. The EDC
has estimated the annual total entrance fees with the reduction included for local residents.
Also, EDC estimated the extra sales tax revenue expected for the four park designs. These
estimates and the costs for the initial incentive and annual 10% tax reduction are summa-
rized in the top section of Table 9–1.
EXAMPLE 9.5
bla18632_ch09.qxd 08/20/2004 5:44 PM Page 328
18. MASTER ➀
SECTION 9.4 Incremental B/C Analysis of Multiple, Mutually Exclusive Alternatives 329
EXAMPLE 9.5 CONTINUED
Utilize hand and computer analysis to perform an incremental B/C study to determine
which park proposal is the best economically. The discount rate used by the EDC is 7% per
year. Can the current incentive guidelines be used to accept the winning proposal?
Solution by Hand
The viewpoint taken for the economic analysis is that of a resident of the city or county.
The first-year cash incentives and annual tax reduction incentives are real costs to the res-
idents. Benefits are derived from two components: the decreased entrance fee estimates
and the increased sales tax receipts. These will benefit each citizen indirectly through the
increase in money available to those who use the park and through the city and county
budgets where sales tax receipts are deposited. Since these benefits must be calculated in-
directly from these two components, the initial proposal B/C values cannot be calculated to
initially eliminate any proposals. A B/C analysis incrementally comparing two alternatives
at a time must be conducted.
Table 9–1 includes the results of applying the procedure above. Equivalent AW values
are used for benefit and cost amounts per year. Since the benefits must be derived indirectly
from the entrance fee estimates and sales tax receipts, step 4 is not used.
1. For each alternative, the capital recovery amount over 8 years is determined and
added to the annual property tax incentive cost. For proposal #1,
AW of total costs ϭ initial incentive(A͞P,7%,8) ϩ tax cost
ϭ $250,000(A͞P,7%,8) ϩ 25,000 ϭ $66,867
TABLE 9–1 Estimates of Costs and Benefits, and the Incremental B/C Analysis for Four Water
Park Proposals, Example 9.5
Proposal 1 Proposal 2 Proposal 3 Proposal 4
Initial incentive, $ 250,000 350,000 500,000 800,000
Tax incentive cost, $/year 25,000 35,000 50,000 80,000
Resident entrance fees, $/year 500,000 450,000 425,000 250,000
Extra sales taxes, $/year 310,000 320,000 320,000 340,000
Study period, years 8 8 8 8
AW of total costs, $ 66,867 93,614 133,735 213,976
Alternatives compared 2-to-1 3-to-2 4-to-2
Incremental costs ⌬C, $/year 26,747 40,120 120,360
Entrance fee reduction, $/year 50,000 25,000 200,000
Extra sales tax, $/year 10,000 0 20,000
Incremental benefits ⌬B, $/year 60,000 25,000 220,000
Incremental B/C ratio 2.24 0.62 1.83
Increment justified? Yes No Yes
Alternative selected 2 2 4
bla18632_ch09.qxd 08/20/2004 5:44 PM Page 329
19. MASTER ➀
330 CHAPTER 9 Benefit/Cost Analysis and Public Sector Economics
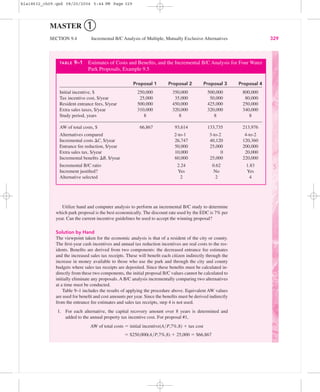
2. The alternatives are ordered by the AW of total costs in Table 9–1.
3. The annual benefit of an alternative is the incremental benefit of the entrance fees and
sales tax amounts. These are calculated in step 5.
4. This step is not used.
5. Table 9–1 shows incremental costs calculated by Equation [9.4]. For the 2-to-1
comparison,
⌬C ϭ $93,614 Ϫ 66,867 ϭ $26,747
Incremental benefits for an alternative are the sum of the resident entrance fees com-
pared to those of the next-lower-cost alternative, plus the increase in sales tax receipts
over those of the next-lower-cost alternative. Thus, the benefits are determined incre-
mentally for each pair of alternatives. For example, when proposal #2 is compared
to proposal #1, the resident entrance fees decrease by $50,000 per year and the sales
tax receipts increase by $10,000. Then the total benefit is the sum of these, that is,
⌬B ϭ $60,000 per year.
6. For the 2-to-1 comparison, Equation [9.7] results in
B/C ϭ $60,000͞$26,747 ϭ 2.24
Alternative #2 is clearly incrementally justified. Alternative #1 is eliminated, and
alternative #3 is the new challenger to defender #2.
7. This process is repeated for the 3-to-2 comparison, which has an incremental B/C of
0.62 because the incremental benefits are substantially less than the increase in costs.
Therefore, proposal #3 is eliminated, and the 4-to-2 comparison results in
B/C ϭ $220,000͞$120,360 ϭ 1.83
Since B/C Ͼ 1.0, proposal #4 is retained. Since proposal #4 is the one remaining
alternative, it is selected.
The recommendation for proposal #4 requires an initial incentive of $800,000, which
exceeds the $500,000 limit of the approved incentive limits. The EDC will have to request
the City Council and County Trustees to grant an exception to the guidelines. If the excep-
tion is not approved, proposal #2 is accepted.
Solution by Computer
Figure 9–2 presents a spreadsheet using the same calculations as those in Table 9–1. Row 8
cells include the function PMT(7%,8,Ϫinitial incentive) to calculate the capital recovery
for each alternative, plus the annual tax cost. These AW of total cost values are used to
order the alternatives for incremental comparison.
The cell tags for rows 10 through 13 detail the formulas for incremental costs and
benefits used in the incremental B/C computation (row 14). Note the difference in row 11
and 12 formulas, which find the incremental benefits for entrance fees and sales tax, re-
spectively. The order of the subtraction between columns in row 11 (e.g., ϭB5 Ϫ C5, for
the 2-to-1 comparison) must be correct to obtain the incremental entrance fees benefit. The
IF operators in row 15 accept or reject the challenger, based upon the size of B/C. After
the 3-to-2 comparison with B/C ϭ 0.62 in cell D14, alternative #3 is eliminated. The final
selection is alternative #4, as in the solution by hand.
bla18632_ch09.qxd 08/20/2004 5:44 PM Page 330
20. MASTER ➀
SECTION 9.4 Incremental B/C Analysis of Multiple, Mutually Exclusive Alternatives 331
ϭPMT($B$1,C$7,ϪC3)ϩC4 ϭIF(E14Ͼ1,“Yes”,“No”)
ϭE$13/E$10
ϭC$8ϪB$8
ϭB$5ϪC$5
ϭC$6ϪB$6
ϭC$11ϩC$12
Figure 9–2
Spreadsheet solution for an incremental B/C analysis of four mutually exclusive alternatives,
Example 9.5.
When the lives of alternatives are so long that they can be considered infinite,
the capitalized cost is used to calculate the equivalent PW or AW values for costs
and benefits. Equation [5.3], A ϭ P(i), is used to determine the equivalent AW
values in the incremental B/C analysis.
If two or more independent projects are evaluated using B/C analysis
and there is no budget limitation, no incremental comparison is necessary.
The only comparison is between each project separately with the do-nothing
alternative. The project B/C values are calculated, and those with B/C Ն 1.0
are accepted. This is the same procedure as that used to select from indepen-
dent projects using the ROR method (Chapter 8). When a budget limitation is
imposed, the capital budgeting procedure discussed in Chapter 12 must be
applied.
Capitalized cost
Sec. 5.5
bla18632_ch09.qxd 08/20/2004 5:44 PM Page 331
21. MASTER ➀
332 CHAPTER 9 Benefit/Cost Analysis and Public Sector Economics
The Army Corps of Engineers wants to construct a dam on a flood-prone river. The
estimated construction cost and average annual dollar benefits are listed below. (a) If a 6%
per year rate applies and dam life is infinite for analysis purposes, select the one best location
using the B/C method. If no site is acceptable, other sites will be determined later. (b) If more
than one dam site can be selected, which sites are acceptable, using the B/C method?
Construction Cost, Annual
Site $ millions Benefits, $
A 6 350,000
B 8 420,000
C 3 125,000
D 10 400,000
E 5 350,000
F 11 700,000
Solution
(a) The capitalized cost A ϭ Pi is used to obtain AW values for annual capital recovery
of the construction cost, as shown in the first row of Table 9–2. Since benefits are
estimated directly, the site B/C ratio can be used for initial screening. Only sites E
and F have B/C Ͼ 1.0, so they are evaluated incrementally. The E-to-DN comparison
is performed because it is not required that one site must be selected. The analysis be-
tween the mutually exclusive alternatives in the lower portion of Table 9–2 is based
on Equation [9.7].
Incremental B/C ϭ
Since only site E is incrementally justified, it is selected.
(b) The dam site proposals are now independent projects. The site B/C ratio is used to se-
lect from none to all six sites. In Table 9–2, B/C Ͼ 1.0 for sites E and F only; they are
acceptable, the rest are not.
⌬ annual benefits
ᎏᎏ
⌬ annual costs
EXAMPLE 9.6
TABLE 9–2 Use of Incremental B/C Ratio Analysis for Example 9.6 (Values in $1000)
C E A B D F
Capital recovery cost, $ 180 300 360 480 600 660
Annual benefits, $ 125 350 350 420 400 700
Site B/C 0.69 1.17 0.97 0.88 0.67 1.06
Decision No Retain No No No Retain
Comparison E-to-DN F-to-E
⌬ Annual cost, $ 300 360
⌬ Annual benefits, $ 350 350
⌬ (B/C) ratio 1.17 0.97
Increment justified? Yes No
Site selected E E
bla18632_ch09.qxd 08/20/2004 5:44 PM Page 332
22. MASTER ➀
PROBLEMS 333
CHAPTER SUMMARY
The benefit/cost method is used primarily to evaluate projects and to select from
alternatives in the public sector. When one is comparing mutually exclusive al-
ternatives, the incremental B/C ratio must be greater than or equal to 1.0 for the
incremental equivalent total cost to be economically justified. The PW, AW, or
FW of the initial costs and estimated benefits can be used to perform an incre-
mental B/C analysis. If alternative lives are unequal, the AW values should be
used, provided the assumption of project repetition is not unreasonable. For inde-
pendent projects, no incremental B/C analysis is necessary. All projects with
B/C Ն 1.0 are selected provided there is no budget limitation.
Public sector economics are substantially different from those of the private
sector. For public sector projects, the initial costs are usually large, the expected
life is long (25, 35, or more years), and the sources for capital are usually a combi-
nation of taxes levied on the citizenry, user fees, bond issues, and private lenders.
It is very difficult to make accurate estimates of benefits for a public sector project.
The interest rates, called the discount rates in the public sector, are lower than
those for corporate capital financing.Although the discount rate is as important to
establish as the MARR, it can be difficult to establish, because various government
agencies qualify for different rates. Standardized discount rates are established
for some federal agencies.
Comment
In part (a), suppose that site G is added with a construction cost of $10 million and an
annual benefit of $700,000. The site B/C is acceptable at B/C ϭ 700͞600 ϭ 1.17. Now, in-
crementally compare G-to-E; the incremental B/C ϭ 350͞300 ϭ 1.17, in favor of G. In this
case, site F must be compared with G. Since the annual benefits are the same ($700,000),
the B/C ratio is zero and the added investment is not justified. Therefore, site G is chosen.
PROBLEMS
Public Sector Economics
9.1 State the difference between public and
private sector alternatives with respect to
the following characteristics.
(a) Size of investment
(b) Life of project
(c) Funding
(d) MARR
9.2 Indicate whether the following character-
istics are primarily associated with public
sector or private sector projects.
(a) Profits
(b) Taxes
(c) Disbenefits
(d) Infinite life
(e) User fees
(f) Corporate bonds
bla18632_ch09.qxd 08/20/2004 5:44 PM Page 333
23. MASTER ➀
334 CHAPTER 9 Benefit/Cost Analysis and Public Sector Economics
9.3 Identify each cash flow as a benefit, dis-
benefit, or cost.
(a) $500,000 annual income from
tourism created by a freshwater
reservoir
(b) $700,000 per year maintenance by
container ship port authority
(c) Expenditure of $45 million for tun-
nel construction on an interstate
highway
(d) Elimination of $1.3 million in
salaries for county residents based
on reduced international trade
(e) Reduction of $375,000 per year in
car accident repairs because of im-
proved lighting
(f) $700,000 per year loss of revenue by
farmers because of highway right-of-
way purchases
9.4 During its 20 years in business, Deware
Construction Company has always devel-
oped its contracts under a fixed-fee or
cost-plus arrangement. Now it has been
offered an opportunity to participate in a
project to provide cross-country highway
transportation in an international setting,
specifically, a country in Africa. If ac-
cepted, Deware will work as subcontractor
to a larger European corporation, and the
BOT form of contracting will be used with
the African country government. Describe
for the president of Deware at least four of
the significant differences that may be ex-
pected when the BOT format is utilized in
lieu of its more traditional forms of con-
tract making.
9.5 If a corporation accepts the BOT form of
contracting, (a) identify two risks taken by
a corporation and (b) state how these risks
can be reduced by the government partner.
Project B/C Value
9.6 The estimated annual cash flows for a pro-
posed city government project are costs of
$450,000 per year, benefits of $600,000
per year, and disbenefits of $100,000 per
year. Determine the (a) B/C ratio and (b)
value of B Ϫ C.
9.7 Use spreadsheet software such as Excel,
PW analysis, and a discount rate of 5% per
year to determine that the B/C value for
the following estimates is 0.375, making
the project not acceptable using the benefit/
cost method. (a) Enter the values and
equations on the spreadsheet so they may
be changed for the purpose of sensitivity
analysis.
First cost ϭ $8 million
Benefit ϭ $550,000 per year
Annual cost ϭ $800,000/year
Disbenefit ϭ $100,000/year
(b) Do the following sensitivity analysis
by changing only two cells on your
spreadsheet. Change the discount rate to
3% per year, and adjust the annual cost es-
timate until B/C ϭ 1.023. This makes the
project just acceptable using benefit/cost
analysis.
9.8 A proposed regulation regarding the re-
moval of arsenic from drinking water is
expected to have an annual cost of $200
per household per year. If it is assumed
that there are 90 million households in the
country and that the regulation could save
12 lives per year, what would the value of
a human life have to be for the B/C ratio to
be equal to 1.0?
9.9 The U.S. Environmental ProtectionAgency
has established that 2.5% of the median
household income is a reasonable amount
to pay for safe drinking water. The median
household income is $30,000 per year. For
a regulation that would affect the health of
people in 1% of the households, what
would the health benefits have to equal
in dollars per household (for that 1% of
bla18632_ch09.qxd 08/20/2004 5:44 PM Page 334
24. the households) for the B/C ratio to be
equal to 1.0?
9.10 Use a spreadsheet to set up and solve
Problem 9.9, and then apply the following
changes. Observe the increases and de-
creases in the required economic value of
the health benefits for each of these
changes.
(a) Median income is $18,000 (poorer
country), and percentage of house-
hold income is reduced to 2%.
(b) Median income is $30,000 and 2.5%
is spent on safe water, but only 0.5%
of the households are affected.
(c) What percentage of the households
must be affected if the required health
benefit and annual income both equal
$18,000?Assume the 2.5% of income
estimate is maintained.
9.11 The fire chief of a medium-sized city has
estimated that the initial cost of a new fire
station will be $4 million. Annual upkeep
costs are estimated at $300,000. Benefits
to citizens of $550,000 per year and dis-
benefits of $90,000 per year have also
been identified. Use a discount rate of 4%
per year to determine if the station is eco-
nomically justified by (a) the conventional
B/C ratio and (b) the B Ϫ C difference.
9.12 As part of the rehabilitation of the down-
town area of a southern U.S. city, the
Parks and Recreation Department is plan-
ning to develop the space below several
overpasses into basketball, handball,
miniature golf, and tennis courts. The ini-
tial cost is expected to be $150,000 for im-
provements which are expected to have a
20-year life. Annual maintenance costs are
projected to be $12,000. The department
expects 24,000 people per year to use the
facilities an average of 2 hours each. The
value of the recreation has been conserva-
tively set at $0.50 per hour. At a discount
rate of 3% per year, what is the B/C ratio
for the project?
9.13 The B/C ratio for a new flood control pro-
ject along the banks of the Mississippi
River is required to be 1.3. If the benefit is
estimated at $600,000 per year and the
maintenance cost is expected to total
$300,000 per year, what is the allowed
maximum initial cost of the project? The
discount rate is 7% per year, and a project
life of 50 years is expected. Solve in two
ways: (a) by hand and (b) using a spread-
sheet set up for sensitivity analysis.
9.14 Use the spreadsheet developed in Problem
9.13(b) to determine the B/C ratio if the
initial cost is actually $3.23 million and
the discount rate is now 5% per year.
9.15 The modified B/C ratio for a city-owned
hospital heliport project is 1.7. If the initial
cost is $1 million and the annual benefits
are $150,000, what is the amount of the
annual M&O costs used in the calculation,
if a discount rate of 6% per year applies?
The estimated life is 30 years.
9.l6 Calculate the B/C ratio for the following
cash flow estimates at a discount rate of
6% per year.
Item Cash Flow
PW of benefits, $ 3,800,000
AW of disbenefits, $/year 45,000
First cost, $ 2,200,000
M&O costs, $/year 300,000
Life of project, years 15
9.17 Hemisphere Corp. is considering a BOT
contract to construct and operate a large
dam with a hydroelectric power genera-
tion facility in a developing nation in the
southern hemisphere. The initial cost of
the dam is expected to be $30 million, and
it is expected to cost $100,000 per year
PROBLEMS 335
MASTER ➀
bla18632_ch09.qxd 08/20/2004 5:44 PM Page 335
25. to operate and maintain. Benefits from
flood control, agricultural development,
tourism, etc., are expected to be $2.8 mil-
lion per year. At an interest rate of 8% per
year, should the dam be constructed on
the basis of its conventional B/C ratio?
The dam is assumed to be a permanent
asset for the country. (a) Solve by hand.
(b) Using a spreadsheet, find the B/C ratio
with only a single cell computation.
9.18 The U.S. Army Corps of Engineers is con-
sidering the feasibility of constructing a
small flood control dam in an existing ar-
royo. The initial cost of the project will be
$2.2 million, with inspection and upkeep
costs of $10,000 per year. In addition,
minor reconstruction will be required
every 15 years at a cost of $65,000. If
flood damage will be reduced from the
present cost of $90,000 per year to
$10,000 annually, use the benefit/cost
method to determine if the dam should be
constructed. Assume that the dam will be
permanent and the interest rate is 12% per
year.
9.19 A highway construction company is under
contract to build a new roadway through
a scenic area and two rural towns in
Colorado. The road is expected to cost $18
million, with annual upkeep estimated at
$150,000 per year. Additional income
from tourists of $900,000 per year is esti-
mated. If the road is expected to have a
useful commercial life of 20 years, use
one spreadsheet to determine if the high-
way should be constructed at an interest
rate of 6% per year by applying (a) the
B Ϫ C method, (b) the B/C method, and
(c) the modified B/C method. (Addition-
ally, if the instructor requests it: Set up the
spreadsheet for sensitivity analysis and
use the Excel IF operator to make the
build–don’t build decision in each part of
the problem.)
9.20 The U.S. Bureau of Reclamation is con-
sidering a project to extend irrigation
canals into a desert area. The initial cost of
the project is expected to be $1.5 million,
with annual maintenance costs of $25,000
per year. (a) If agricultural revenue is ex-
pected to be $175,000 per year, do a B/C
analysis to determine whether the project
should be undertaken, using a 20-year
study period and a discount rate of 6% per
year. (b) Rework the problem, using the
modified B/C ratio.
9.21 (a) Set up the spreadsheet and (b) use hand
calculations to calculate the B/C ratio for
Problem 9.20 if the canal must be dredged
every 3 years at a cost of $60,000 and
there is a $15,000 per year disbenefit asso-
ciated with the project.
Alternative Comparison
9.22 Apply incremental B/C analysis at an in-
terest rate of 8% per year to determine
which alternative should be selected. Use
a 20-year study period, and assume the
damage costs might occur in year 6 of the
study period.
Alternative A Alternative B
Initial cost, $ 600,000 800,000
Annual M&O 50,000 70,000
costs, $/year
Potential damage 950,000 250,000
costs, $
9.23 Two routes are under consideration for
a new interstate highway segment. The
long route would be 25 kilometers and
would have an initial cost of $21 million.
The short transmountain route would span
10 kilometers and would have an initial
cost of $45 million. Maintenance costs are
estimated at $40,000 per year for the long
route and $15,000 per year for the short
route. Additionally, a major overhaul and
336 CHAPTER 9 Benefit/Cost Analysis and Public Sector Economics
MASTER ➀
bla18632_ch09.qxd 08/20/2004 5:44 PM Page 336
26. of possibly building a new container port to
augment the current port. The west coast
siteisondeeperwatersothedredgingcostis
lower than that for the east coast site. Also,
the redredging of the west site will be re-
quired only every 6 years while the east site
mustbereworkedeach4years.Redredging,
whichisexpectedtoincreaseincostby10%
each time, will not take place in the last year
of a port’s commercial life. Disbenefit esti-
mates vary from west (fishing revenue loss)
to east (fishing and resort revenue losses).
Feestoshippersper20-footSTDequivalent
areexpectedtobehigheratthewestsitedue
to greater difficulty in handling ships be-
cause of the ocean currents present in the
area and a higher cost of labor in this area of
the country. All estimates are summarized
below in $1 million, except annual revenue
and life. Use spreadsheet analysis and a dis-
count rate of 4% per year to determine if ei-
therportshouldbeconstructed.Itisnotnec-
essary that the country build either port
since one is already operating successfully.
resurfacing will be required every 10 years
at a cost of 10% of the first cost of each
route. Regardless of which route is se-
lected, the volume of traffic is expected to
be 400,000 vehicles per year. If the vehicle
operating expense is assumed to be $0.35
per kilometer and the value of reduced
travel time for the short route is estimated
at $900,000 per year, determine which
route should be selected, using a conven-
tional B/C analysis.Assume an infinite life
for each road, an interest rate of 6% per
year, and that one of the roads will be built.
9.24 A city engineer and economic develop-
ment director of Buffalo are evaluating
two sites for construction of a multipur-
pose sports arena. At the downtown site,
the city already owns enough land for the
arena. However, the land for construction
of a parking garage will cost $1 million.
The west side site is 30 kilometers from
downtown, but the land will be donated by
a developer who knows that an arena at
this site will increase the value of the re-
mainder of his land holdings by many
times. The downtown site will have extra
construction costs of about $10 million
because of infrastructure relocations, the
parking garage, and drainage improve-
ments. However, because of its centralized
location, there will be greater attendance
at most of the events held there. This will
result in more revenue to vendors and
local merchants in the amount of $350,000
per year. Additionally, the average at-
tendee will not have to travel as far, result-
ing in annual benefits of $400,000 per
year. All other costs and revenues are ex-
pected to be the same at either site. If the
city uses a discount rate of 8% per year,
where should the arena be constructed?
One of the two sites must be selected.
9.25 A country with rapid economic expansion
has contracted for an economic evaluation
PROBLEMS 337
MASTER ➀
West East
Coast Site Coast Site
Initial cost, $
Year 0 21 8
Year 1 0 8
Dredging cost, 5 12
$, year 0
Annual M&O, 1.5 0.8
$/year
Recurring 2 each 6 years 1.2 each 4 years
dredging with increase of with increase of
cost, $ 10% each time 10% each time
Annual disbenefits, 4 7
$/year
Annual fees: 5 million/year 8 million/year
number of at $2.50 each at $2 each
20-foot.
STD at
$/container
Commercial life, 20 12
years
bla18632_ch09.qxd 08/20/2004 5:44 PM Page 337
27. 9.26 A privately owned utility is considering
two cash rebate programs to achieve water
conservation. Program 1, which is ex-
pected to cost an average of $60 per
household, would involve a rebate of 75%
of the purchase and installation costs of an
ultralow-flush toilet. This program is pro-
jected to achieve a 5% reduction in overall
household water use over a 5-year evalua-
tion period. This will benefit the citizenry
to the extent of $1.25 per household per
month. Program 2 would involve grass re-
placement with desert landscaping. This is
expected to cost $500 per household, but it
will result in reduced water cost at an esti-
mated $8 per household per month (on the
average). At a discount rate of 0.5% per
month, which program, if either, should
the utility undertake? Use the B/C method.
9.27 Solar and conventional alternatives are
available for providing energy at a re-
mote space research site. The costs asso-
ciated with each alternative are shown
below. Use the B/C method to determine
which should be selected at an discount
rate of 0.75% per month over a 6-year
study period.
Conventional Solar
Initial cost, $ 2,000,000 4,500,000
M&O cost, $/month 50,000 10,000
Salvage value, $ 0 150,000
9.28 The California Forest Service is consider-
ing two locations for a new state park. Lo-
cation E would require an investment of
$3 million and $50,000 per year in mainte-
nance. Location W would cost $7 million
to construct, but the Forest Service would
receive an additional $25,000 per year in
park use fees. The operating cost of loca-
tion W will be $65,000 per year. The rev-
enue to park concessionaires will be
$500,000 per year at location E and
$700,000 per year at location W. The dis-
benefits associated with each location are
$30,000 per year for location E and
$40,000 per year for location W. Use (a)
the B/C method and (b) the modified B/C
method to determine which location, if ei-
ther, should be selected, using an interest
rate of 12% per year. Assume that the park
will be maintained indefinitely.
9.29 Three engineers made the estimates
shown below for two optional methods by
which new construction technology would
be implemented at a site for public hous-
ing. Either one of the two options or the
current method may be selected. Set up a
spreadsheet for B/C sensitivity analysis,
and determine if option 1, option 2, or the
do-nothing option is selected by each of
the three engineers. Use a life of 5 years
and a discount rate of 10% per year for all
analyses.
338 CHAPTER 9 Benefit/Cost Analysis and Public Sector Economics
MASTER ➀
Engineer Bob Engineer Judy Engineer Chen
Option 1 Option 2 Option 1 Option 2 Option 1 Option 2
Initial cost, $ 50,000 90,000 75,000 90,000 60,000 70,000
Cost, $/year 3,000 4,000 3,800 3,000 6,000 3,000
Benefits, $/year 20,000 29,000 30,000 35,000 30,000 35,000
Disbenefits, $/year 500 1,500 1,000 0 5,000 1,000
bla18632_ch09.qxd 08/20/2004 5:44 PM Page 338
28. 9.33 The federal government is considering
three sites in the National Wildlife Pre-
serve for mineral extraction. The cash
flows (in millions) associated with each
site are given below. Use the B/C method
to determine which site, if any, is best, if
the extraction period is limited to 5 years
and the interest rate is 10% per year.
Site A Site B Site C
Initial cost, $ 50 90 200
Annual cost, $/year 3 4 6
Annual benefits, 20 29 61
$/year
Annual disbenefits, 0.5 1.5 2.1
$/year
9.34 Over the last several months, seven differ-
ent toll bridge designs have been proposed
and estimates made to connect a resort is-
land to the mainland of an Asian country.
Annual
Construction Excess Fees Over
Location Cost, $ Millions Expenses, $100,000
A 14 4.0
B 8 6.1
C 22 10.8
D 9 8.0
E 12 7.5
F 6 3.9
G 18 9.3
A public-private partnership has been
formed, and the national bank will be pro-
viding funding at a rate of 4% per year.
Each bridge is expected to have a very long
useful life. Use B/C analysis to answer the
following. Solution by spreadsheet or by
hand is acceptable.
(a) If one bridge design must be se-
lected, determine which one is the
best economically.
Multiple Alternatives
9.30 One of four new techniques, or the current
method, can be used to control mildly irri-
tating chemical fume leakage into the
surounding air from a mixing machine.
The estimated costs and benefits (in the
form of reduced employee health costs)
are given below for each method. Assum-
ing that all methods have a 10-year life
with zero salvage value, determine which
one should be selected, using a MARR of
15% per year and the B/C method.
Technique
1 2 3 4
Installed cost, $ 15,000 19,000 25,000 33,000
AOC, $/year 10,000 12,000 9,000 11,000
Benefits, $/year 15,000 20,000 19,000 22,000
9.31 Use a spreadsheet to perform a B/C analy-
sis for the techniques in Problem 9.30
provided they are independent projects.
Assume the benefits are cumulative if more
than one technique is used in addition to
the current method.
9.32 The Water Service Authority of Dubay is
considering four sizes of pipe for a new
water line. The costs per kilometer ($/km)
for each size are given in the table. As-
suming that all pipes will last 15 years and
the MARR is 8% per year, which size pipe
should be purchased based on a B/C
analysis? Installation cost is considered a
part of the initial cost.
Pipe Size, Millimeters
130 150 200 230
Initial eqiuipment 9,180 10,510 13,180 15,850
cost, $/km
Installation cost, 600 800 1,400 1,500
$/km
Usage cost, 6,000 5,800 5,200 4,900
$/km per year
PROBLEMS 339
MASTER ➀
bla18632_ch09.qxd 08/20/2004 5:44 PM Page 339
29. (b) An international bank has offered to
fund as many as two additional
bridges, since it is estimated that the
trafffic and trade between the island
and mainland will increase signifi-
cantly. Determine which are the
three best designs economically, if
there is no budget restraint for the
purpose of this analysis.
9.35 Three alternatives identified as X, Y, and Z
were evaluated by the B/C method. The
analyst, Joyce, calculated project B/C val-
ues of 0.92, 1.34, and 1.29. The alterna-
tives are listed in order of increasing total
equivalent costs. She isn’t sure whether an
incremental analysis is needed.
(a) What do you think? If no incremen-
tal analysis is needed, why not; if so,
which alternatives must be compared
incrementally?
(b) For what type of projects is incre-
mental analysis never necessary? If
X, Y, and Z are all this type of proj-
ect, which alternatives are selected
for the B/C values calculated?
9.36 The four mutually exclusive alternatives
below are being compared using the B/C
method. What alternative, if any, should
be selected?
340 CHAPTER 9 Benefit/Cost Analysis and Public Sector Economics
MASTER ➀
Incremental B/C
Initial When Compared
Investment, with Alternative
Alternative $ Millions B/C Ratio J K L M
J 20 1.10 —
K 25 0.96 0.40 —
L 33 1.22 1.42 2.14 —
M 45 0.89 0.72 0.80 0.08 —
9.37 The city of Ocean View, California, is
considering various proposals regarding
the disposal of used tires. All the proposals
involve shredding, but the charges for the
service and handling of the tire shreds dif-
fer in each plan. An incremental B/C
analysis was initiated, but the engineer
conducting the study left recently. (a) Fill
in the blanks in the incremental B/C por-
tion of the table. (b) What alternative
should be selected?
Incremental B/C
When Compared
Initial Investment, with Alternative
Alternative $ Millions B/C Ratio P Q R S
P 10 1.1 — 2.83
Q 40 2.4 2.83 —
R 50 1.4 —
S 80 1.5 —
bla18632_ch09.qxd 08/20/2004 5:44 PM Page 340
30. is closest to
(a) 0.92
(b) 0.96
(c) 1.23
(d) 2.00
9.42 In evaluating three mutually exclusive al-
ternatives by the B/C method, the alter-
natives were ranked in terms of increasing
total equivalent cost (A, B, and C, respec-
tively), and the following results were
obtained for the project B/C ratios: 1.1,
0.9, and 1.3. On the basis of these results,
you should
(a) Select A.
(b) Select C.
(c) Select A and C.
(d) Compare A and C incrementally.
9.43 Four independent projects are evaluated,
using B/C ratios. The ratios are as
follows:
Project A B C D
B/C ratio 0.71 1.29 1.07 2.03
On the basis of these results, you should
(a) Reject B and D.
(b) Select D only.
(c) Reject A only.
(d) Compare B, C and D incrementally.
9.44 If two mutually exclusive alternatives
have B/C ratios of 1.5 and 1.4 for the
lower first-cost and higher first-cost alter-
natives, respectively,
(a) The B/C ratio on the increment be-
tween them is less than 1.4.
(b) The B/C ratio on the increment be-
tween them is between 1.4 and 1.5.
(c) The B/C ratio on the increment
between them is greater than 1.4.
(d) The lower-cost alternative is the
better one.
FE REVIEW PROBLEMS
9.38 When a B/C analysis is conducted,
(a) The benefits and costs must be ex-
pressed in terms of their present
worths.
(b) The benefits and costs must be ex-
pressed in terms of their annual
worths.
(c) The benefits and costs must be ex-
pressed in terms of their future
worths.
(d) The benefits and costs can be ex-
pressed in terms of PW, AW, or FW.
9.39 In a conventional B/C ratio,
(a) Disbenefits and M&O costs are sub-
tracted from benefits.
(b) Disbenefits are subtracted from
benefits, and M&O costs are added to
costs.
(c) Disbenefits and M&O costs are
added to costs.
(d) Disbenefits are added to costs, and
M&O costs are subtracted from
benefits.
9.40 In a modified B/C ratio analysis,
(a) Disbenefits and M&O costs are sub-
tracted from benefits.
(b) Disbenefits are subtracted from
benefits, and M&O costs are added
to costs.
(c) Disbenefits and M&O costs are
added to costs.
(d) Disbenefits are added to costs, and
M&O costs are subtracted from
benefits.
9.41 An alternative has the following cash
flows: benefits ϭ $60,000 per year,
disbenefits ϭ $17,000 per year, and
costs ϭ $35,000 per year. The B/C ratio
FE REVIEW PROBLEMS 341
MASTER ➀
bla18632_ch09.qxd 08/20/2004 5:44 PM Page 341
31. MASTER ➀
342 CHAPTER 9 Benefit/Cost Analysis and Public Sector Economics
COSTS TO PROVIDE LADDER TRUCK SERVICE
FOR FIRE PROTECTION
For many years, the city of Medford has paid a neighboring city (Brewster) for the
use of its ladder truck when needed. The charges for the last few years have been
$1000 per event when the ladder truck is only dispatched to a site in Medford, and
$3000 each time the truck is activated. There has been no annual fee charged. With
the approval of the Brewster city manager, the newly hired fire chief has presented
a substantially higher cost to the Medford fire chief for the use of the ladder truck:
Annual flat fee $30,000 with 5 years’ fees paid up front (now)
Dispatch fee $3000 per event
Activation fee $8000 per event
The Medford chief has developed an alternative to purchase a ladder truck, with
the following cost estimates for the truck and the fire station addition to house it:
Truck:
Initial cost $850,000
Life 15 years
Cost per dispatch $2000 per event
Cost per activation $7000 per event
Building:
Initial cost $500,000
Life 50 years
The chief has also taken data from a study completed last year and updated it. The
study estimated the insurance premium and property loss reductions that the
citizenry experienced by having a ladder truck available. The past savings and cur-
rent estimates, if Medford had its own truck for more rapid response, are as follows:
Estimate If
Past Average Truck Is Owned
Insurance premium reduction, $/year 100,000 200,000
Property loss reduction, $/year 300,000 400,000
Additionally, the Medford chief obtained the average number of events for the
last 3 years and estimated the future use of the ladder truck. He believes there has
been a reluctance to call for the truck from Brewster in the past.
Estimate If
Past Average Truck Is Owned
Number of dispatches per year 10 15
Number of activations per year 3 5
EXTENDED EXERCISE
bla18632_ch09.qxd 08/20/2004 5:44 PM Page 342
32. MASTER ➀
CASE STUDY 343
Either the new cost structure must be accepted, or a truck must be purchased. The
option to have no ladder truck service is not acceptable. Medford has a good
rating for its bonds; a discount rate of 6% per year is used for all proposals.
Questions
Use a spreadsheet to do the following.
1. Perform an incremental B/C evaluation to determine if Medford should
purchase a ladder truck.
2. Several of the new city council members are “up in arms” over the new an-
nual fee and cost structure. However, they do not want to build more fire
station capacity or own a ladder truck that will be used an average of only
20 times per year. They believe that Brewster can be convinced to reduce or
remove the annual $30,000 fee. How much must the annual fee be reduced
for the alternative to purchase the ladder truck to be rejected?
3. Another council member is willing to pay the annual fee, but wants to know
how much the building cost can change from $500,000 to make the alter-
natives equally attractive. Find this first cost for the building.
4. Finally, a compromise proposal offered by the Medford mayor might be ac-
ceptable to Brewster. Reduce the annual fee by 50%, and reduce the per
event charges to the same amount that the Medford fire chief estimates
it will cost if the truck is owned. Then Medford will possibly adjust (if it
seems reasonable) the sum of the insurance premium reduction and prop-
erty loss reduction estimates to just make the arrangement with Brewster
more attractive than owning the truck. Find this sum (for the estimates of
premium reduction and property loss reduction). Does this new sum seem
reasonable relative to the previous estimates?
Introduction
Anumber of studies have shown that a disproportionate
number of freeway traffic accidents occur at night.
There are a number of possible explanations for this,
one of which might be poor visibility. In an effort to
determine whether freeway lighting was economically
beneficial for reducing nighttime accidents, data were
collected regarding accident frequency rates on lighted
and unlighted sections of certain freeways. This case
study is an analysis of part of those data.
Background
The Federal Highway Administration (FHWA) places
value on accidents depending on the severity of the
crash. There are a number of crash categories, the
most severe of which is fatal. The cost of a fatal acci-
dent is placed at $2.8 million. The most common type
of accident is not fatal or injurious and involves only
property damage. The cost of this type of accident
is placed at $4500. The ideal way to determine
whether lights reduce traffic accidents is through
CASE STUDY
FREEWAY LIGHTING
bla18632_ch09.qxd 08/20/2004 5:44 PM Page 343
33. MASTER ➀
344 CHAPTER 9 Benefit/Cost Analysis and Public Sector Economics
Freeway Accident Rates, Lighted and Unlighted
Unlighted Lighted
Accident Type Day Night Day Night
Fatal 3 5 4 7
Incapaciting 10 6 28 22
Evident 58 20 207 118
Possible 90 35 384 161
Property damage 379 199 2069 839
Totals 540 265 2697 1147
Source: Michael Griffin, “Comparison of the Safety of Lighting Options on Urban Free-
ways,” Public Roads, 58 (Autumn 1994), pp. 8–15.
before-and-after studies on a given section of free-
way. However, this type of information is not readily
available, so other methods must be used. One such
method compares night to day accident rates for
lighted and unlighted freeways. If lights are benefi-
cial, the ratio of night to day accidents will be lower
on the lighted section than on the unlighted one. If
there is a difference, the reduced accident rate can be
translated into benefits which can be compared to the
cost of lighting to determine its economic feasibility.
This technique is used in the following analysis.
Economic Analysis
The results of one particular study conducted over a
5-year period are shown on the following page. For il-
lustrative purposes, only the property damage cate-
gory will be considered.
The ratios of night to day accidents involving
property damage for the unlighted and lighted freeway
sections are 199͞379 ϭ 0.525 and 839͞2069 ϭ 0.406,
respectively. These results indicate that the lighting
was beneficial. To quantify the benefit, the accident-
rate ratio from the unlighted section will be applied to
the lighted section. This will yield the number of acci-
dents that were prevented. Thus, there would have
been (2069)(0.525) ϭ 1086 accidents instead of the
839 if there had not been lights on the freeway. This is
a difference of 247 accidents. At a cost of $4500 per
accident, this results in a net benefit of
B ϭ (247)($4500) ϭ $1,111,500
To determine the cost of the lighting, it will be as-
sumed that the light poles are center poles 67 me-
ters apart with 2 bulbs each. The bulb size is 400 watts,
and the installation cost is $3500 per pole. Since
these data were collected over 87.8 kilometers
(54.5 miles) of lighted freeway, the installed cost of
the lighting is
Installation cost ϭ $3500
ϭ 3500(1310.4)
ϭ $4,586,400
The annual power cost based on 1310 poles is
Annual power cost
ϭ 1310 poles(2 bulbs/pole)(0.4 kilowatts/bulb)
ϫ (12 hours/day)(365 days/year)
ϫ ($0.08/kilowatt-hour)
ϭ $367,219 per year
These data were collected over a 5-year period. There-
fore, the annualized cost C at i ϭ 6% per year is
Total annual cost ϭ $4,586,400(A͞P,6%,5)
ϩ 367,219
ϭ $1,456,030
87.8
ᎏ
0.067
bla18632_ch09.qxd 08/20/2004 5:44 PM Page 344
34. MASTER ➀
CASE STUDY 345
The B/C ratio is
B/C ϭ ϭ 0.76
Since B/C Ͻ 1, the lighting is not justified on the basis
of property damage alone. To make a final determina-
tion about the economic viability of the lighting, the
benefits associated with the other accident categories
would obviously also have to be considered.
Case Study Exercises
1. What would the B/C ratio be if the light poles
were twice as far apart as assumed above?
$1,111,500
ᎏᎏ
$1,456,030
2. What is the ratio of night to day accidents for
fatalities?
3. What would the B/C ratio be if the installation
cost were only $2500 per pole?
4. How many accidents would be prevented on
the unlighted portion of freeway if it were
lighted? Consider the property damage cate-
gory only.
5. Using only the category of property damage,
what would the lighted night-to-day accident
ratio have to be for the lighting to be economi-
cally justified?
bla18632_ch09.qxd 08/20/2004 5:44 PM Page 345