Download as PDF, PPTX


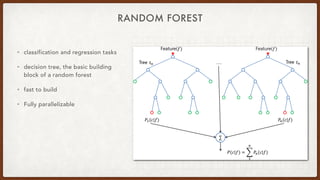

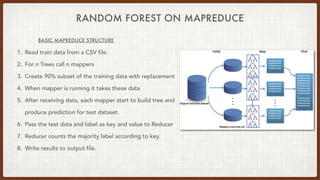

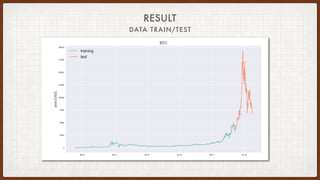
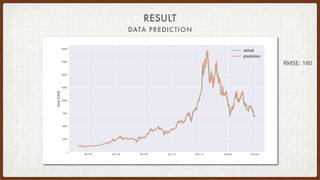
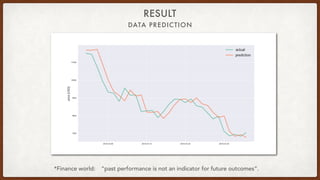


The document discusses a term project on bitcoin price detection using the Random Forest algorithm in the context of big data analysis. It outlines cryptocurrency data such as open, high, low, close prices, and volumes, as well as the methodology employed in building the Random Forest model, including training and prediction processes. The results illustrate the use of the model, highlighting the importance of understanding past performance in predicting future outcomes.