This document describes analyzing biometric sample data to evaluate a system's performance. It includes:
1) Plotting score distributions to visualize genuine and imposter data.
2) Generating a DET curve to evaluate accuracy at different operating points and determine equal error rate.
3) Calculating an optimal operating point that minimizes total costs based on false accept and reject rates.
The analysis uses MATLAB to load sample data, calculate performance metrics, and plot the results. Key results include an equal error rate of 0.08611 and optimal operating point with 0.02333 false accept rate and 0.1092 false reject rate minimizing total cost to 1.6725.


![Two samplefiles G.dat and I.datwith genuine and imposter sample scores
respectively were given and the following should be obtained from those.
Plot the scoredistributions for both
DET curve
Determining EER
Operation point to minimize the cost
MATLAB 2013a has been used to show the requirements
Scores Distributioncurve
The following code has been used to generate the graph to plot the score for
distribution curve.
%Name: Shivakumar Koppad
clc;
clear all;
close all;
% Importing data
load('G.dat');
load('I.dat');
% Implementing G file
gen=[0 0 0 0 0 0 0 0 0 0];
for g=1:1:1200
if 0<=G(g)<0.1
gen(1)=gen(1)+1;
elseif 0.1<=G(g)<0.2
gen(2)=gen(2)+1;
elseif 0.2<=G(g)<0.3
gen(3)=gen(3)+1;
elseif 0.3<=G(g)<0.4
gen(4)=gen(4)+1;
elseif 0.4<=G(g)<0.5
gen(5)=gen(5)+1;
elseif 0.5<=G(g)<0.6
gen(6)=gen(6)+1;
elseif 0.6<=G(g)<0.7
gen(7)=gen(7)+1;
elseif 0.7<=G(g)<0.8
gen(8)=gen(8)+1;](https://image.slidesharecdn.com/65e66fd9-217d-4328-b6ef-e1d2aab38f99-150729133947-lva1-app6891/85/BIometrics-plotting-DET-and-EER-curve-using-Matlab-2-320.jpg)
![elseif 0.8<=G(g)<0.9
gen(9)=gen(9)+1;
else
gen(10)=gen(10)+1;
end
end
% Implementing I file
imp=[0 0 0 0 0 0 0 0 0 0];
for i=1:1:1200
if 0<=I(i)<0.1
imp(1)=imp(1)+1;
elseif 0.1<=I(i)<0.2
imp(2)=imp(2)+1;
elseif 0.2<=I(i)<0.3
imp(3)=imp(3)+1;
elseif 0.3<=I(i)<0.4
imp(4)=imp(4)+1;
elseif 0.4<=I(i)<0.5
imp(5)=imp(5)+1;
elseif 0.5<=I(i)<0.6
imp(6)=imp(6)+1;
elseif 0.6<=I(i)<0.7
imp(7)=imp(7)+1;
elseif 0.7<=I(i)<0.8
imp(8)=imp(8)+1;
elseif 0.8<=I(i)<0.9
imp(9)=imp(9)+1;
else
imp(10)=imp(10)+1;
end
end
% Defining Score
Score=[0 0.1 0.2 0.3 0.4 0.5 0.6 0.7 0.8 0.9];
hold on;
plot(Score,imp,'color','r');
plot(Score,gen,'color','b');
hold off;
xlabel('Scores')
ylabel('No. of users')
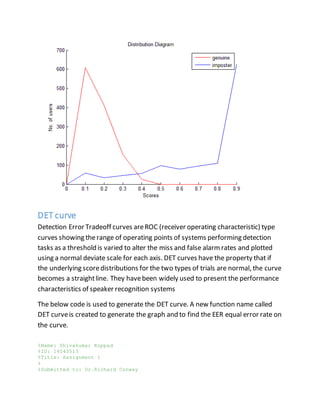
title('Distribution Diagram')
legend('genuine','imposter')
% End
Result:
In the below output of the graph, X-axis represents the scores and Y-axis
represents the count for both genuine and imposter users.](https://image.slidesharecdn.com/65e66fd9-217d-4328-b6ef-e1d2aab38f99-150729133947-lva1-app6891/85/BIometrics-plotting-DET-and-EER-curve-using-Matlab-3-320.jpg)
![function [TPR,FPR] = DETCurve(G,I)
load('G.dat');
load('I.dat');
% Creates a matrix
TPR = zeros(1, 1000);
FPR = zeros(1, 1000);
P = 1200;
N = 1200;
index = 0;
% Assume the threshold as 0.005
for threshold = 0:0.005:1
TP = 0;
FP = 0;
%Provides the genuine users count
for i = 1:1200
if (G(i) >= threshold)
TP = TP + 1;
end
end
% Provides the Imposters count
for i1 = 1:1200
if(I(i1) >= threshold)
FP = FP + 1;
end
end
index = index + 1;
% Calculating true positive rate
TPR(index) = TP/P;
% Calculating false positive rate
FPR(index) = FP/N;
end
% Calculating false negative rate(FNR) using TPR+FNR=1
FNR = (1-TPR);
x = 0:0.1:1;
y = x;
[x(i),y(i)] = polyxpoly(x,y,FPR,FNR);
fprintf('EER(X): %d n', x(i));
fprintf('EER(Y): %d n', y(i));
plot(FPR,FNR,'LineWidth',2, 'color','g');
hold on;
plot(x,y,x,1-y, 'color','r');
plot (x(i),y(i),'X','MarkerSize',10, 'LineWidth', 2,'Color','b');
hold off;
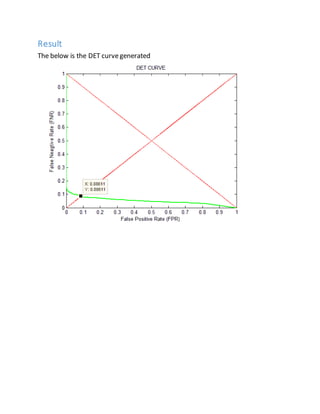
title('DET CURVE');
xlabel('False Positive Rate (FPR) ');
ylabel('False Neagtive Rate (FNR) ');
end](https://image.slidesharecdn.com/65e66fd9-217d-4328-b6ef-e1d2aab38f99-150729133947-lva1-app6891/85/BIometrics-plotting-DET-and-EER-curve-using-Matlab-5-320.jpg)
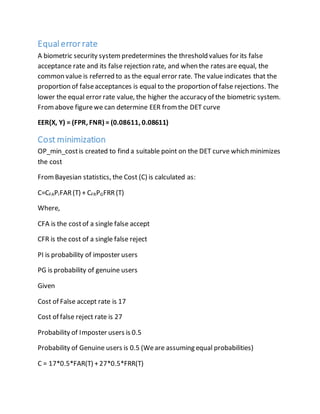
![C = 8.5*FAR(T) +13.5*FRR(T)
13.5*FRR(T) =C- 8.5*FAR(T)
FRR(T) = [C- 8.5*FAR(T)]/13.5
FRR(T) = -0.6296*FAR(T) +C/13.5
This is in the form of y= mx+c
The following code has been used to generate the graph which can be used to
find FRR(T) and FAR(T) the point operated to minimize the cost](https://image.slidesharecdn.com/65e66fd9-217d-4328-b6ef-e1d2aab38f99-150729133947-lva1-app6891/85/BIometrics-plotting-DET-and-EER-curve-using-Matlab-8-320.jpg)
![function [FAR, FRR] = OPcost(G,I)
load('G.dat');
load('I.dat');
%Creates a matrix
FRR = zeros(1, 1000);
FAR = zeros(1, 1000);
i = 1200;
j = 1200;
index = 0;
%Assume the threshold as 0.001
for threshold = 0:0.001:1
FN = 0;
FP = 0;
for i = 1:1200
if (G(i) <= threshold)
FN = FN + 1;
end
end
for i1 = 1:1000
if(I(i1) >= threshold)
FP = FP + 1;
end
end
index = index + 1;
FRR(index) = FN/i;
FAR(index) = FP/j;
end
hold on;
plot(FAR,FRR,'LineWidth',1,'color','c');
%To start with assume the minimum cost as 100
min = 100;
min_new=0;
for i1=1:1000
if 17*0.5*FAR(i1) + 27*0.5*FRR(i1) < min
min = 17*0.5*FAR(i1) + 27*0.5*FRR(i1);
min_new = i1;
end
end
plot(FAR(min_new),FRR(min_new),'x','MarkerSize',14);
Xmin = 0:0.05:1;
Ymin = (-0.33)*Xmin + 0.06989*min;
plot (Xmin,Ymin,'color', 'm');
hold off;
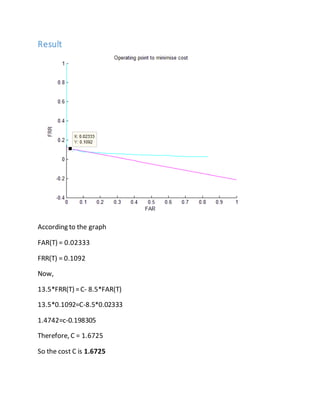
title('Operating point to minimise cost');
xlabel('FAR ');
ylabel('FRR ');](https://image.slidesharecdn.com/65e66fd9-217d-4328-b6ef-e1d2aab38f99-150729133947-lva1-app6891/85/BIometrics-plotting-DET-and-EER-curve-using-Matlab-9-320.jpg)