BIOLOGY GRAPHING LAB
•
1 like•3,621 views

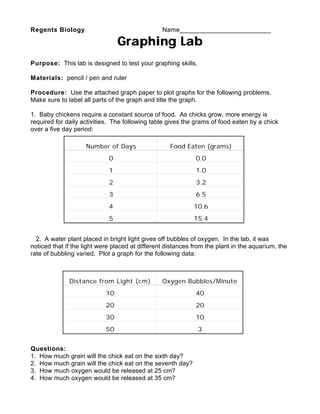
This document provides instructions for a lab involving graphing skills. Students are asked to plot two graphs using provided data tables - one showing the relationship between days and food eaten by a chick, and another showing the relationship between distance from light and oxygen bubbles released by a water plant. Students are then asked questions about predicting values from the graphed lines.

Recommended
More Related Content
Viewers also liked
Viewers also liked (12)
Similar to BIOLOGY GRAPHING LAB
Similar to BIOLOGY GRAPHING LAB (20)
More from M, Michelle Jeannite
More from M, Michelle Jeannite (20)
Recently uploaded
Recently uploaded (20)
BIOLOGY GRAPHING LAB
- 1. Regents Biology Name_________________________ Graphing Lab Purpose: This lab is designed to test your graphing skills. Materials: pencil / pen and ruler Procedure: Use the attached graph paper to plot graphs for the following problems. Make sure to label all parts of the graph and title the graph. 1. Baby chickens require a constant source of food. As chicks grow, more energy is required for daily activities. The following table gives the grams of food eaten by a chick over a five day period: 2. A water plant placed in bright light gives off bubbles of oxygen. In the lab, it was noticed that if the light were placed at different distances from the plant in the aquarium, the rate of bubbling varied. Plot a graph for the following data: Questions: 1. How much grain will the chick eat on the sixth day? 2. How much grain will the chick eat on the seventh day? 3. How much oxygen would be released at 25 cm? 4. How much oxygen would be released at 35 cm? Distance from Light (cm) Oxygen Bubbles/Minute 10 40 20 20 30 10 50 3 Number of Days Food Eaten (grams) 0 0.0 1 1.0 2 3.2 3 6.5 4 10.6 5 15.4