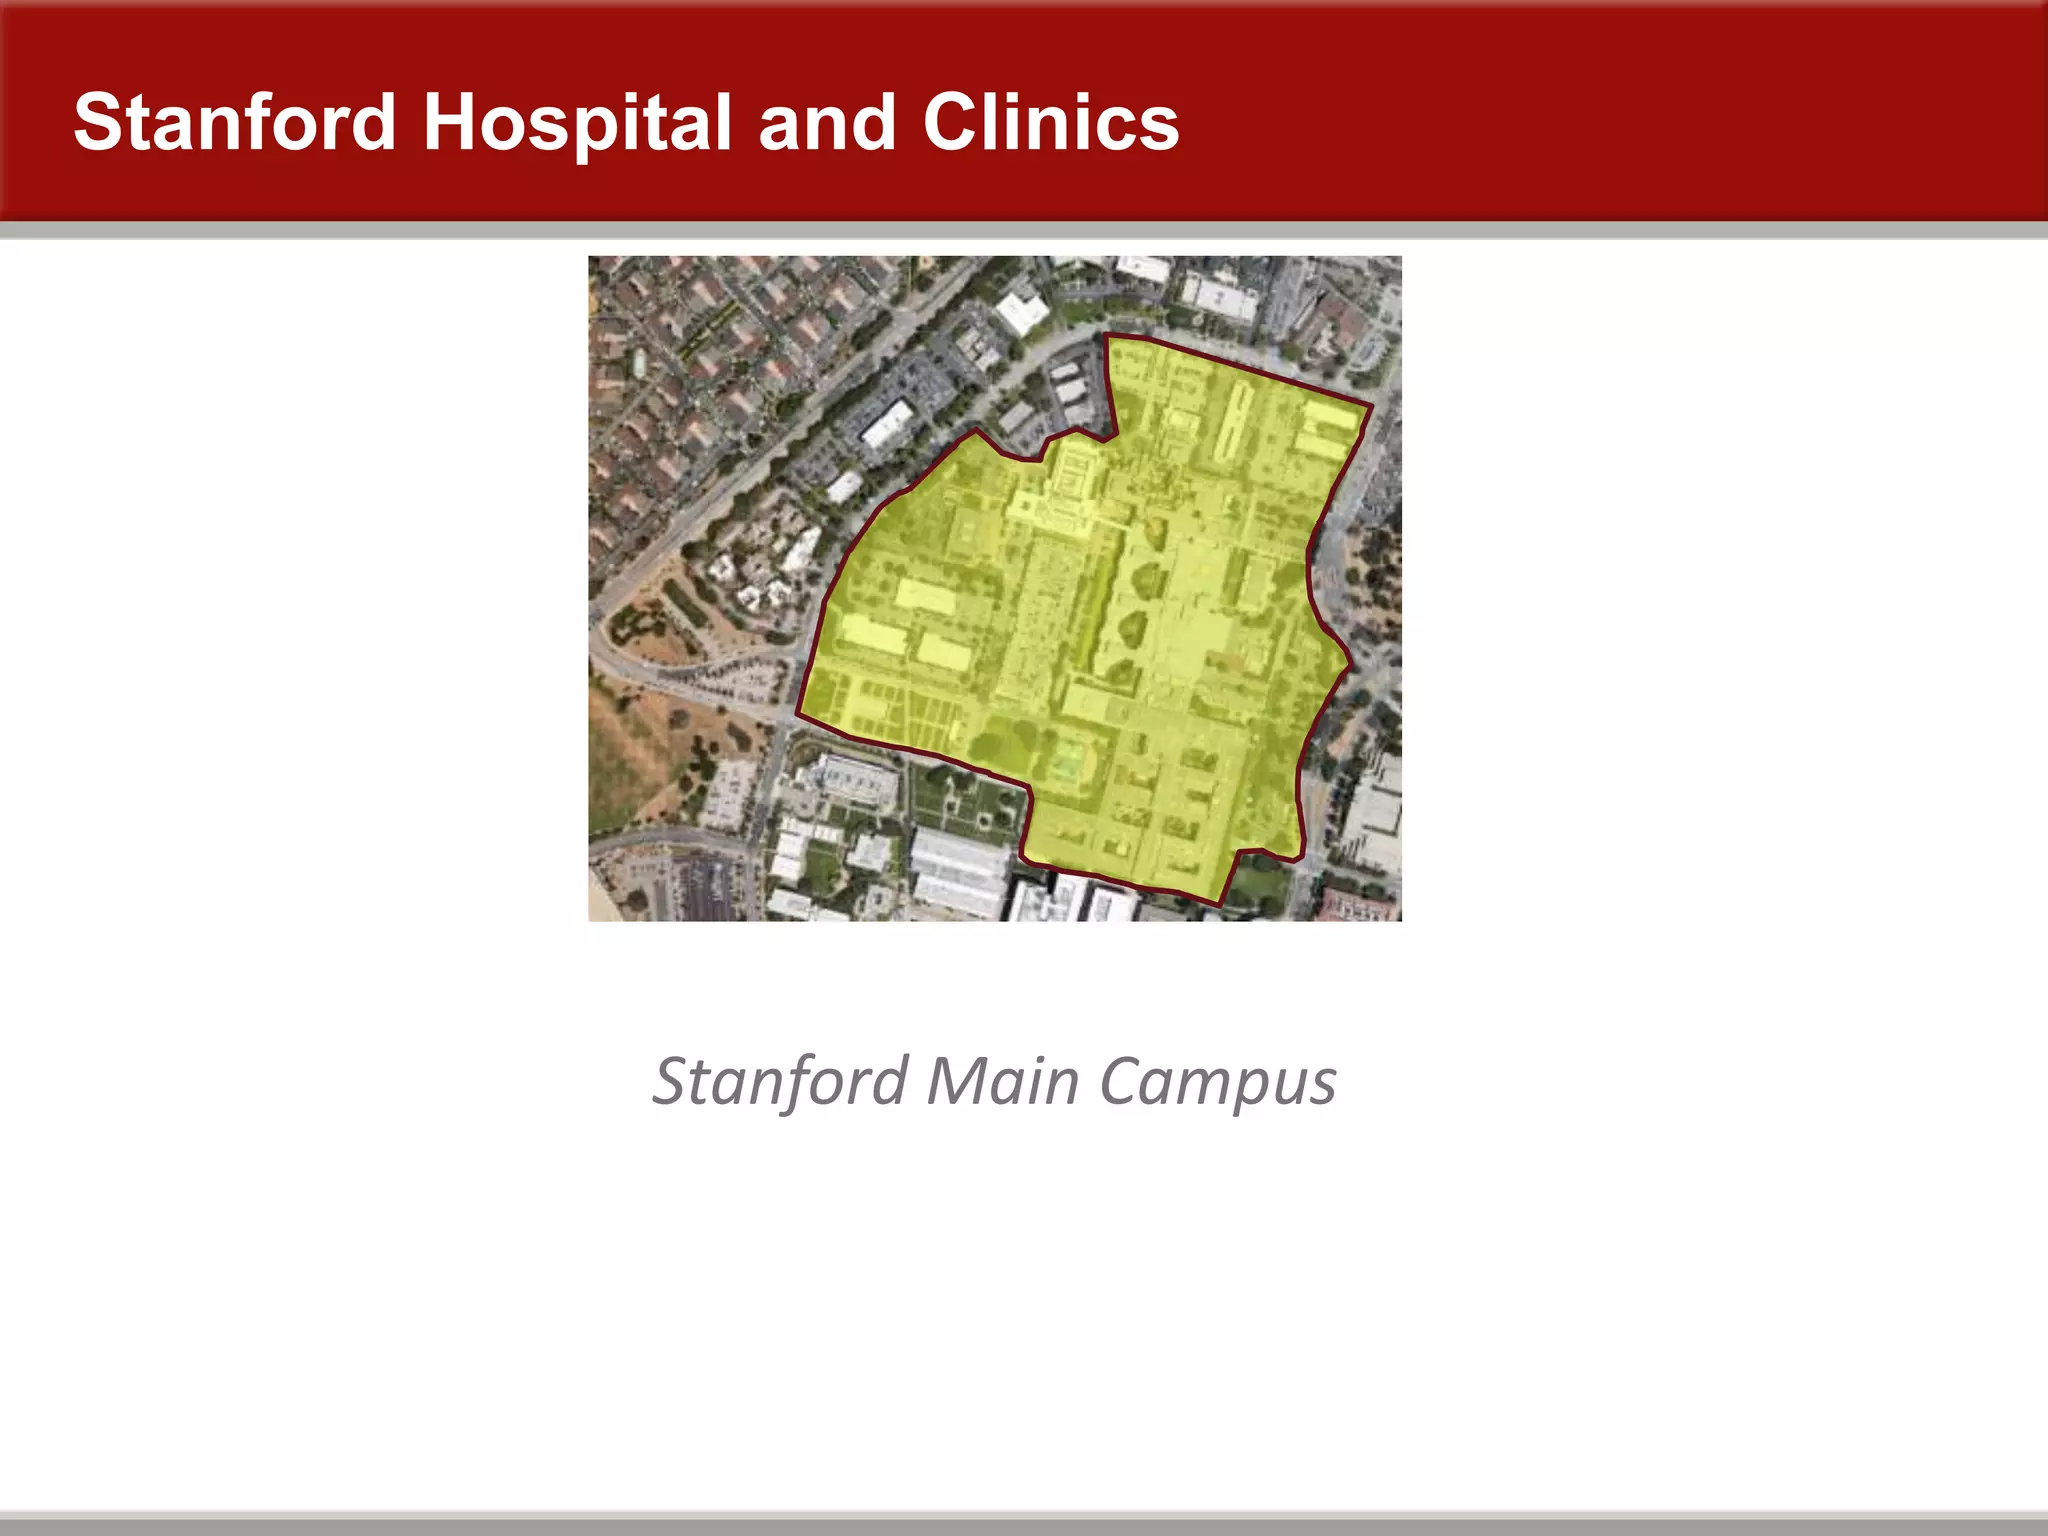
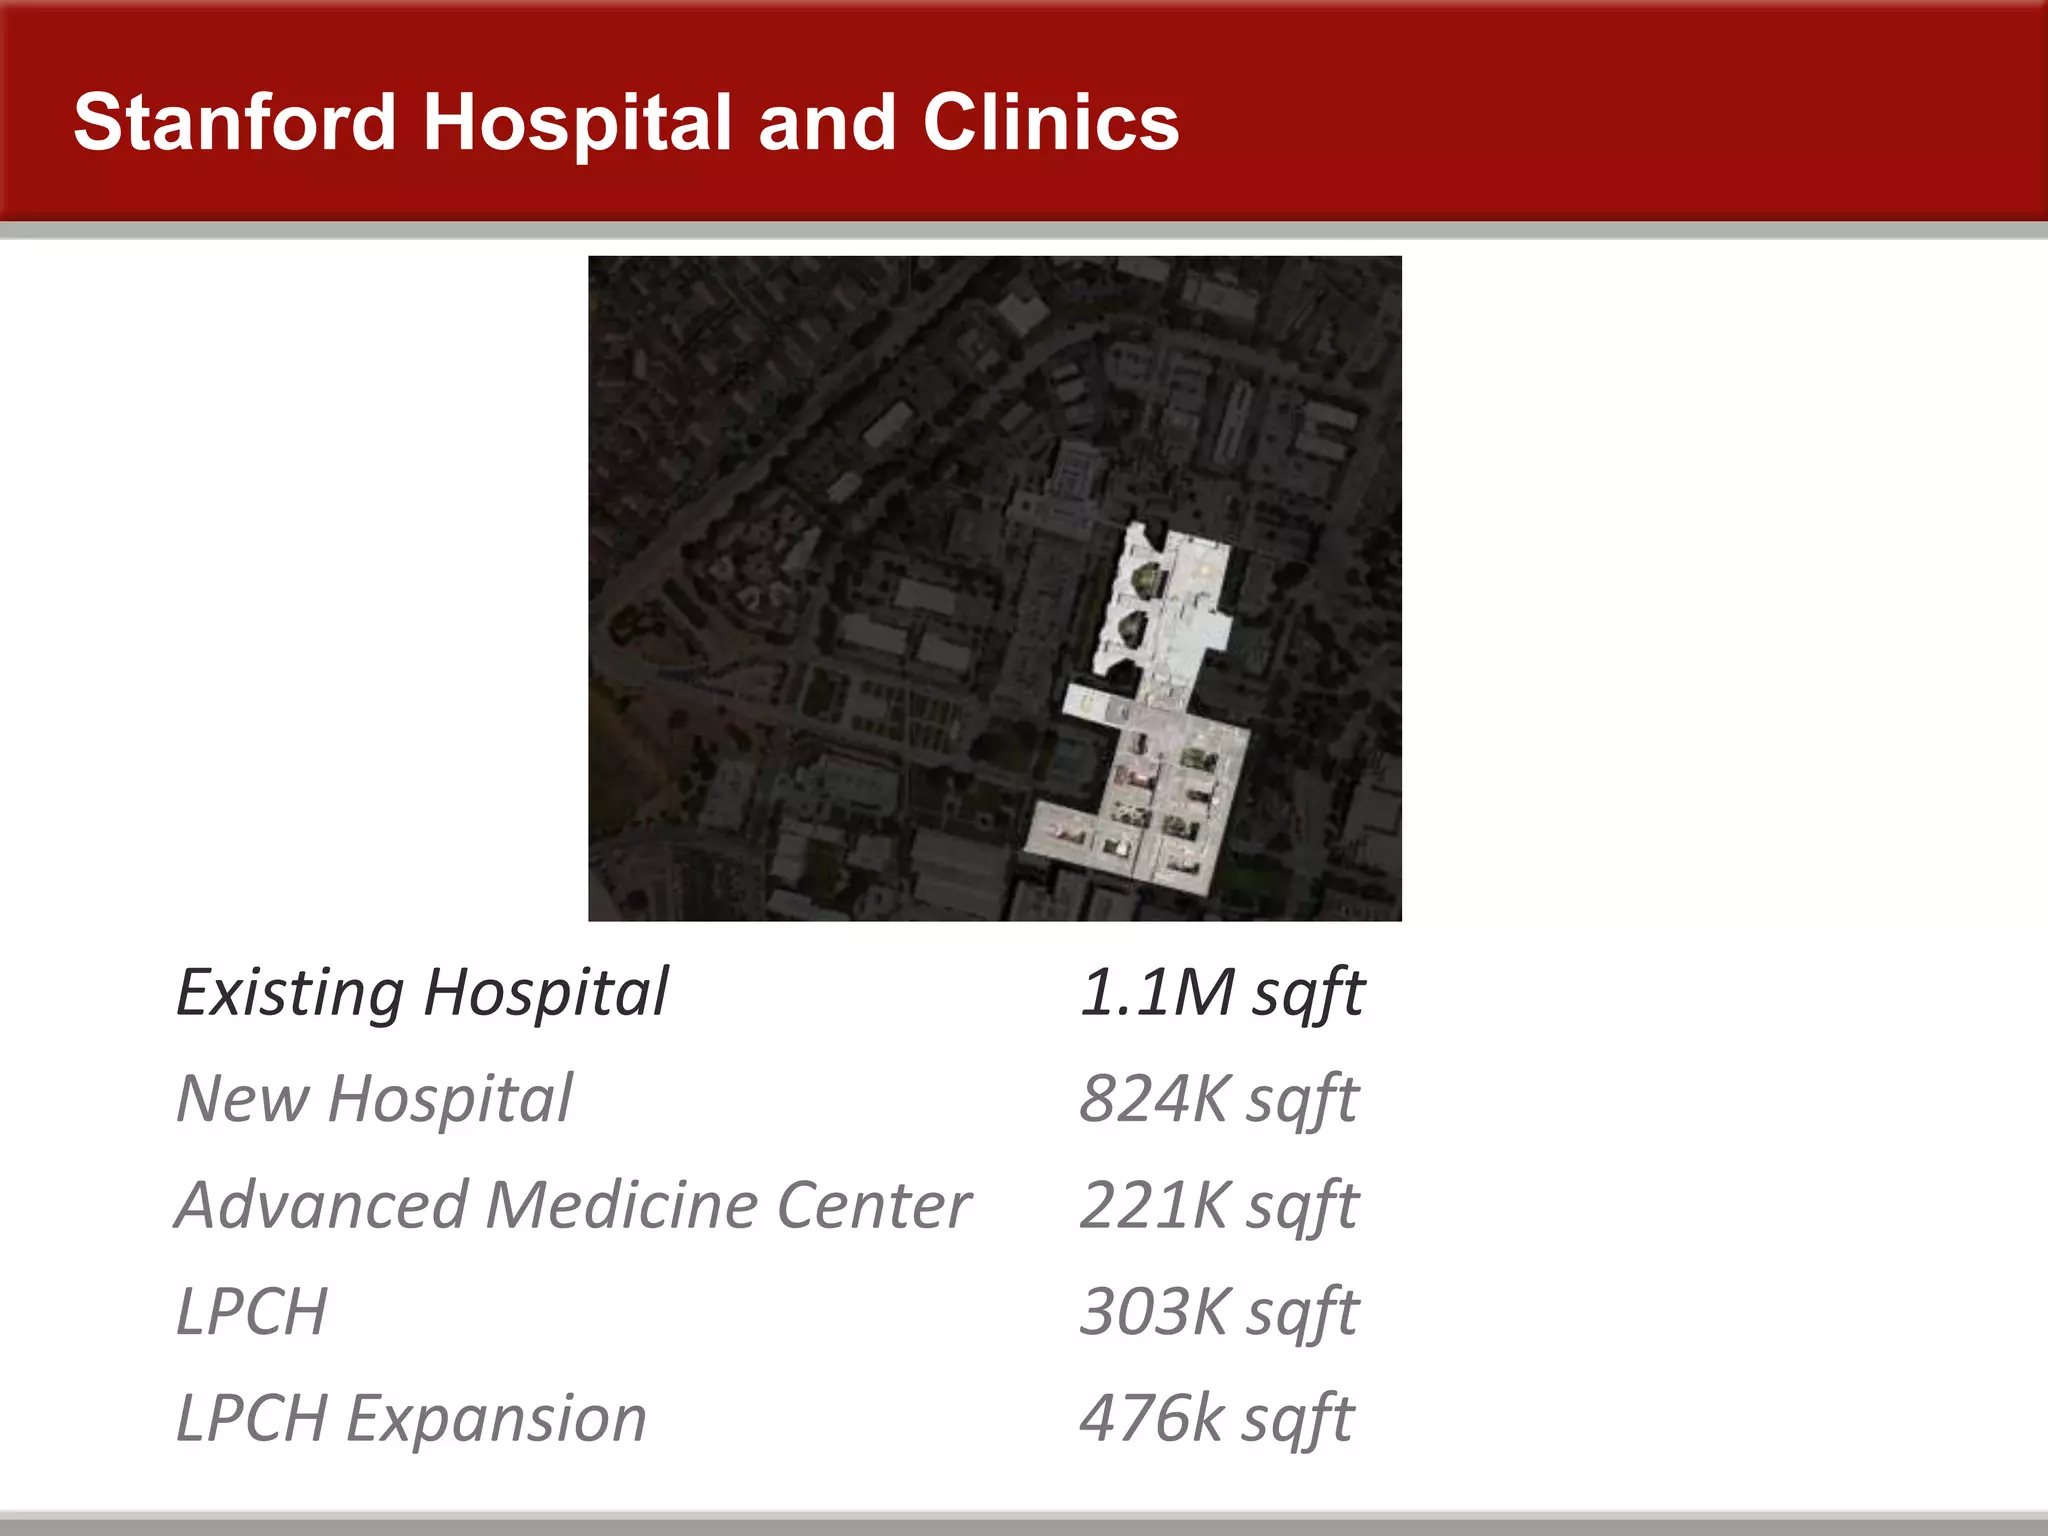
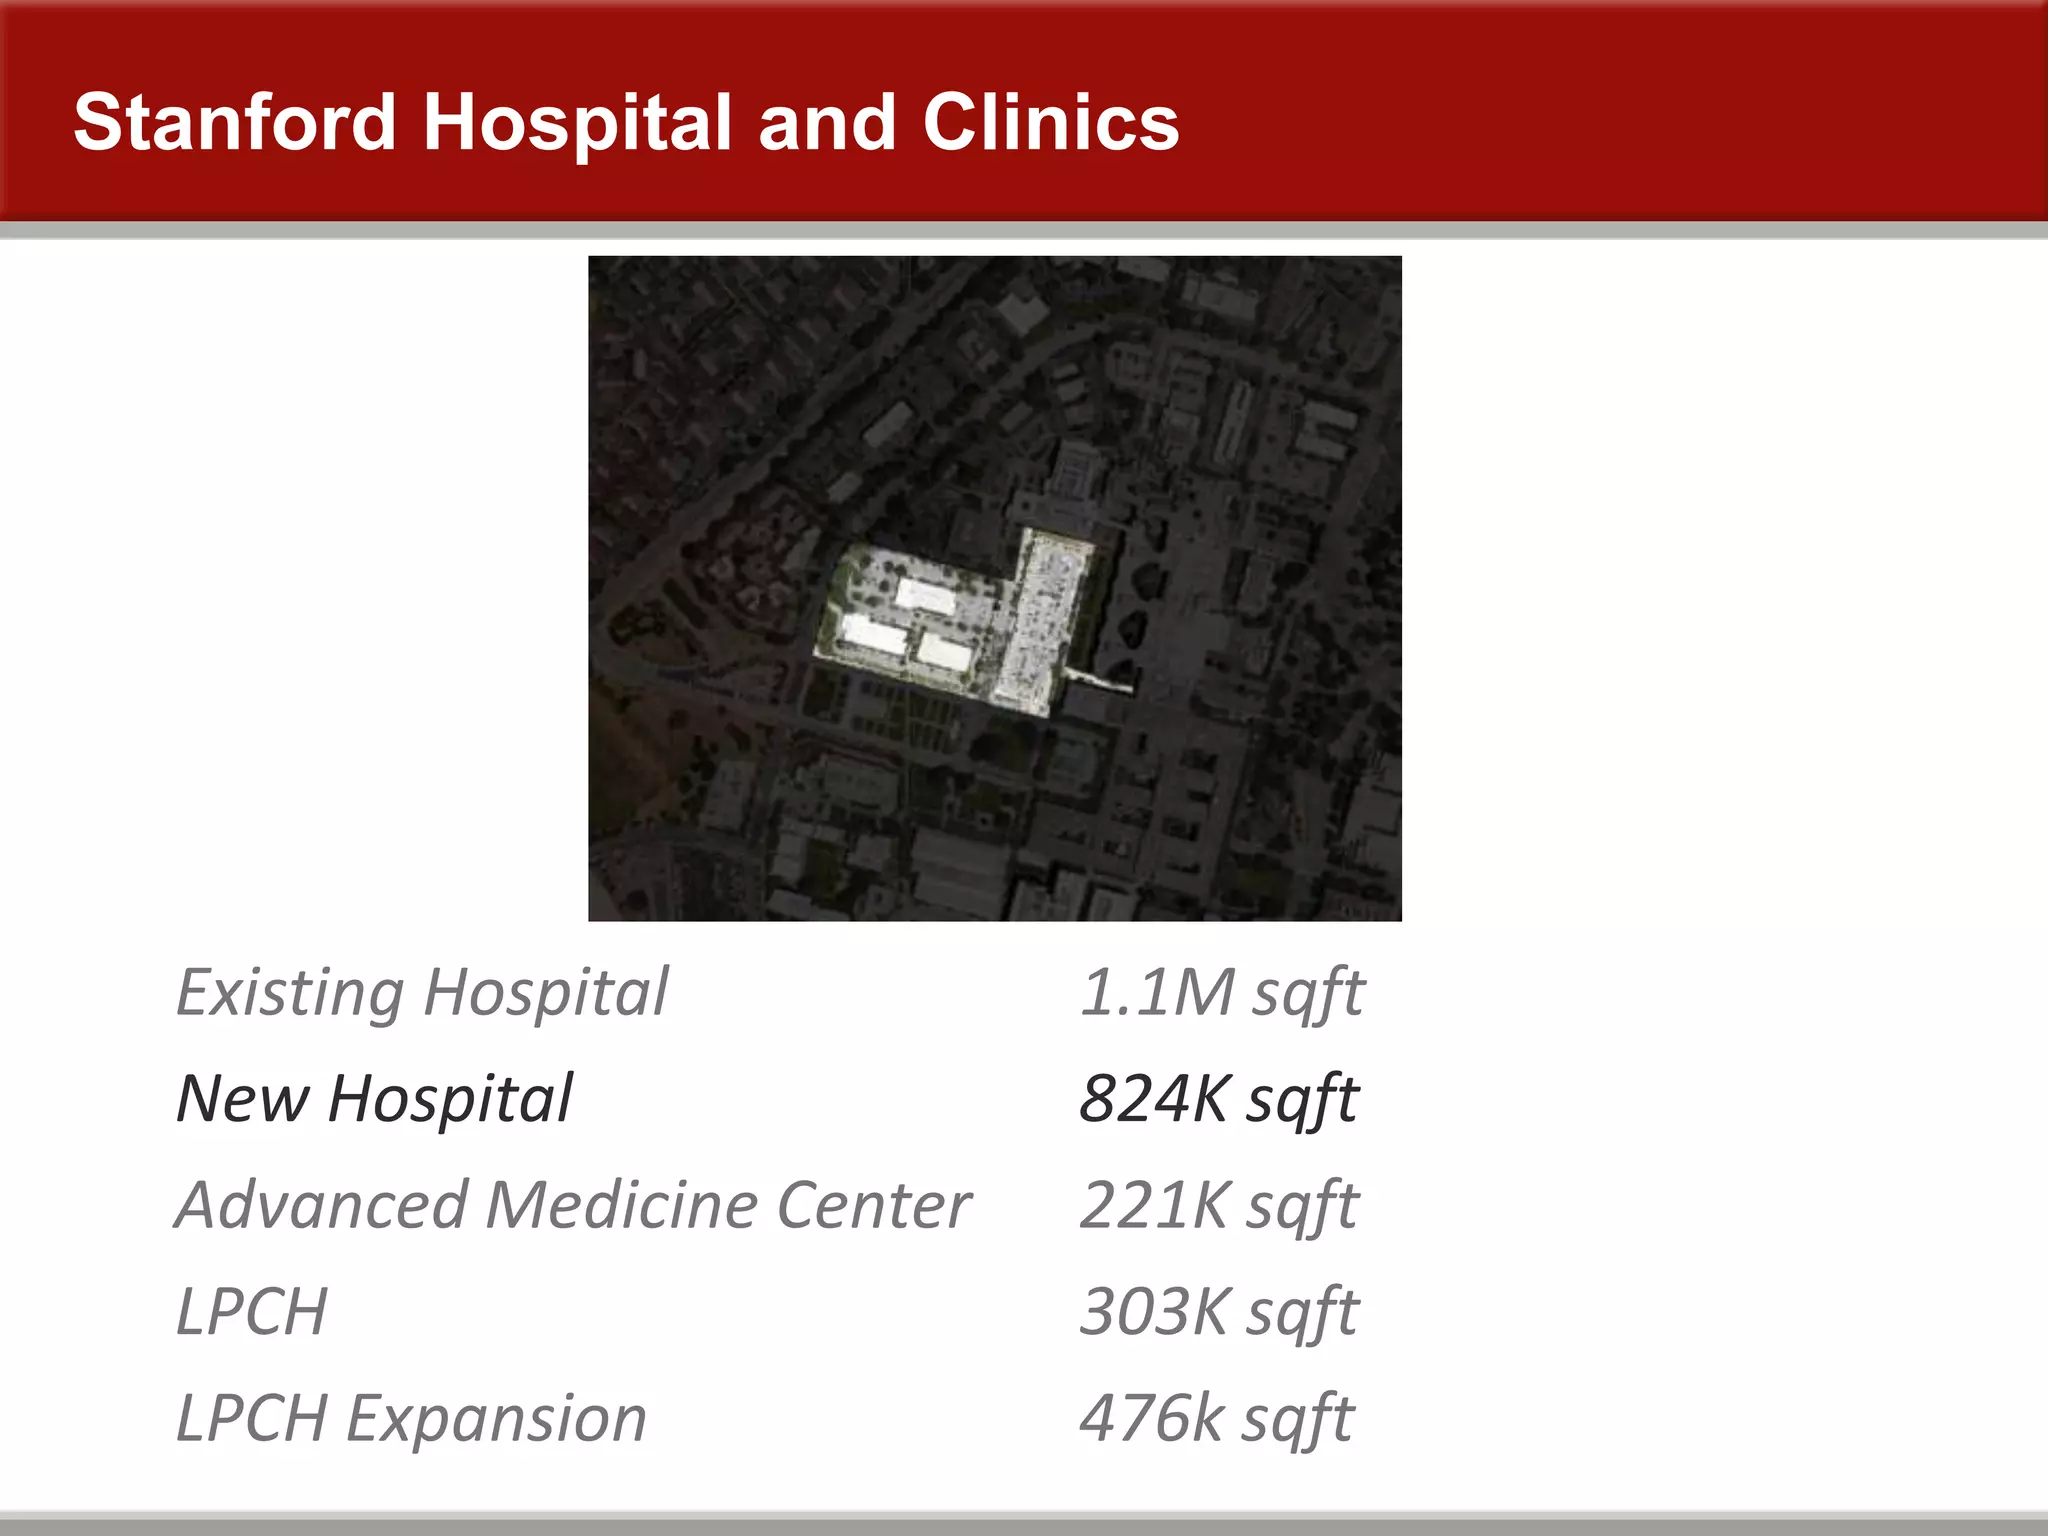
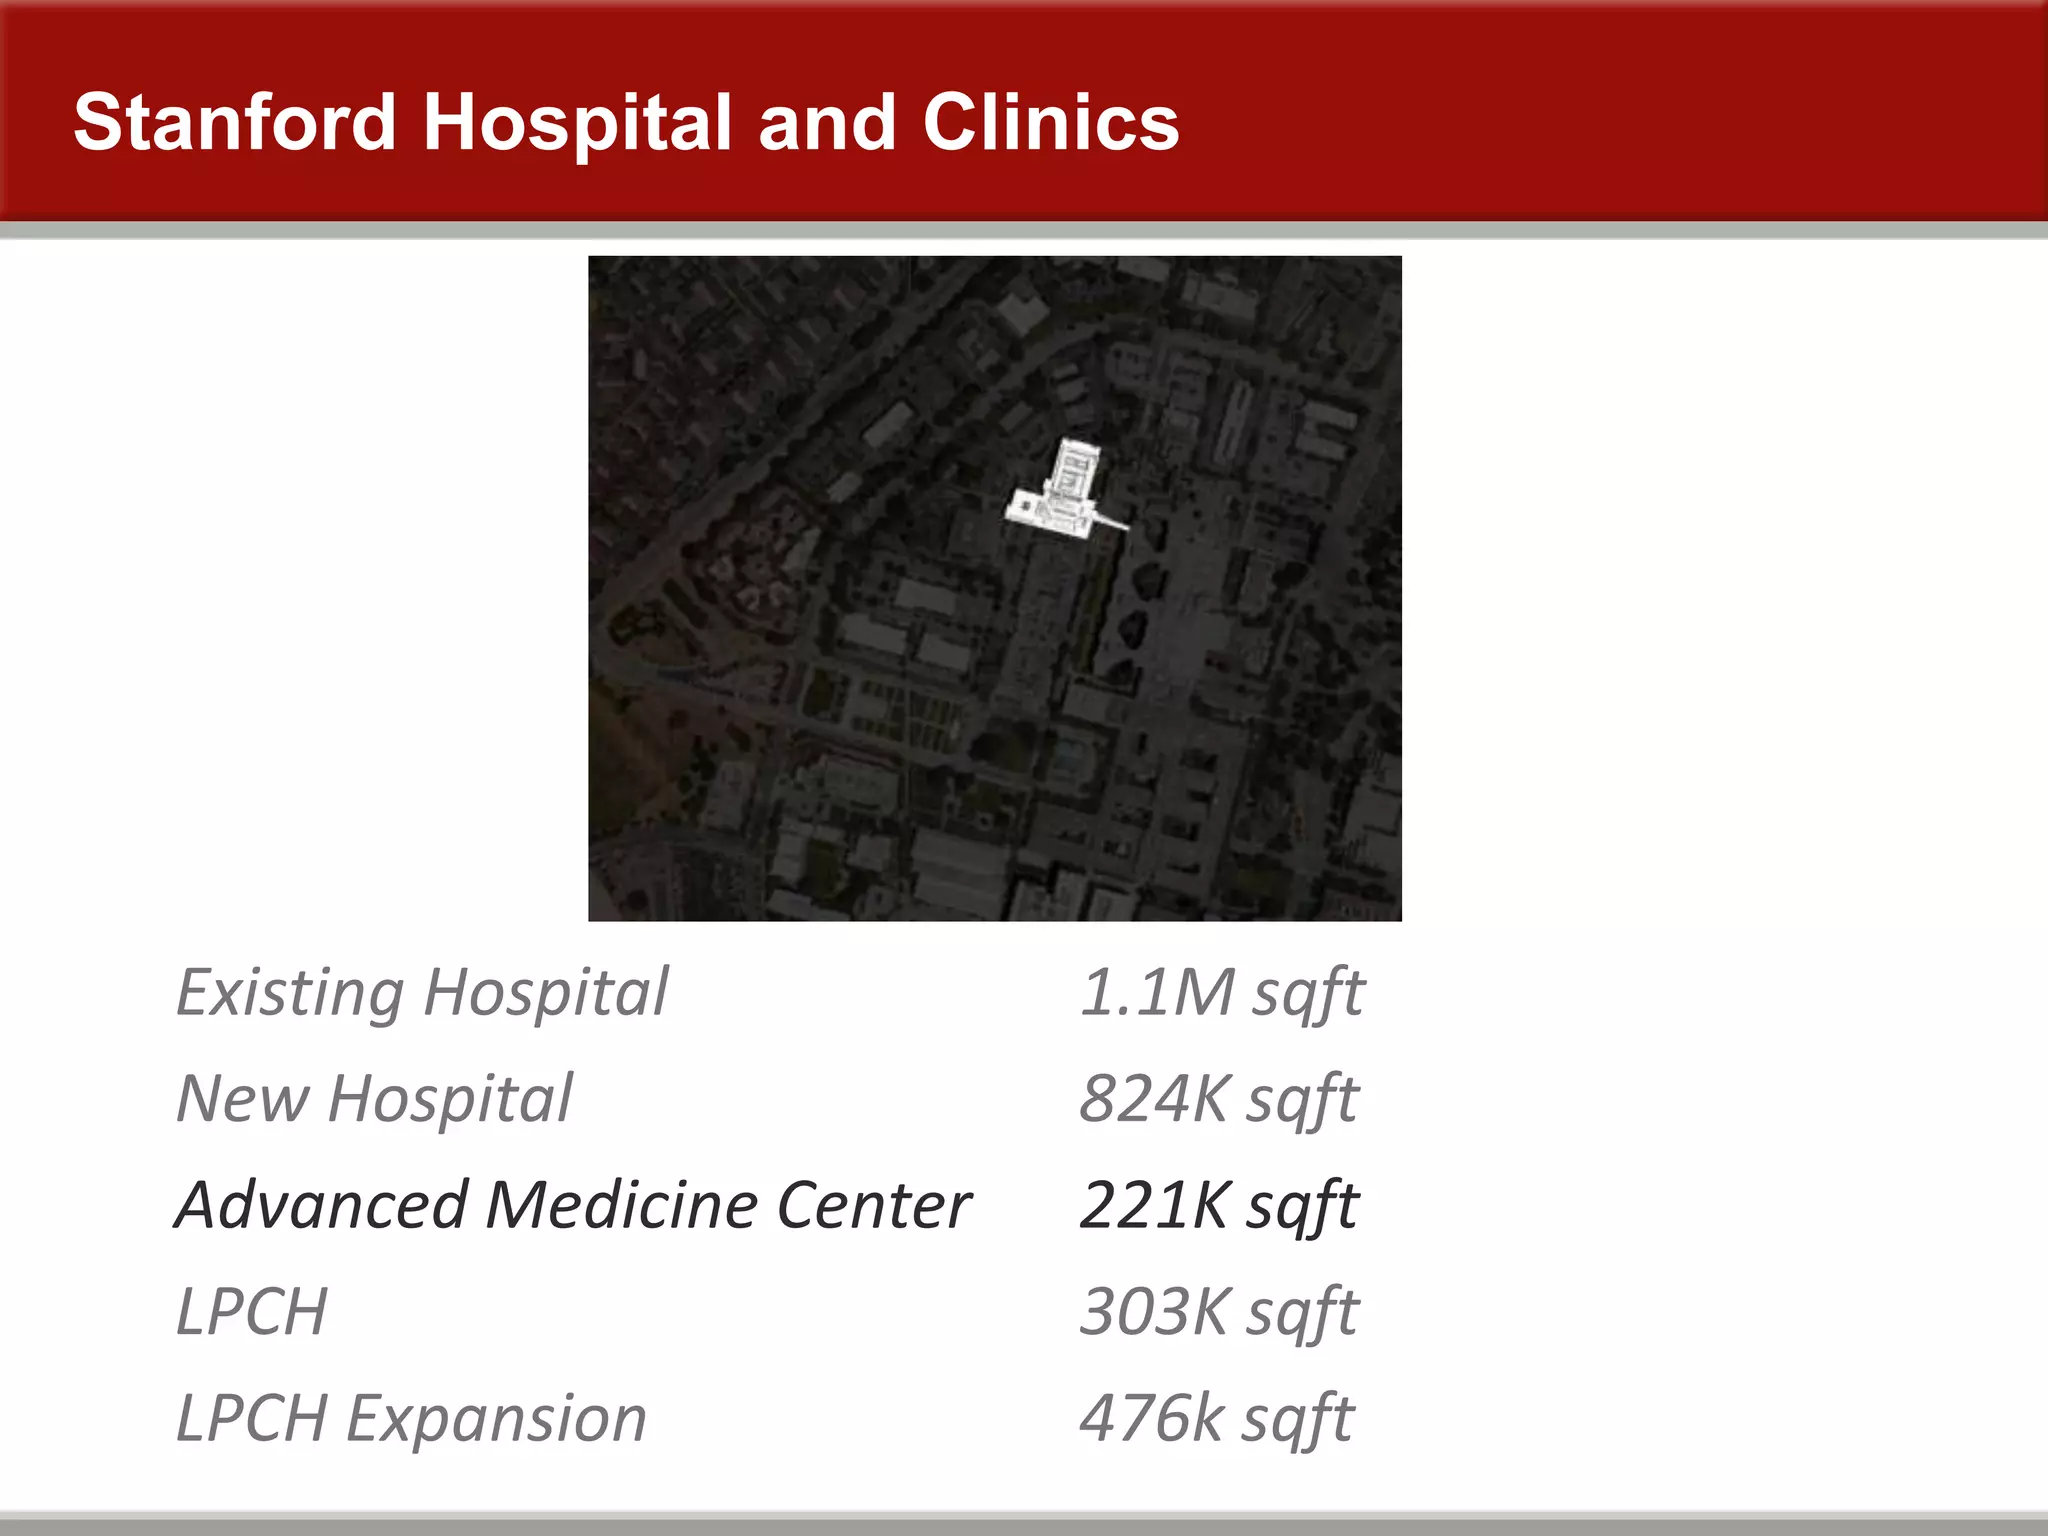
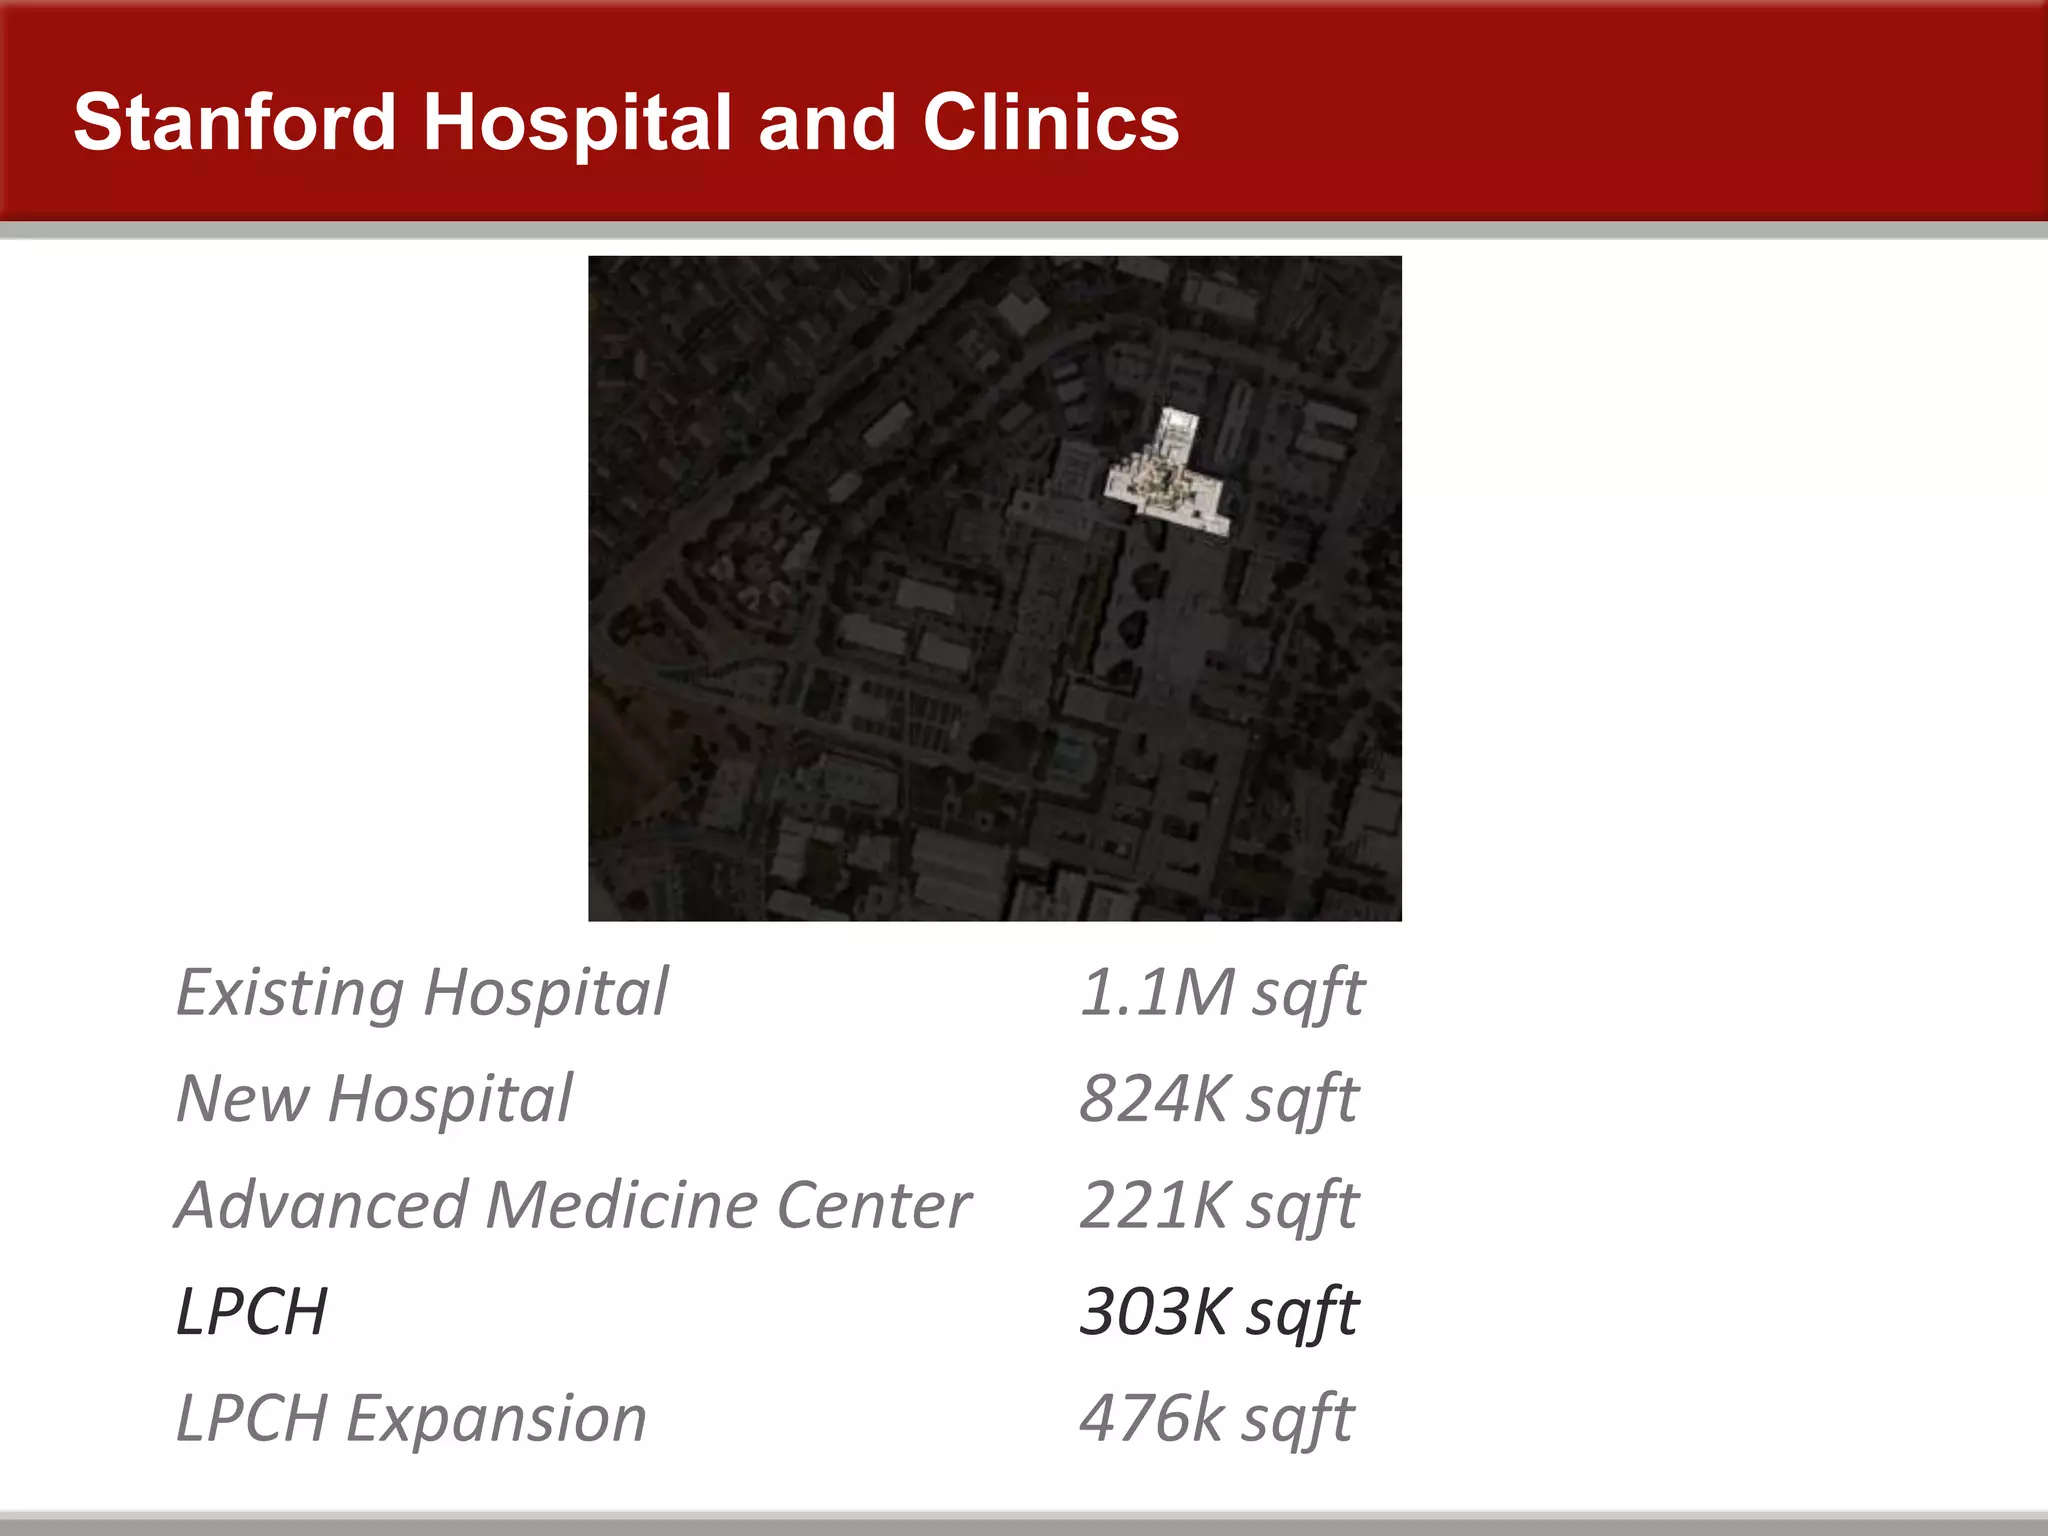
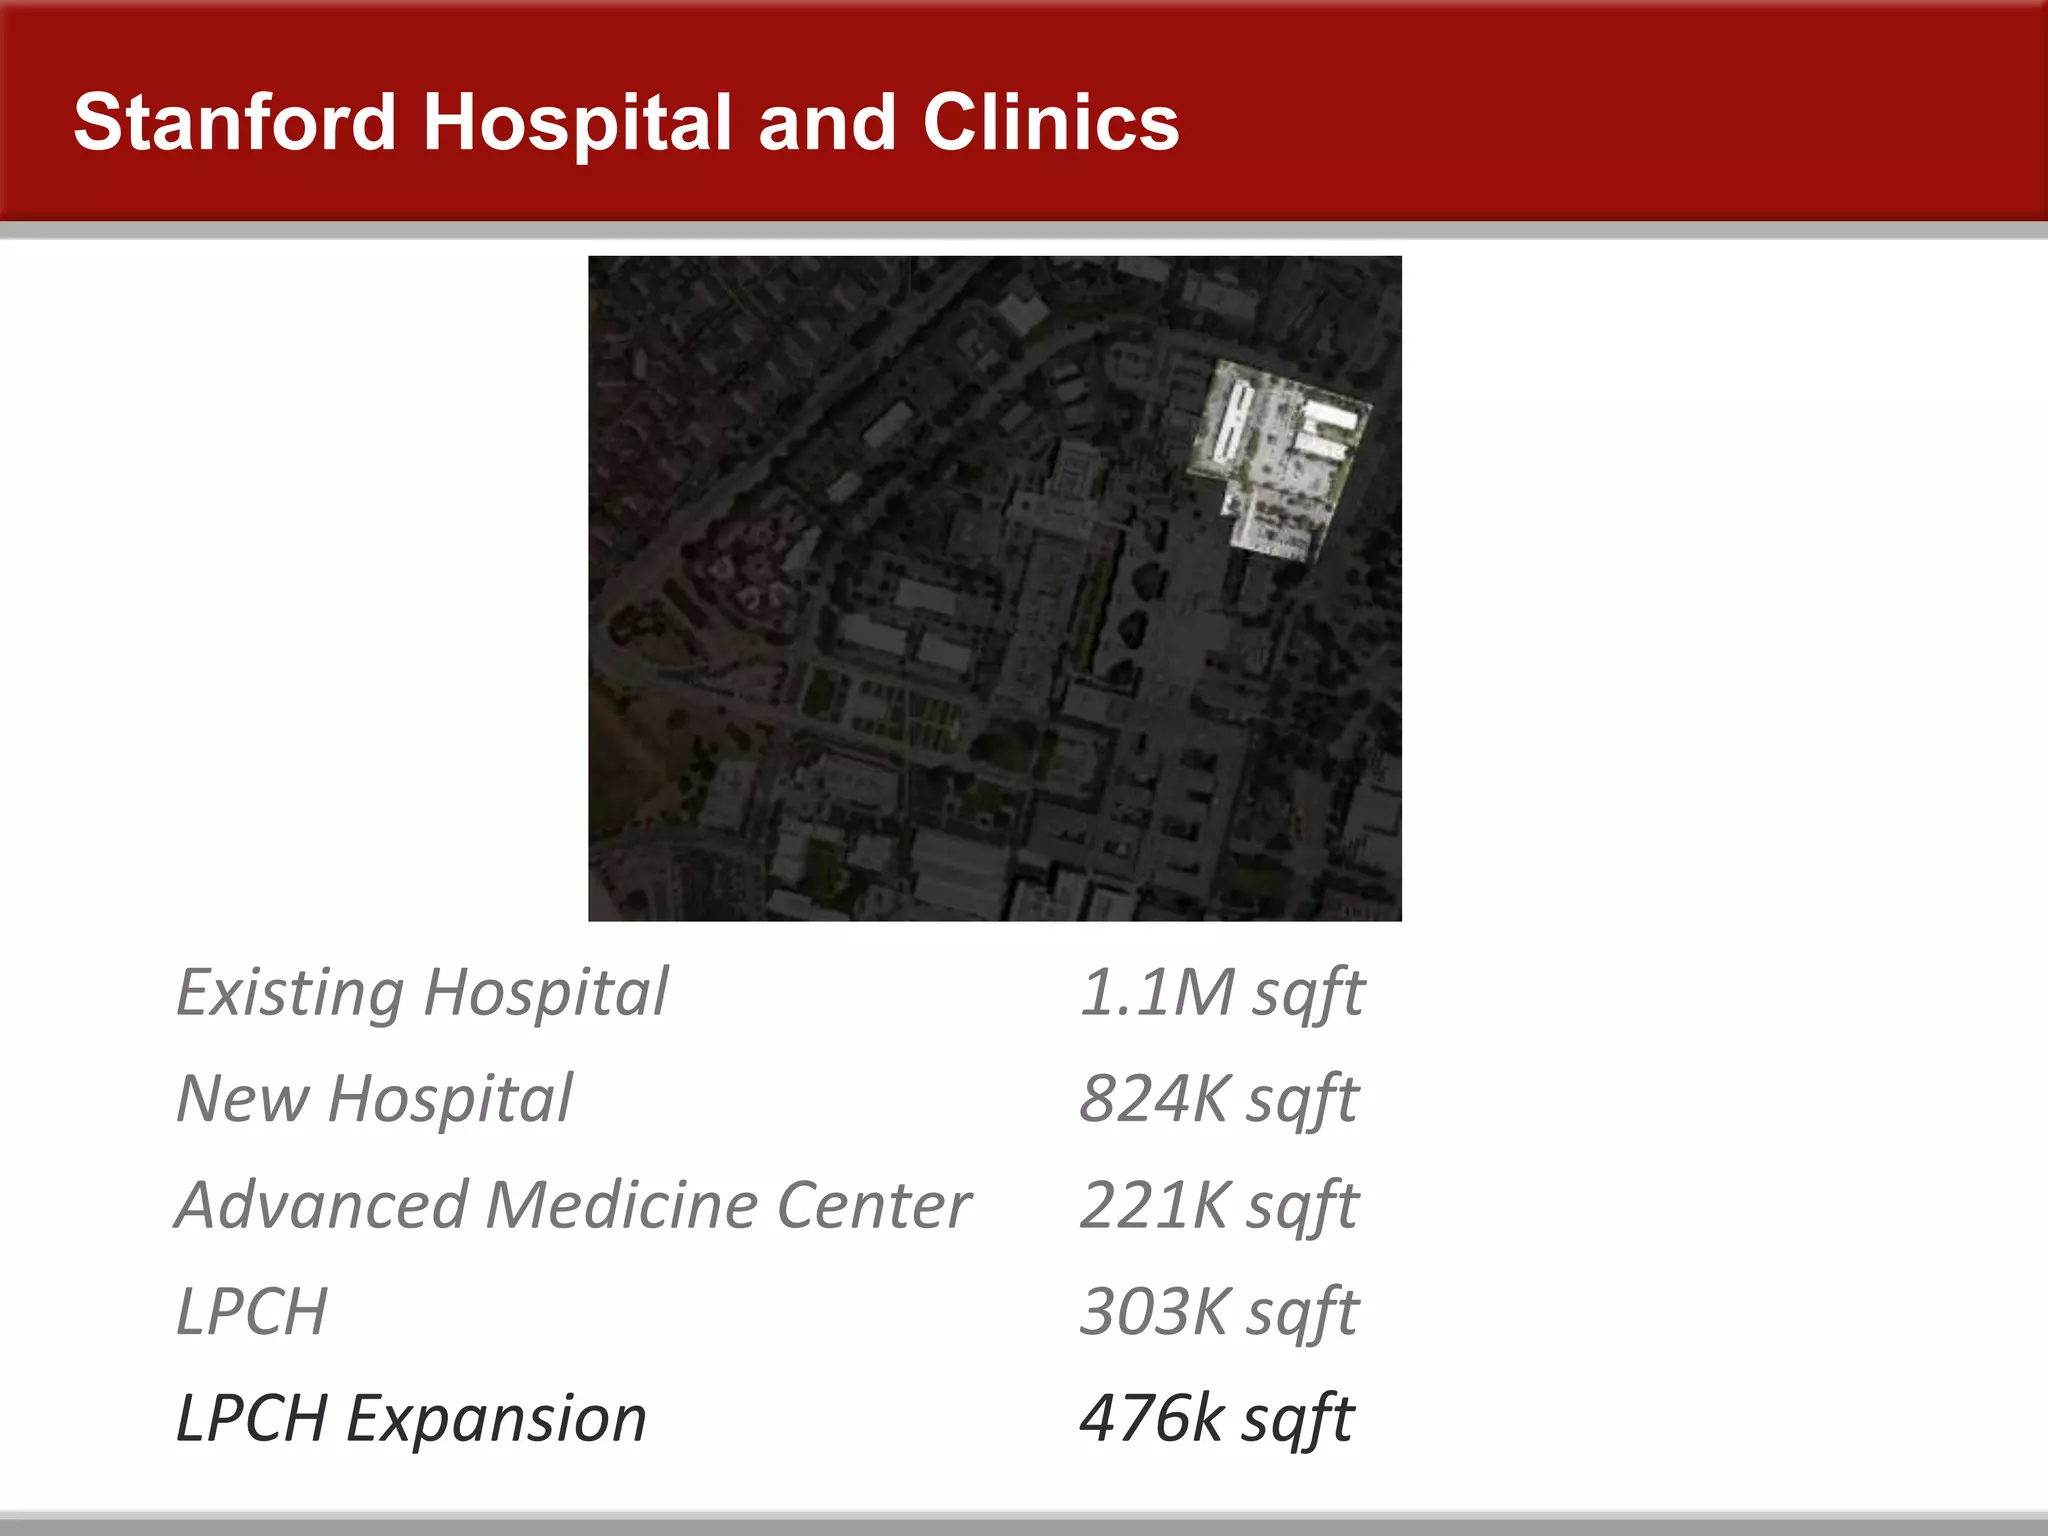
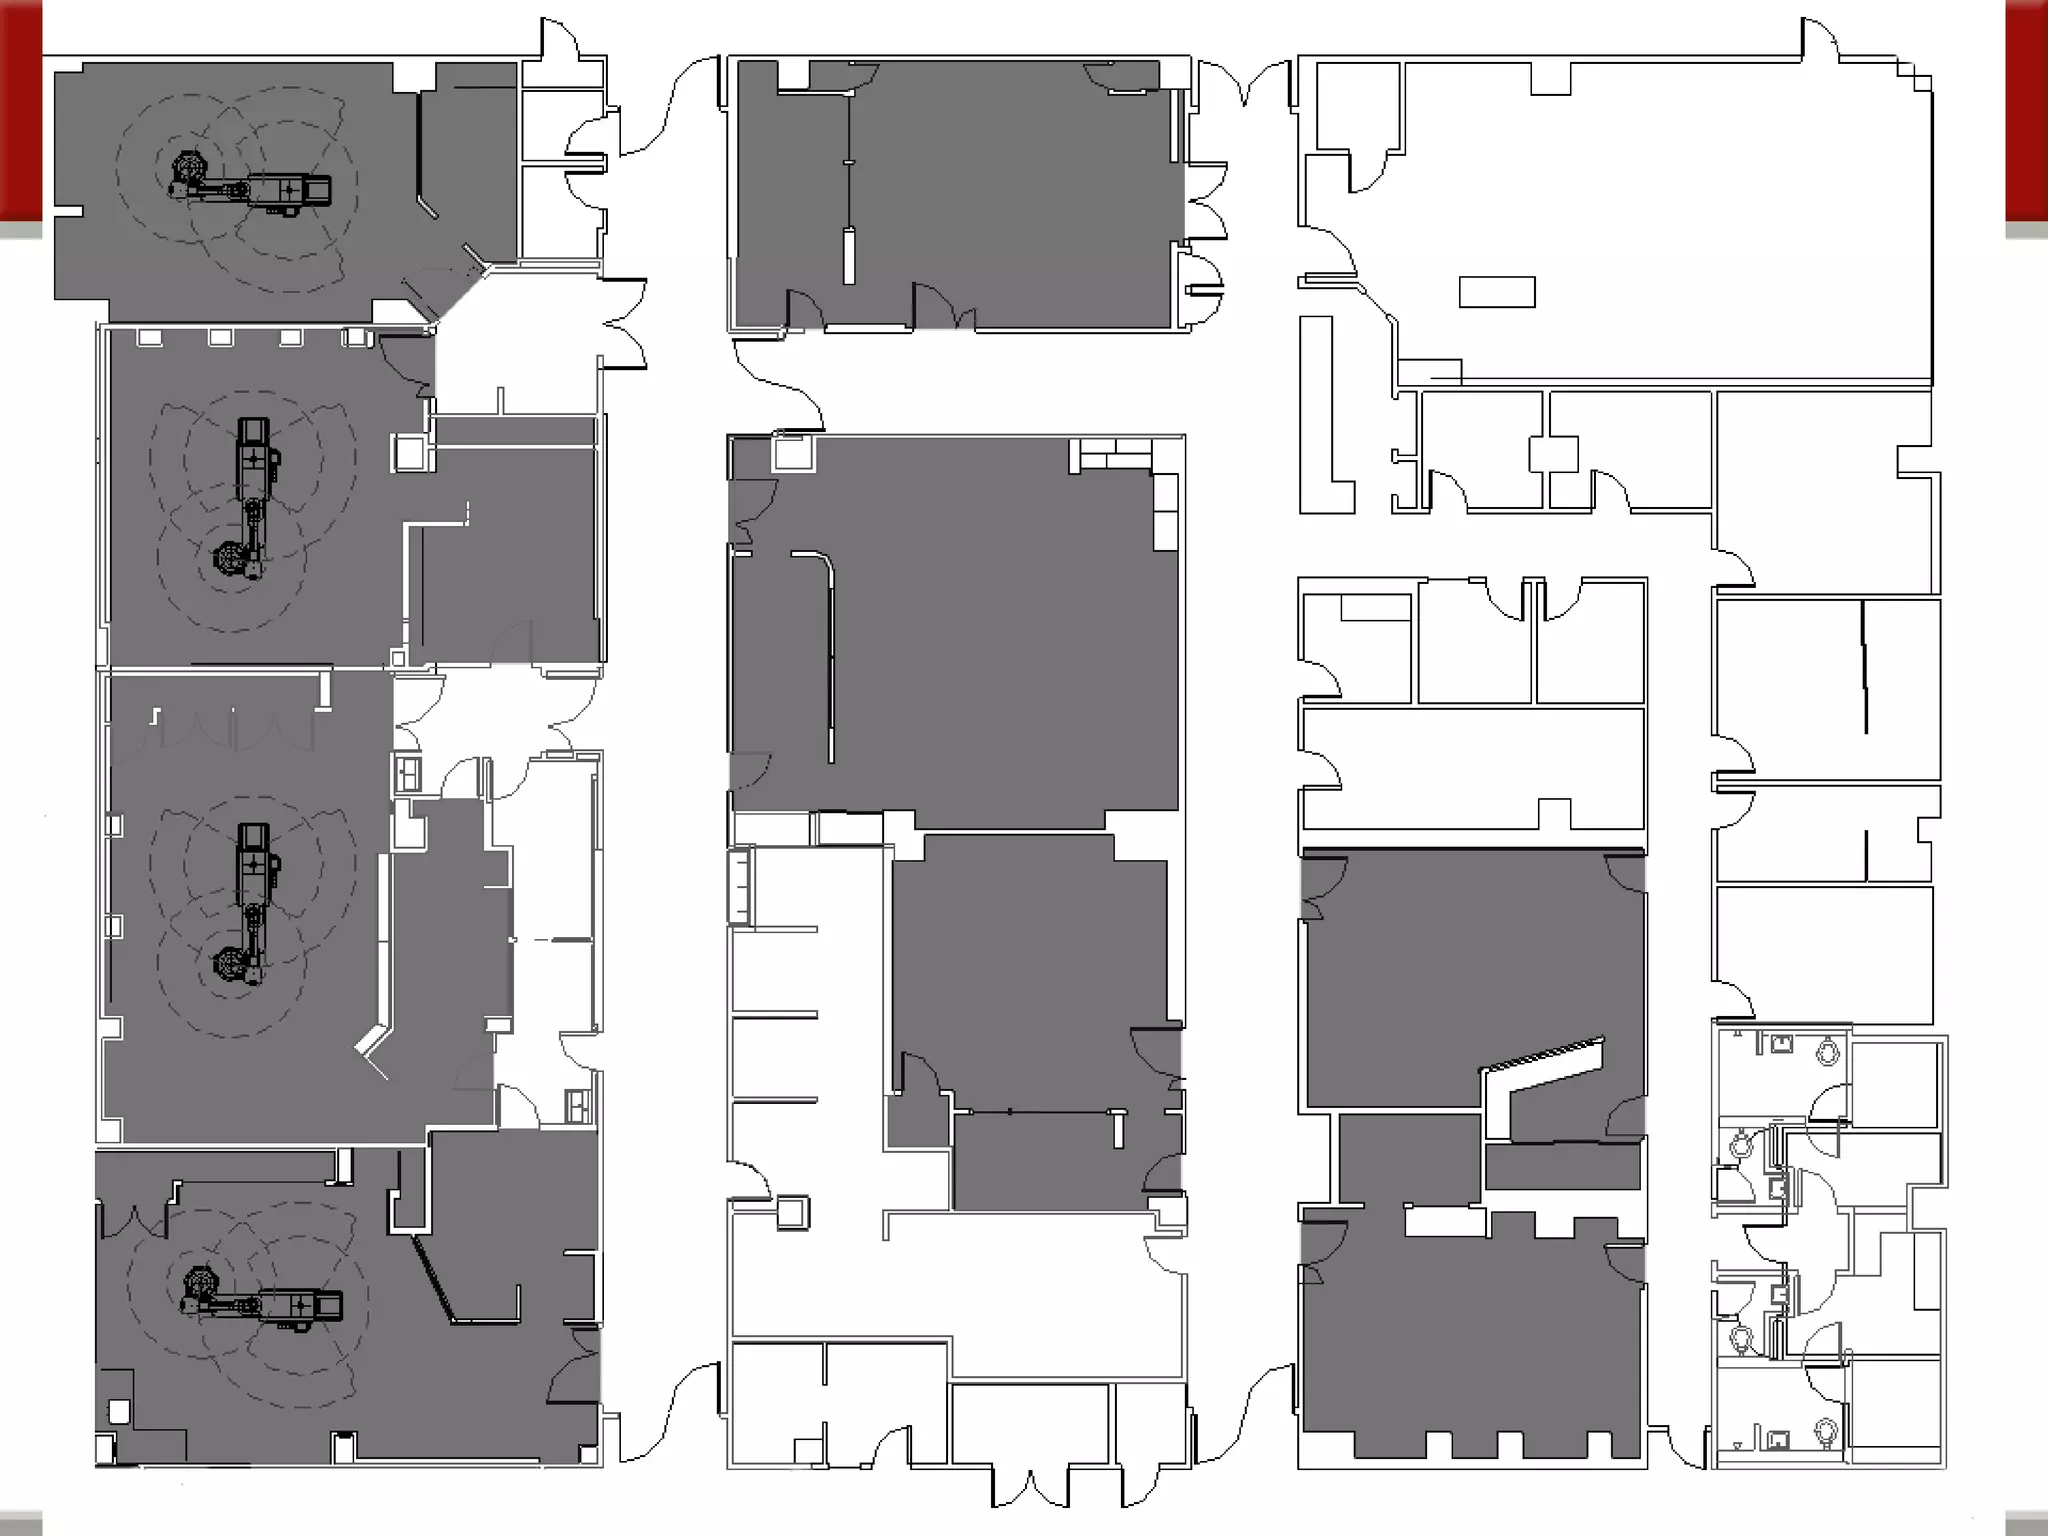
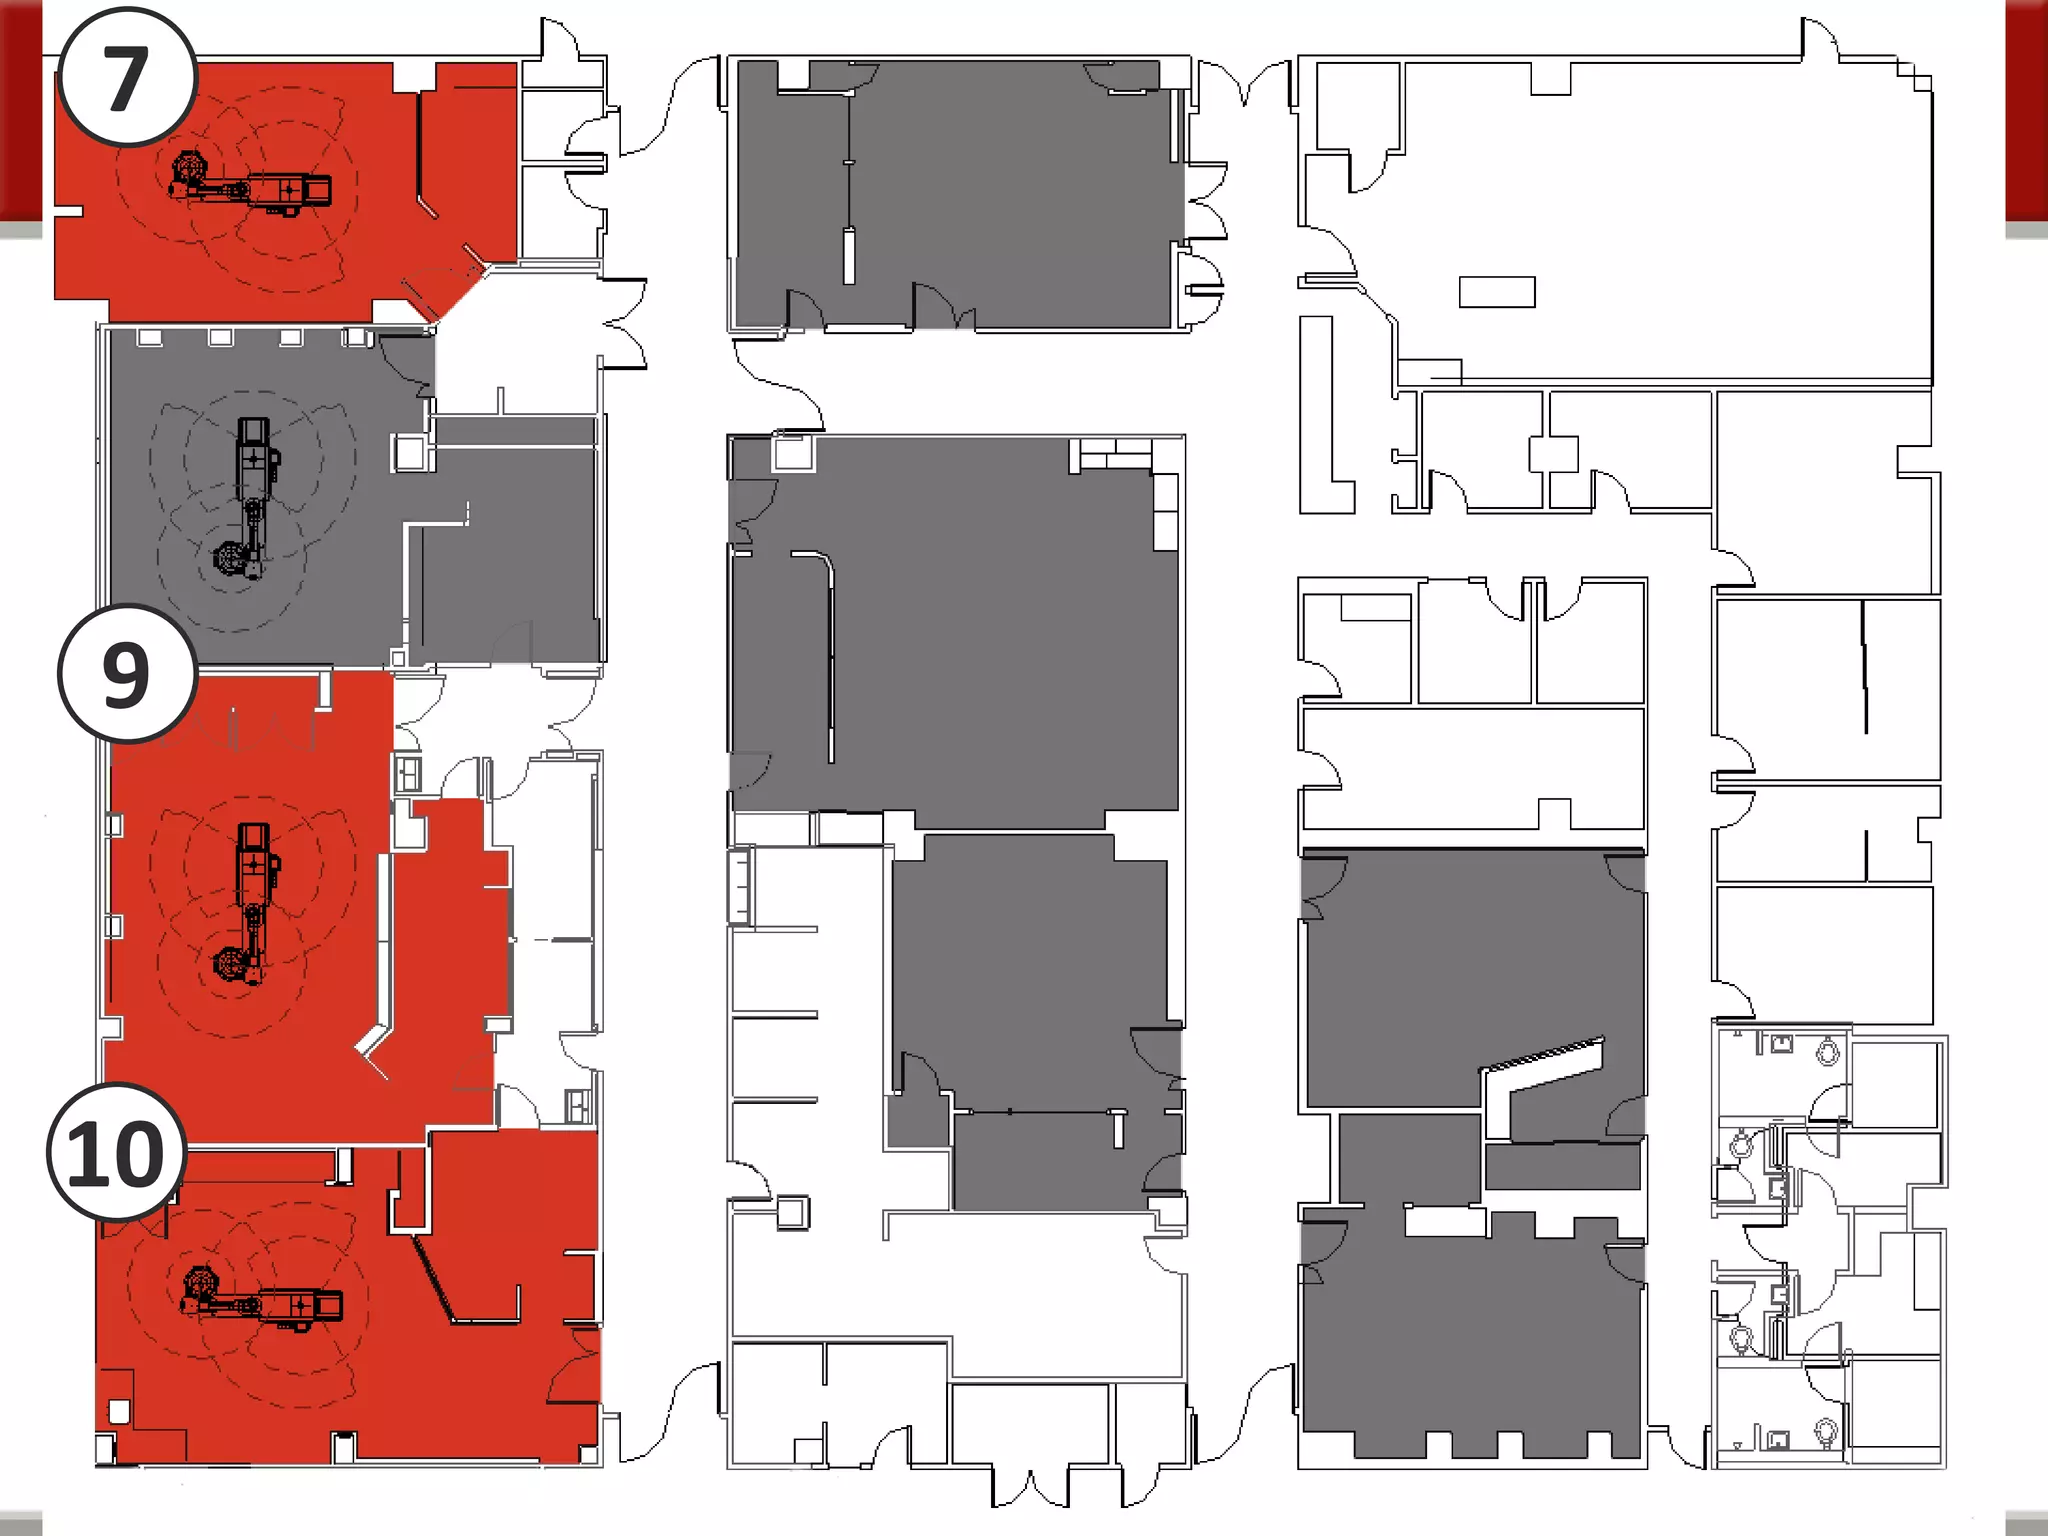
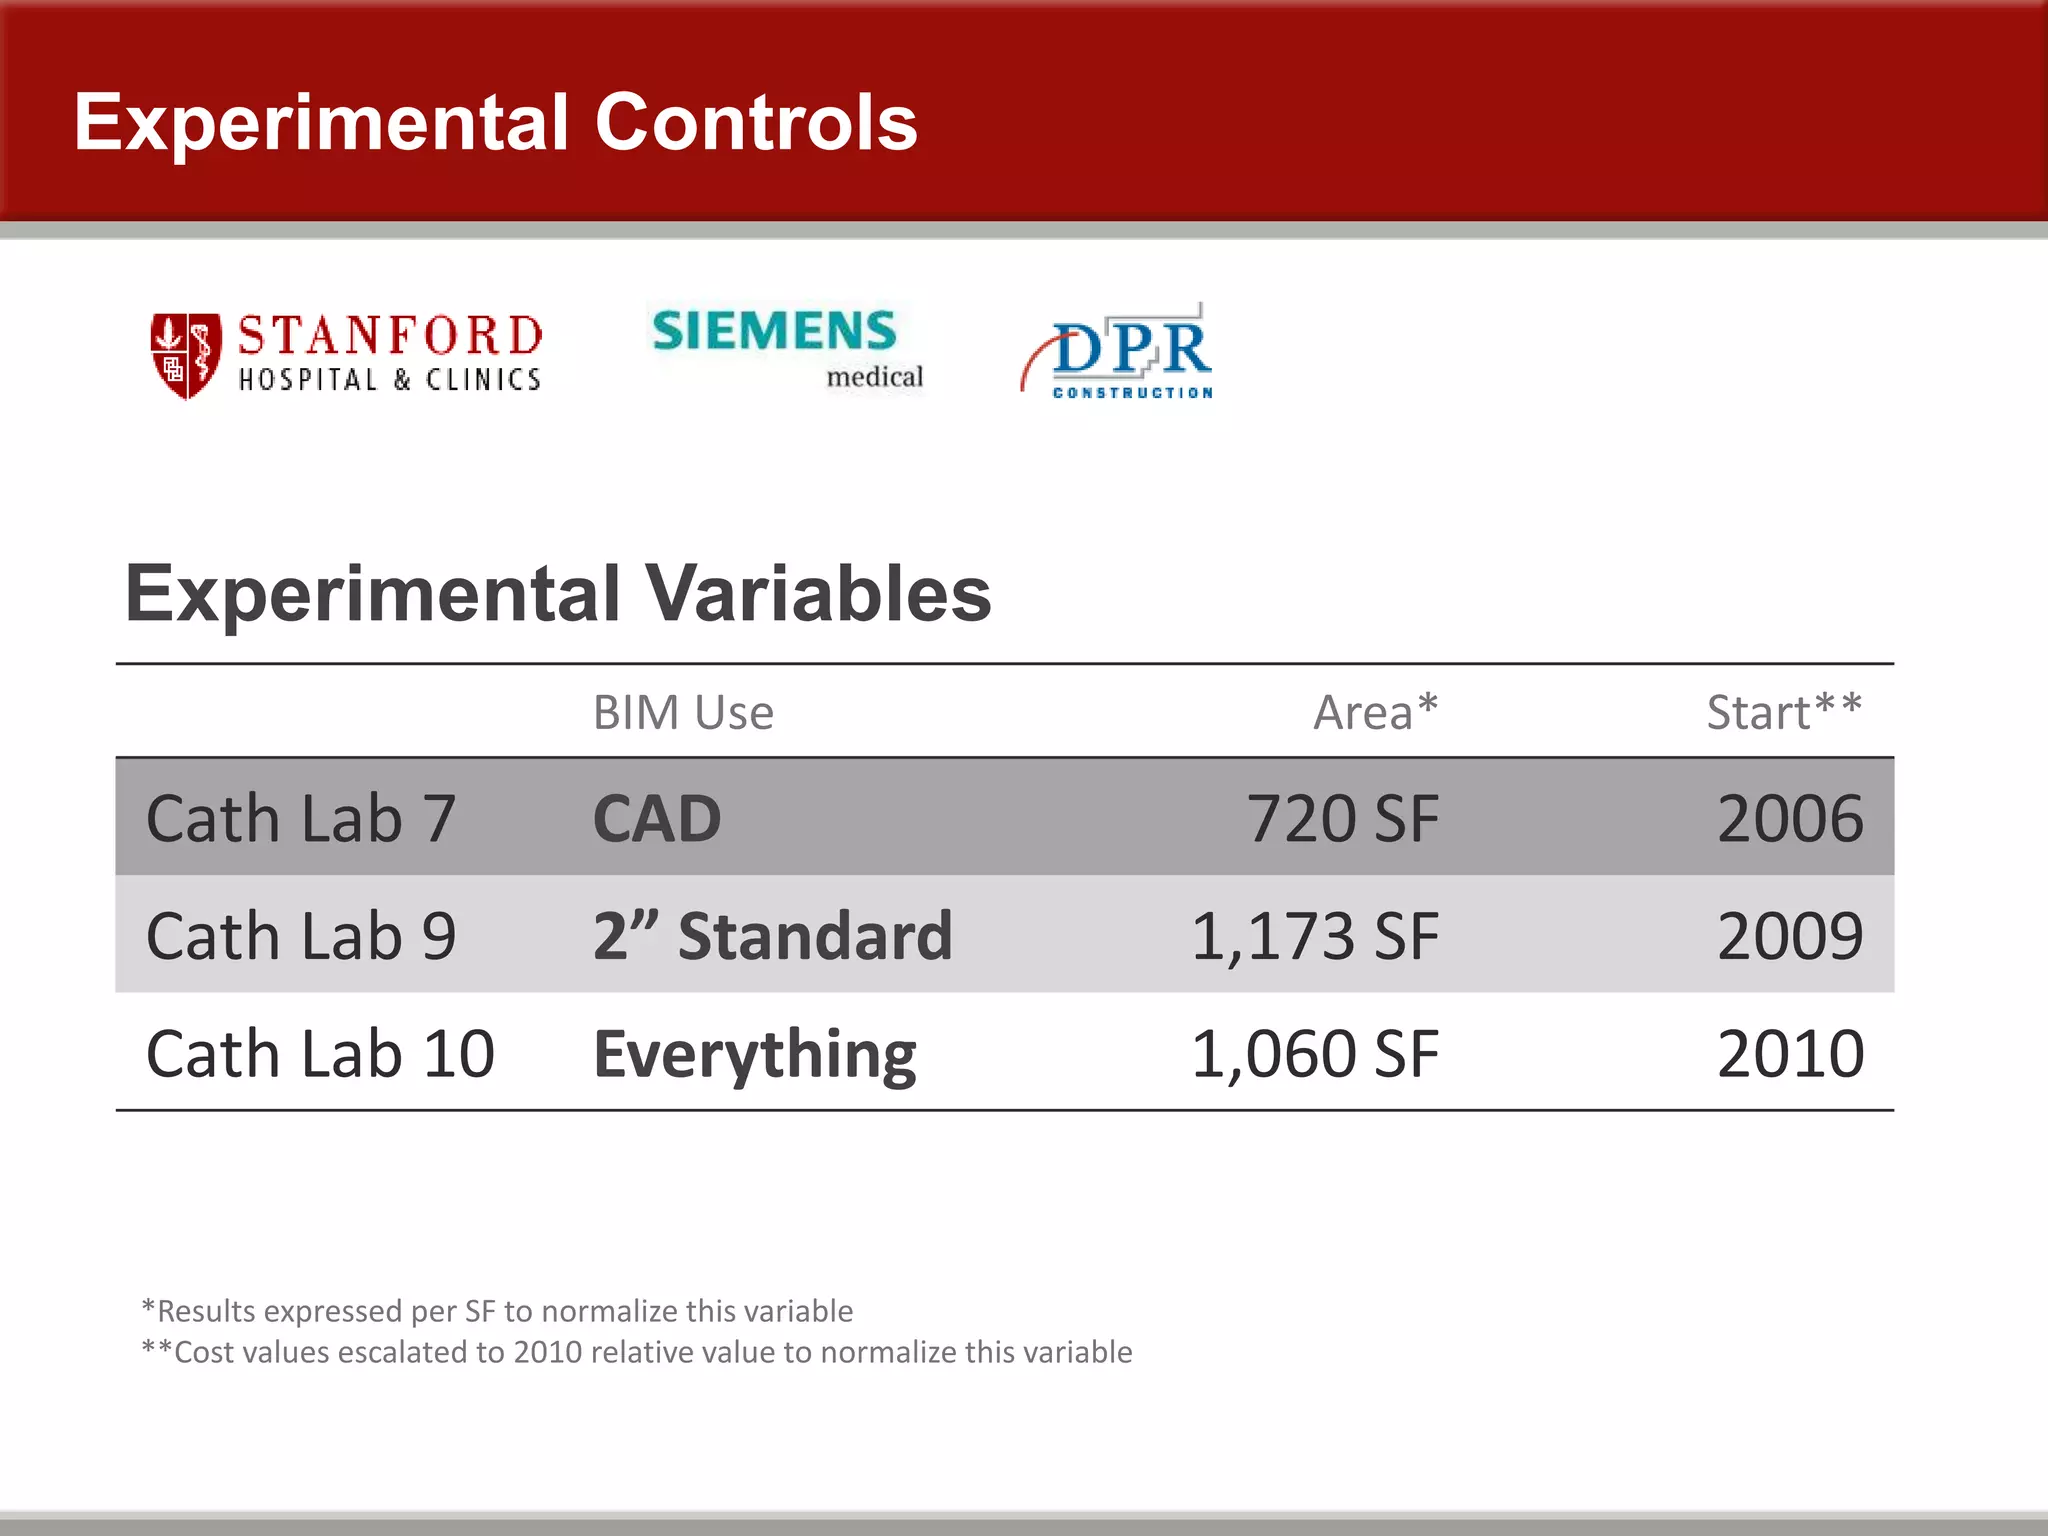
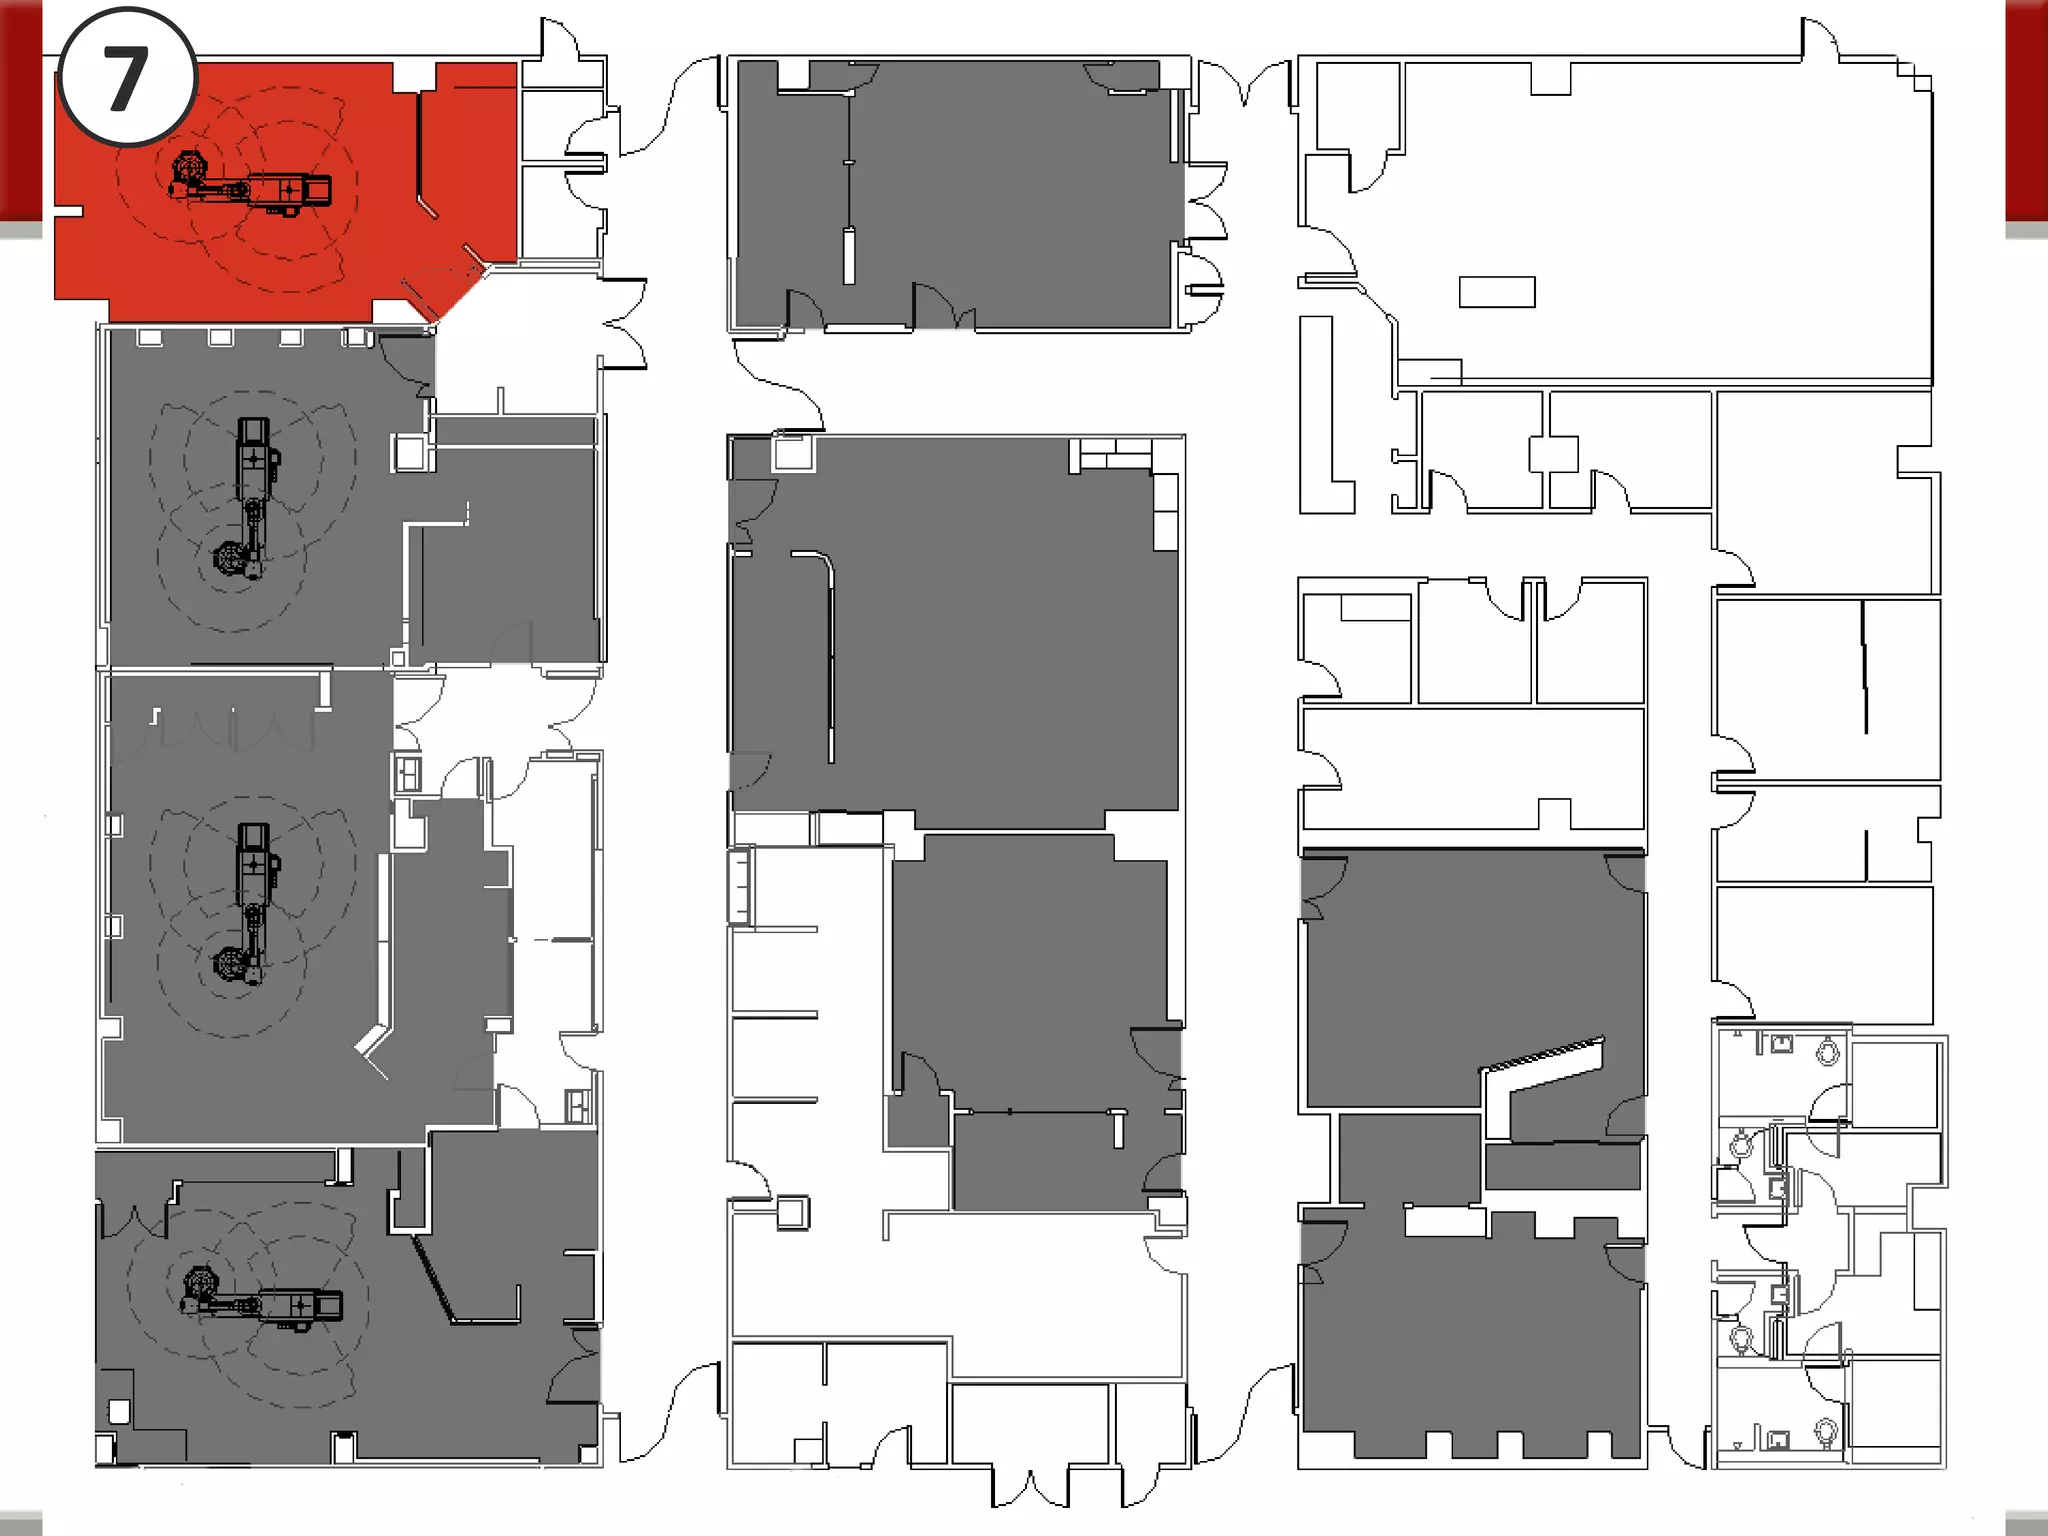
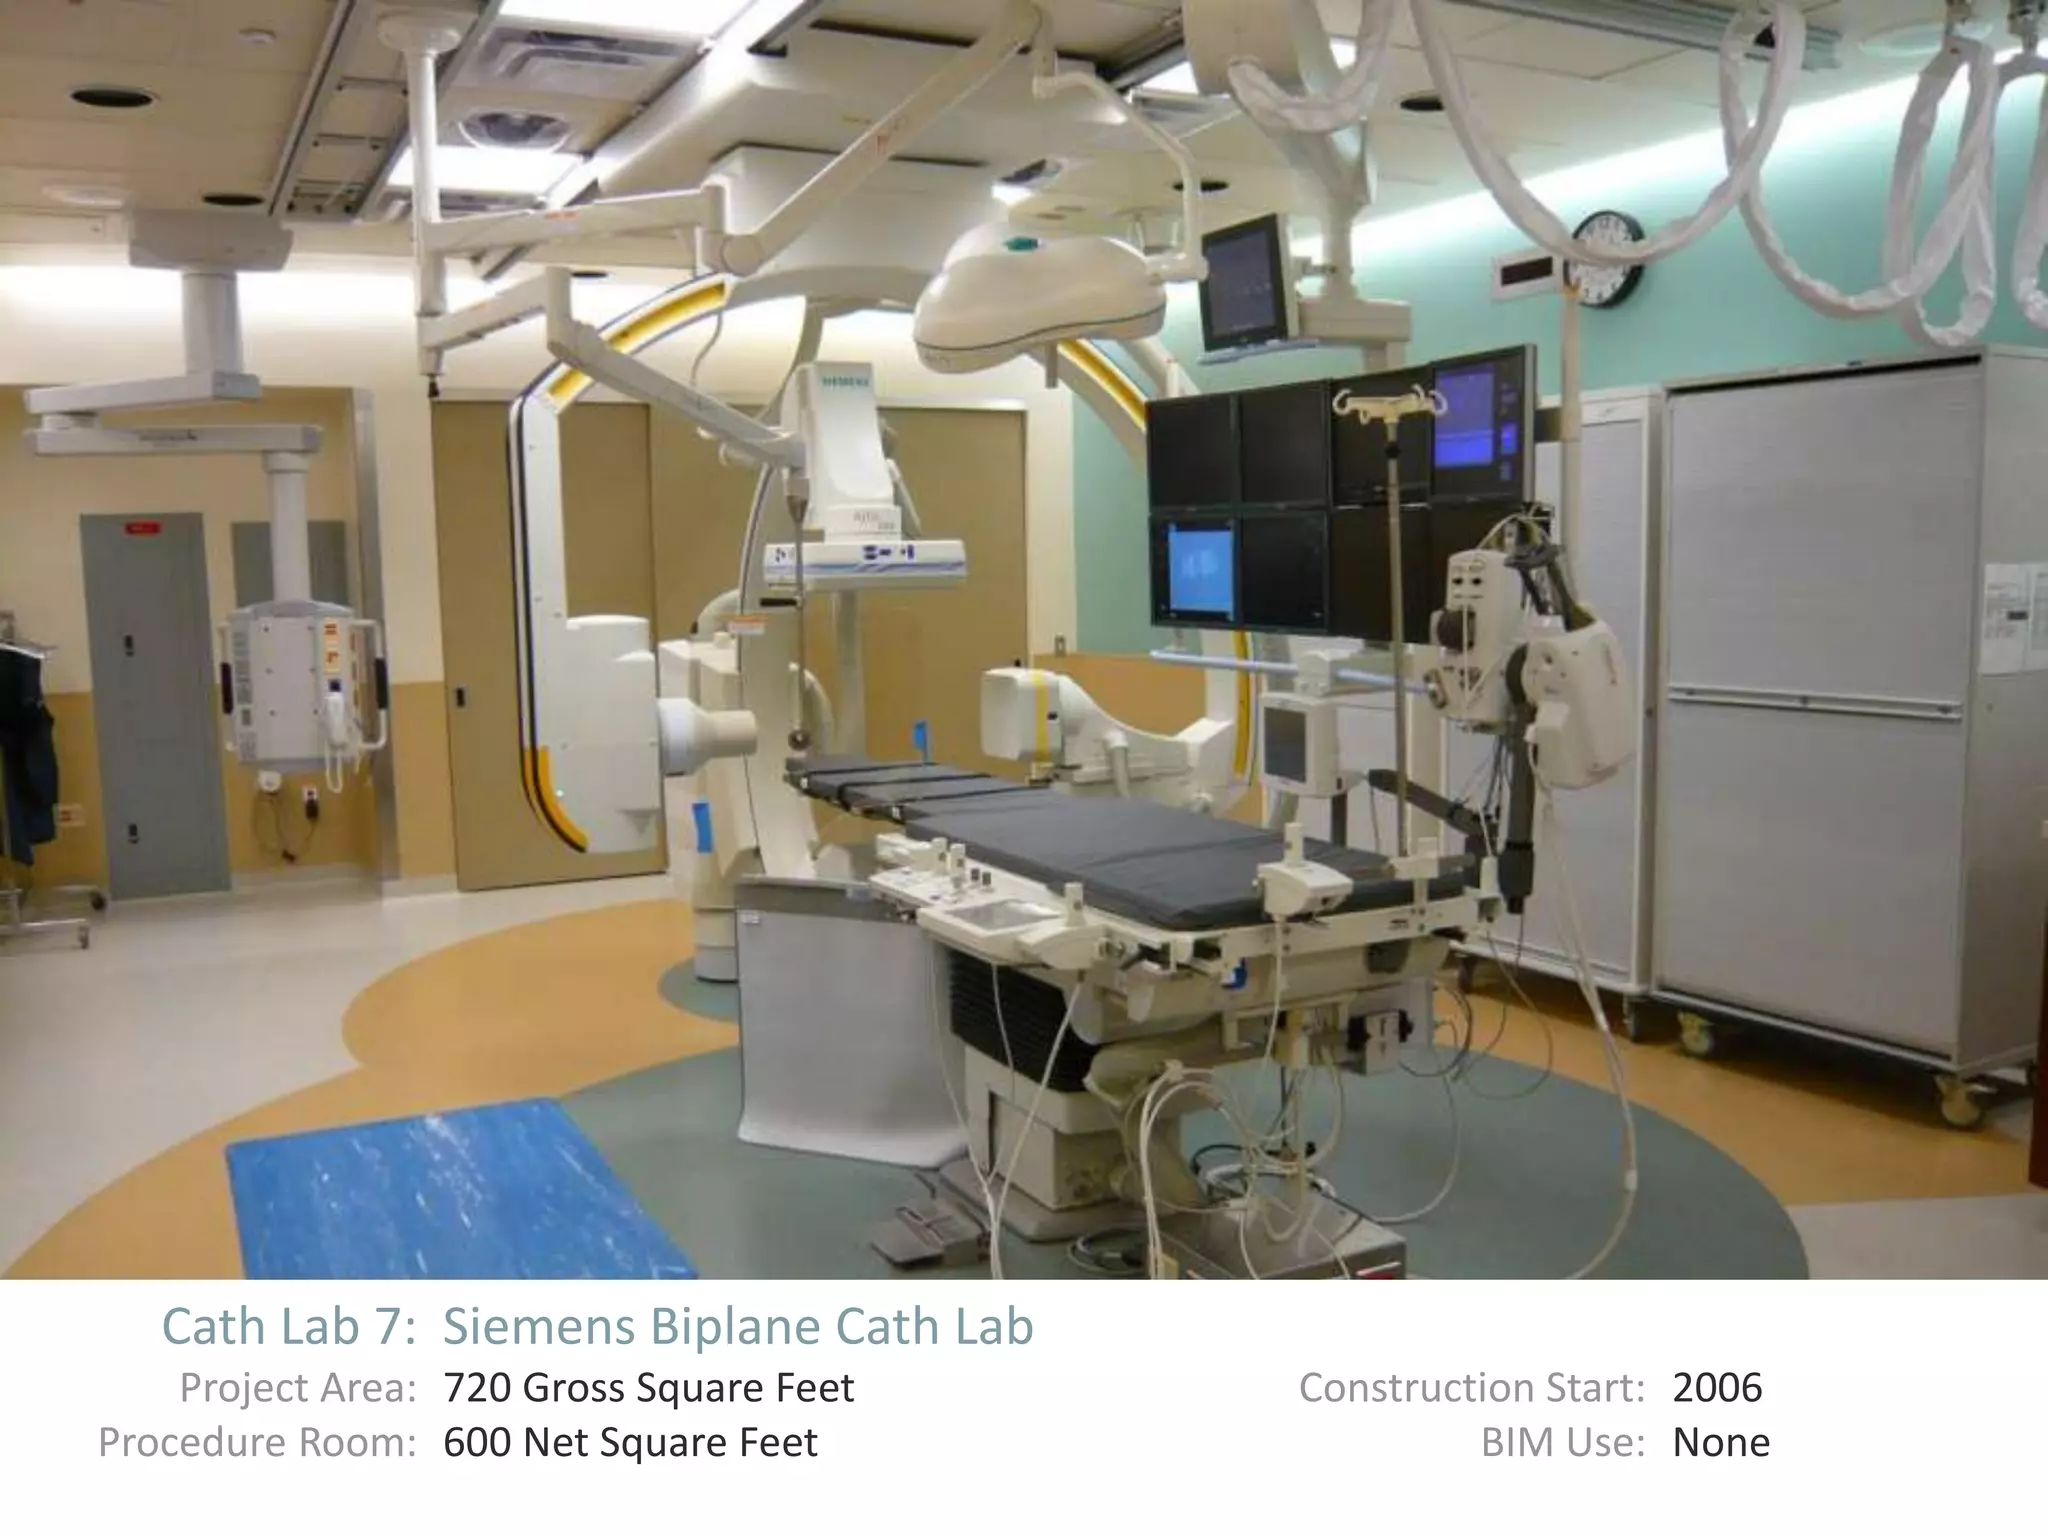
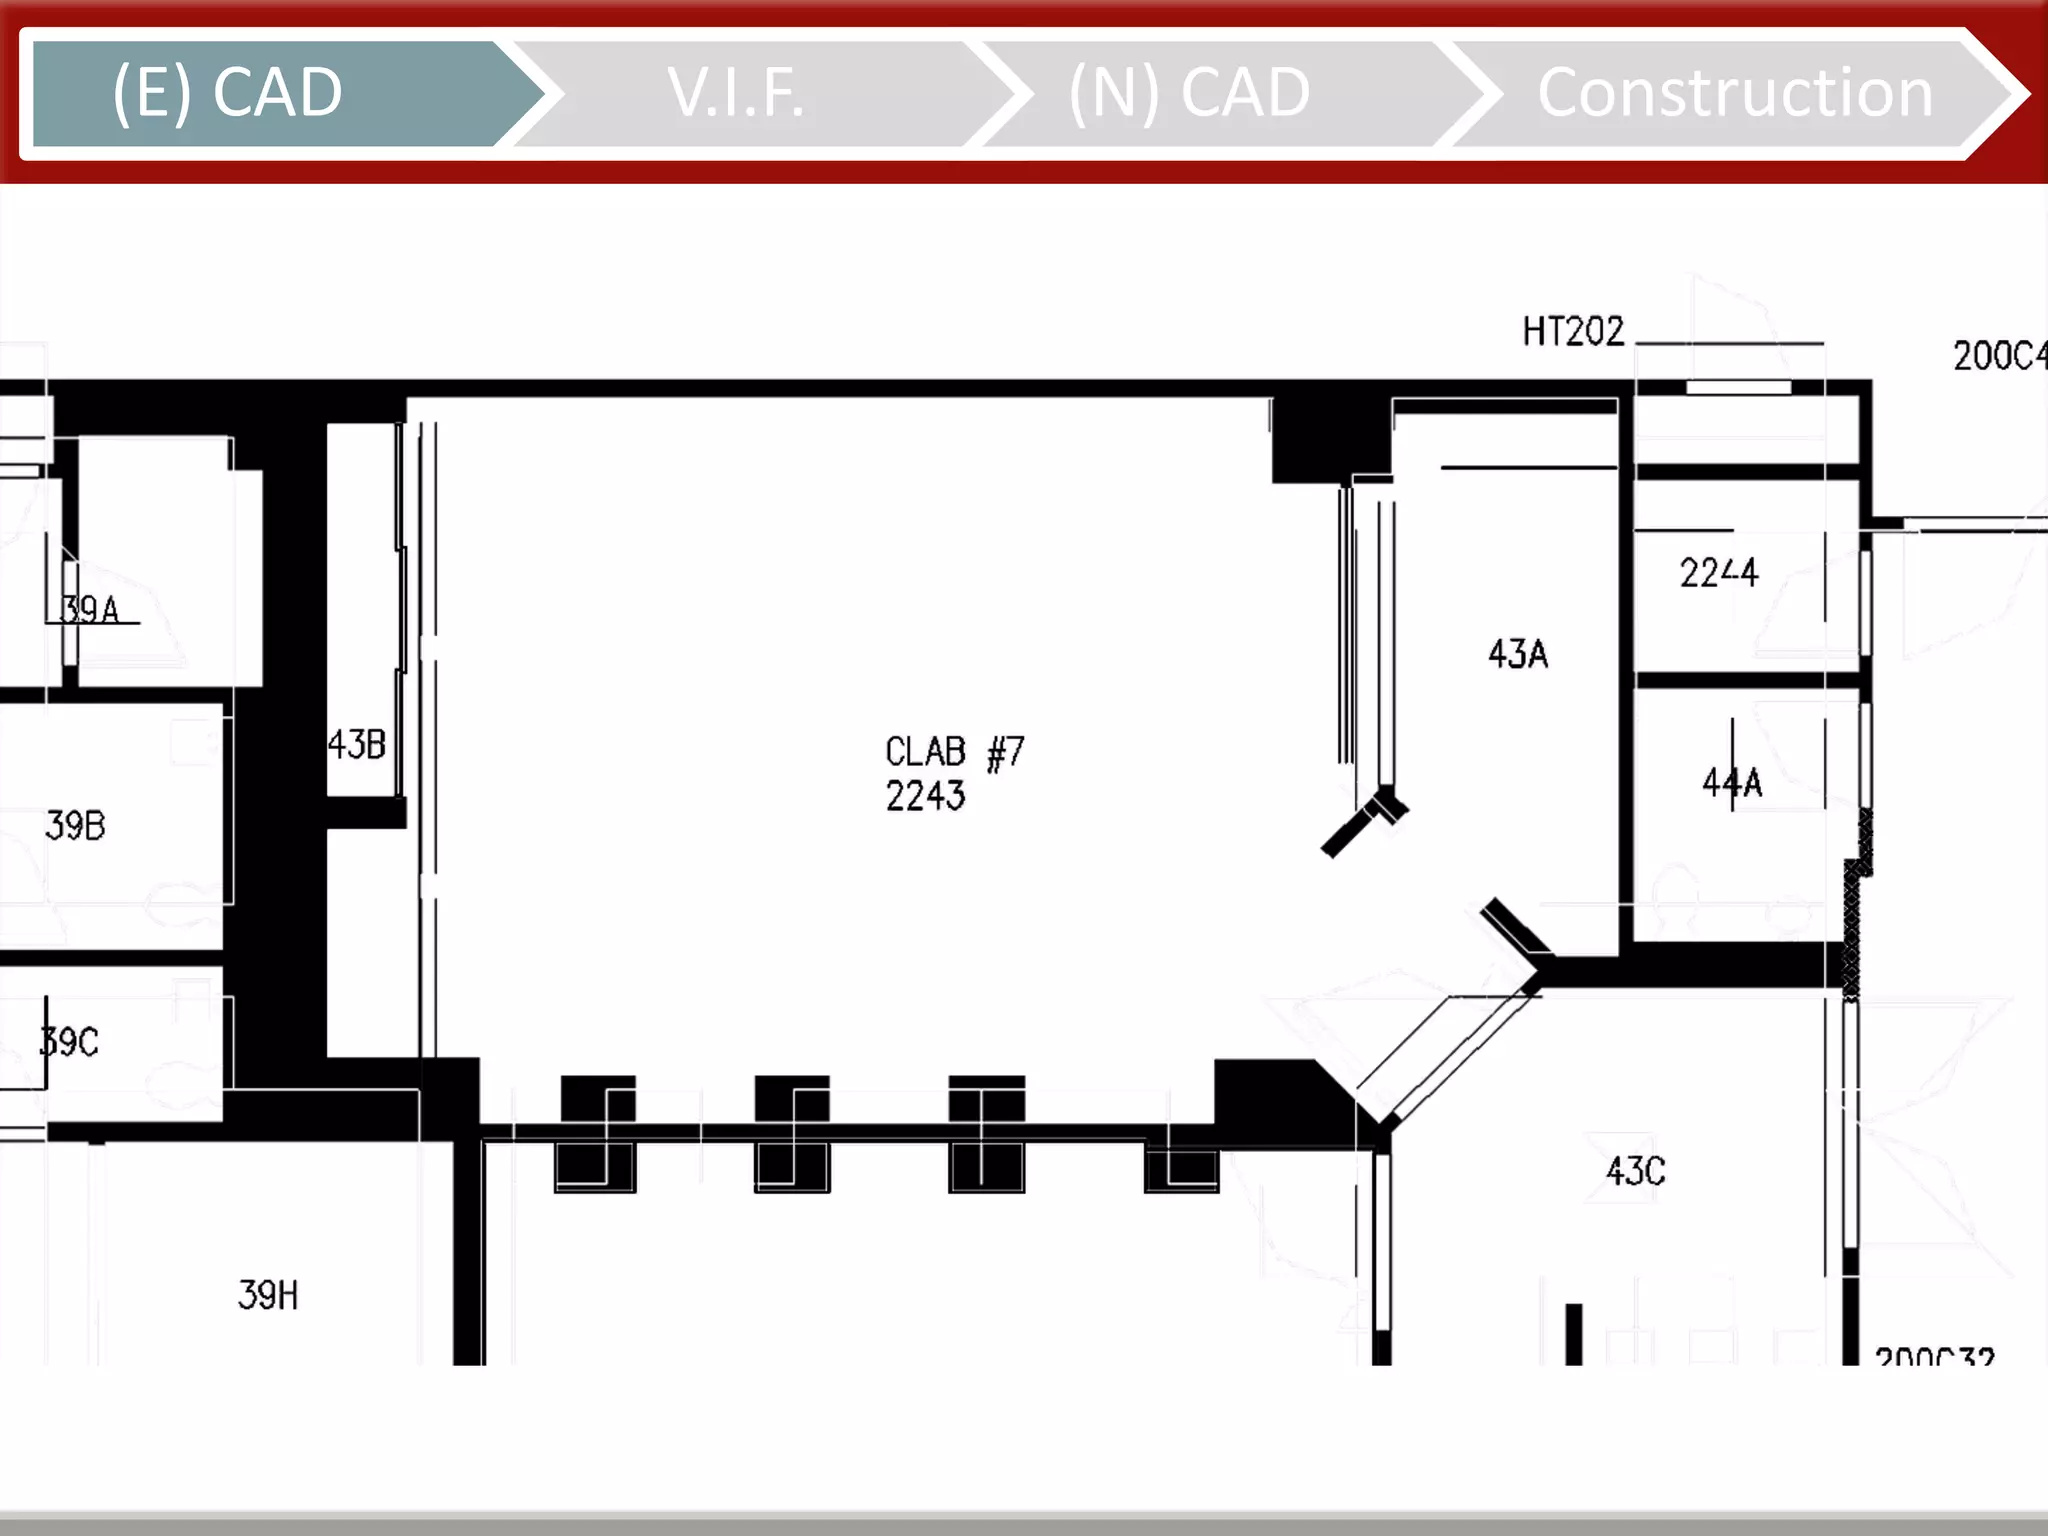
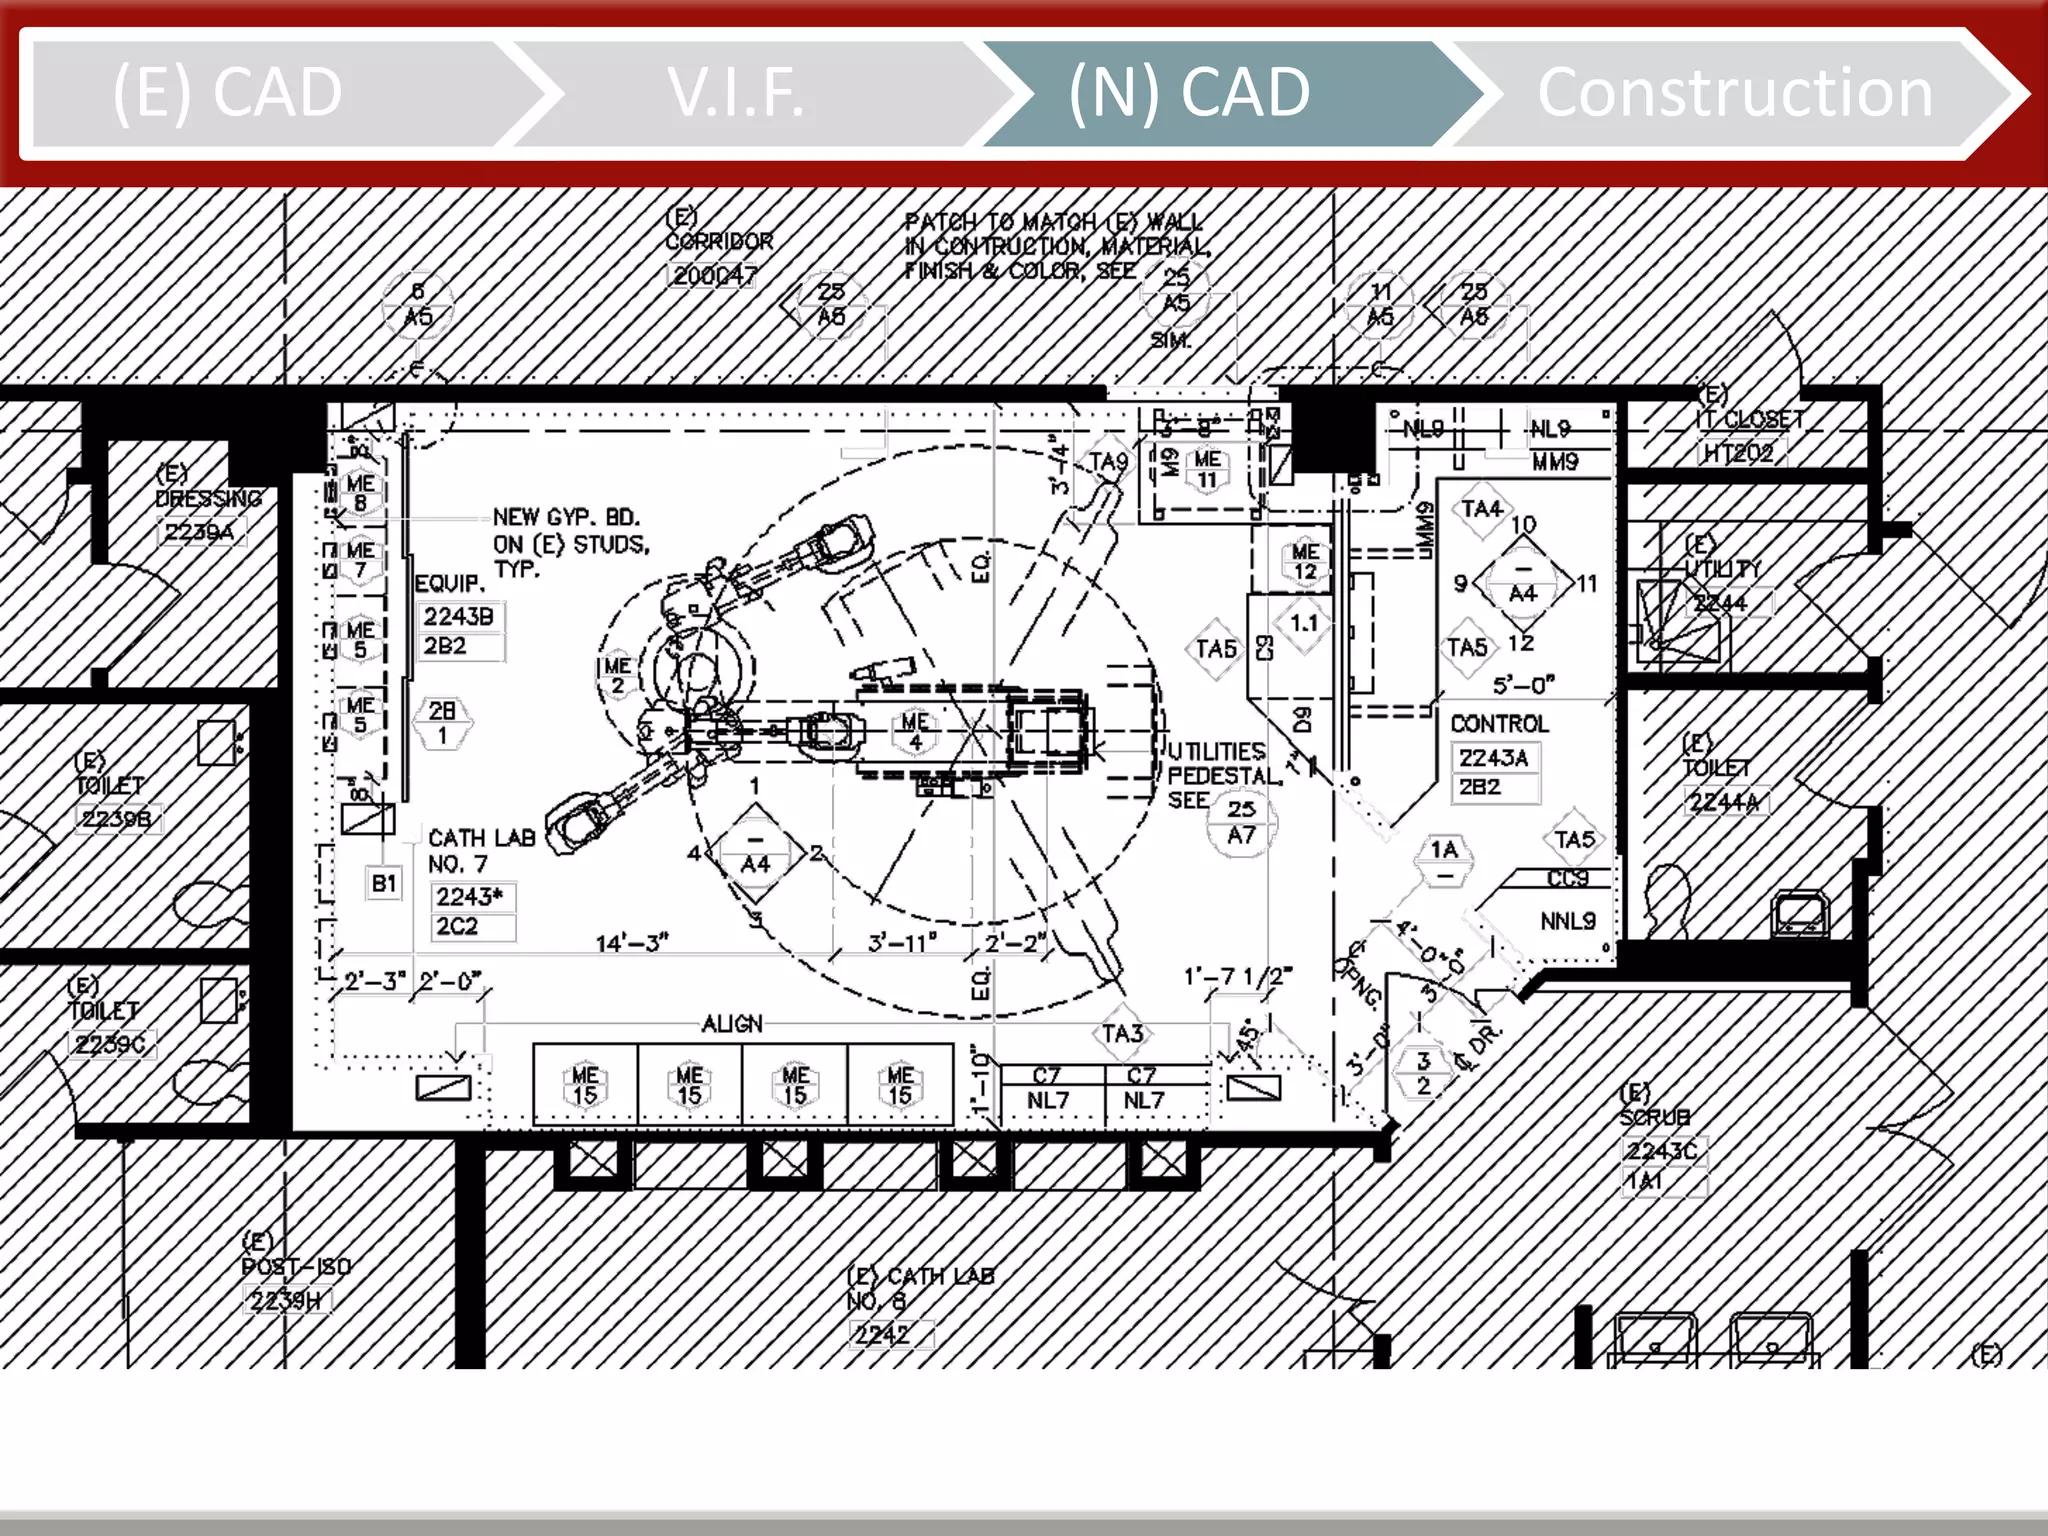
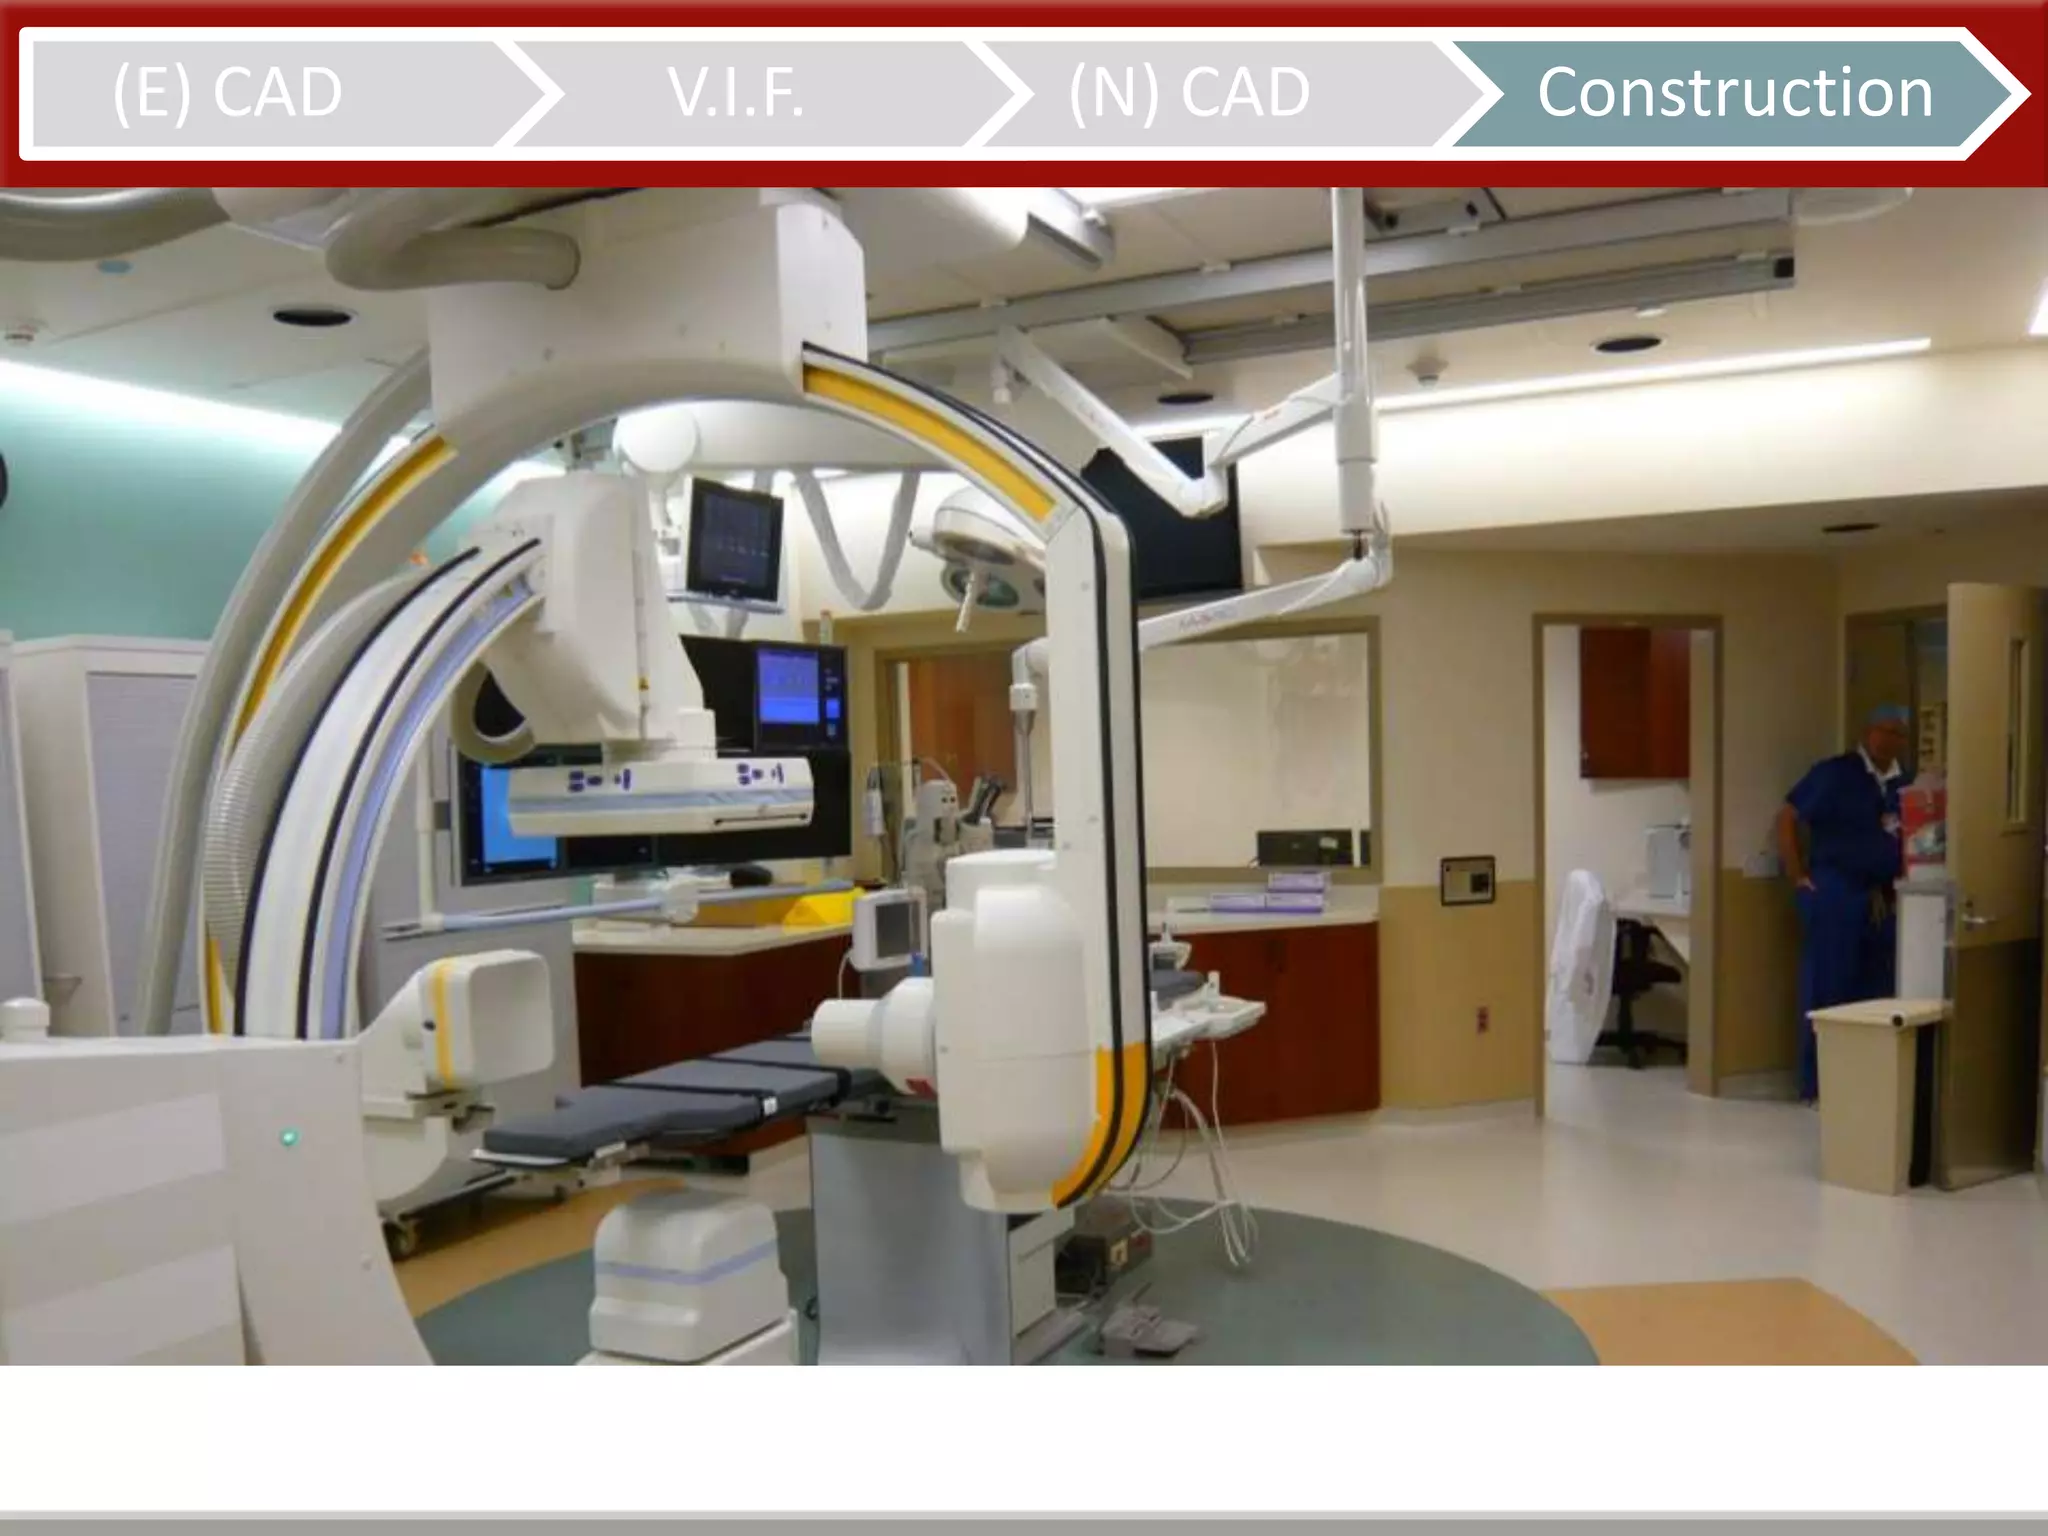
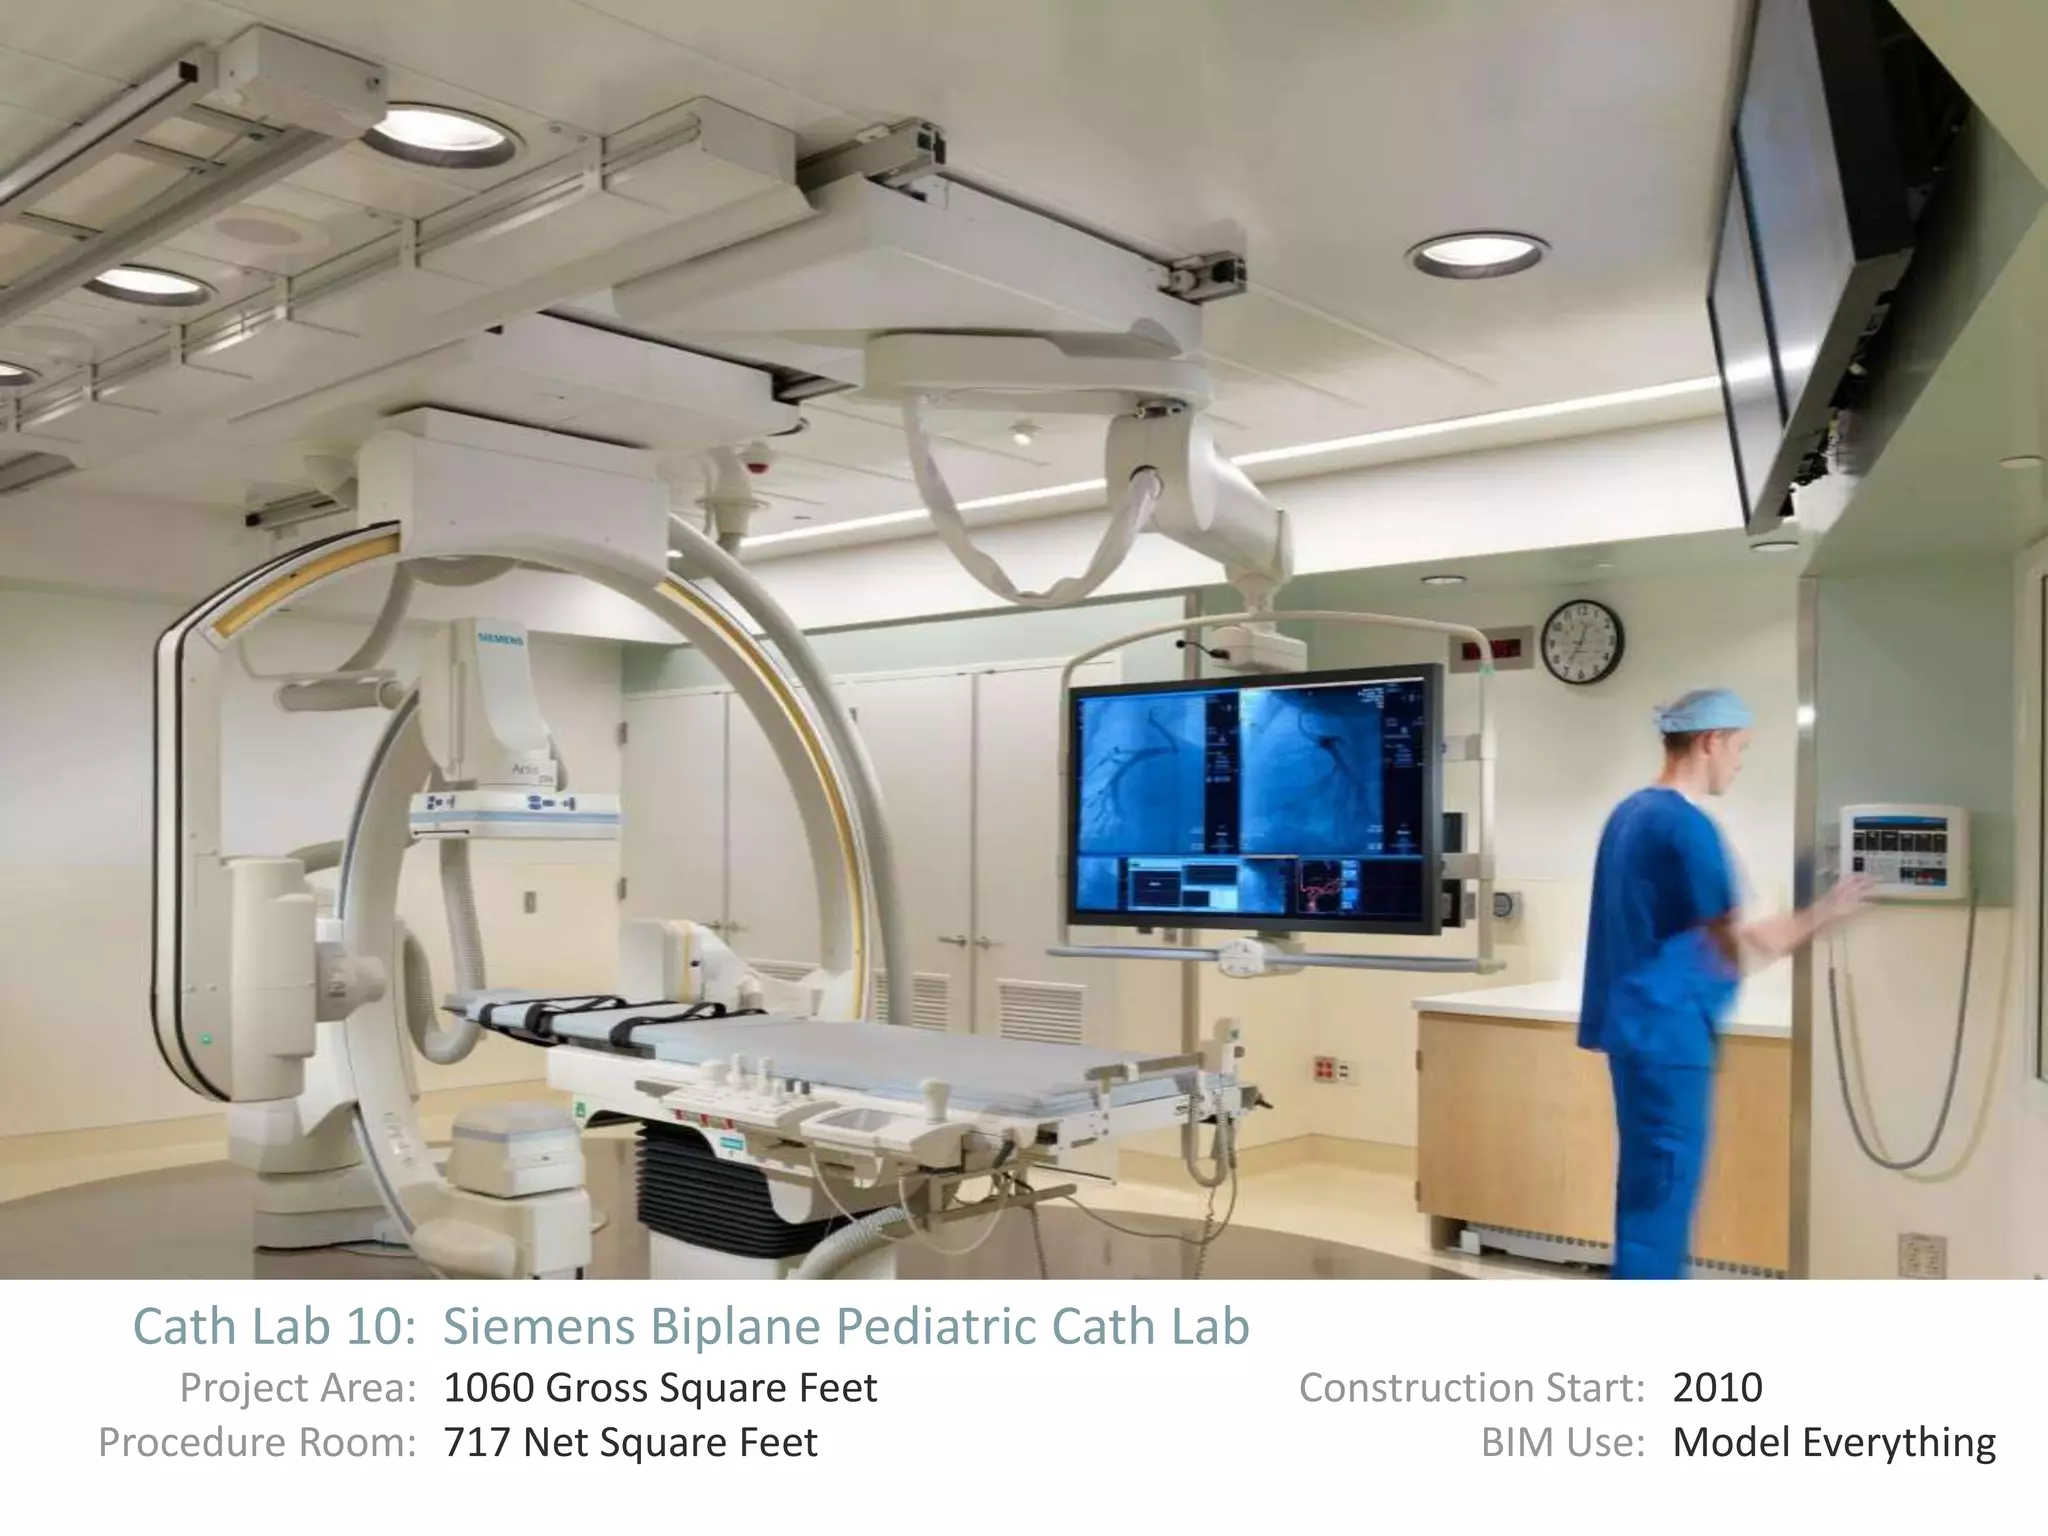
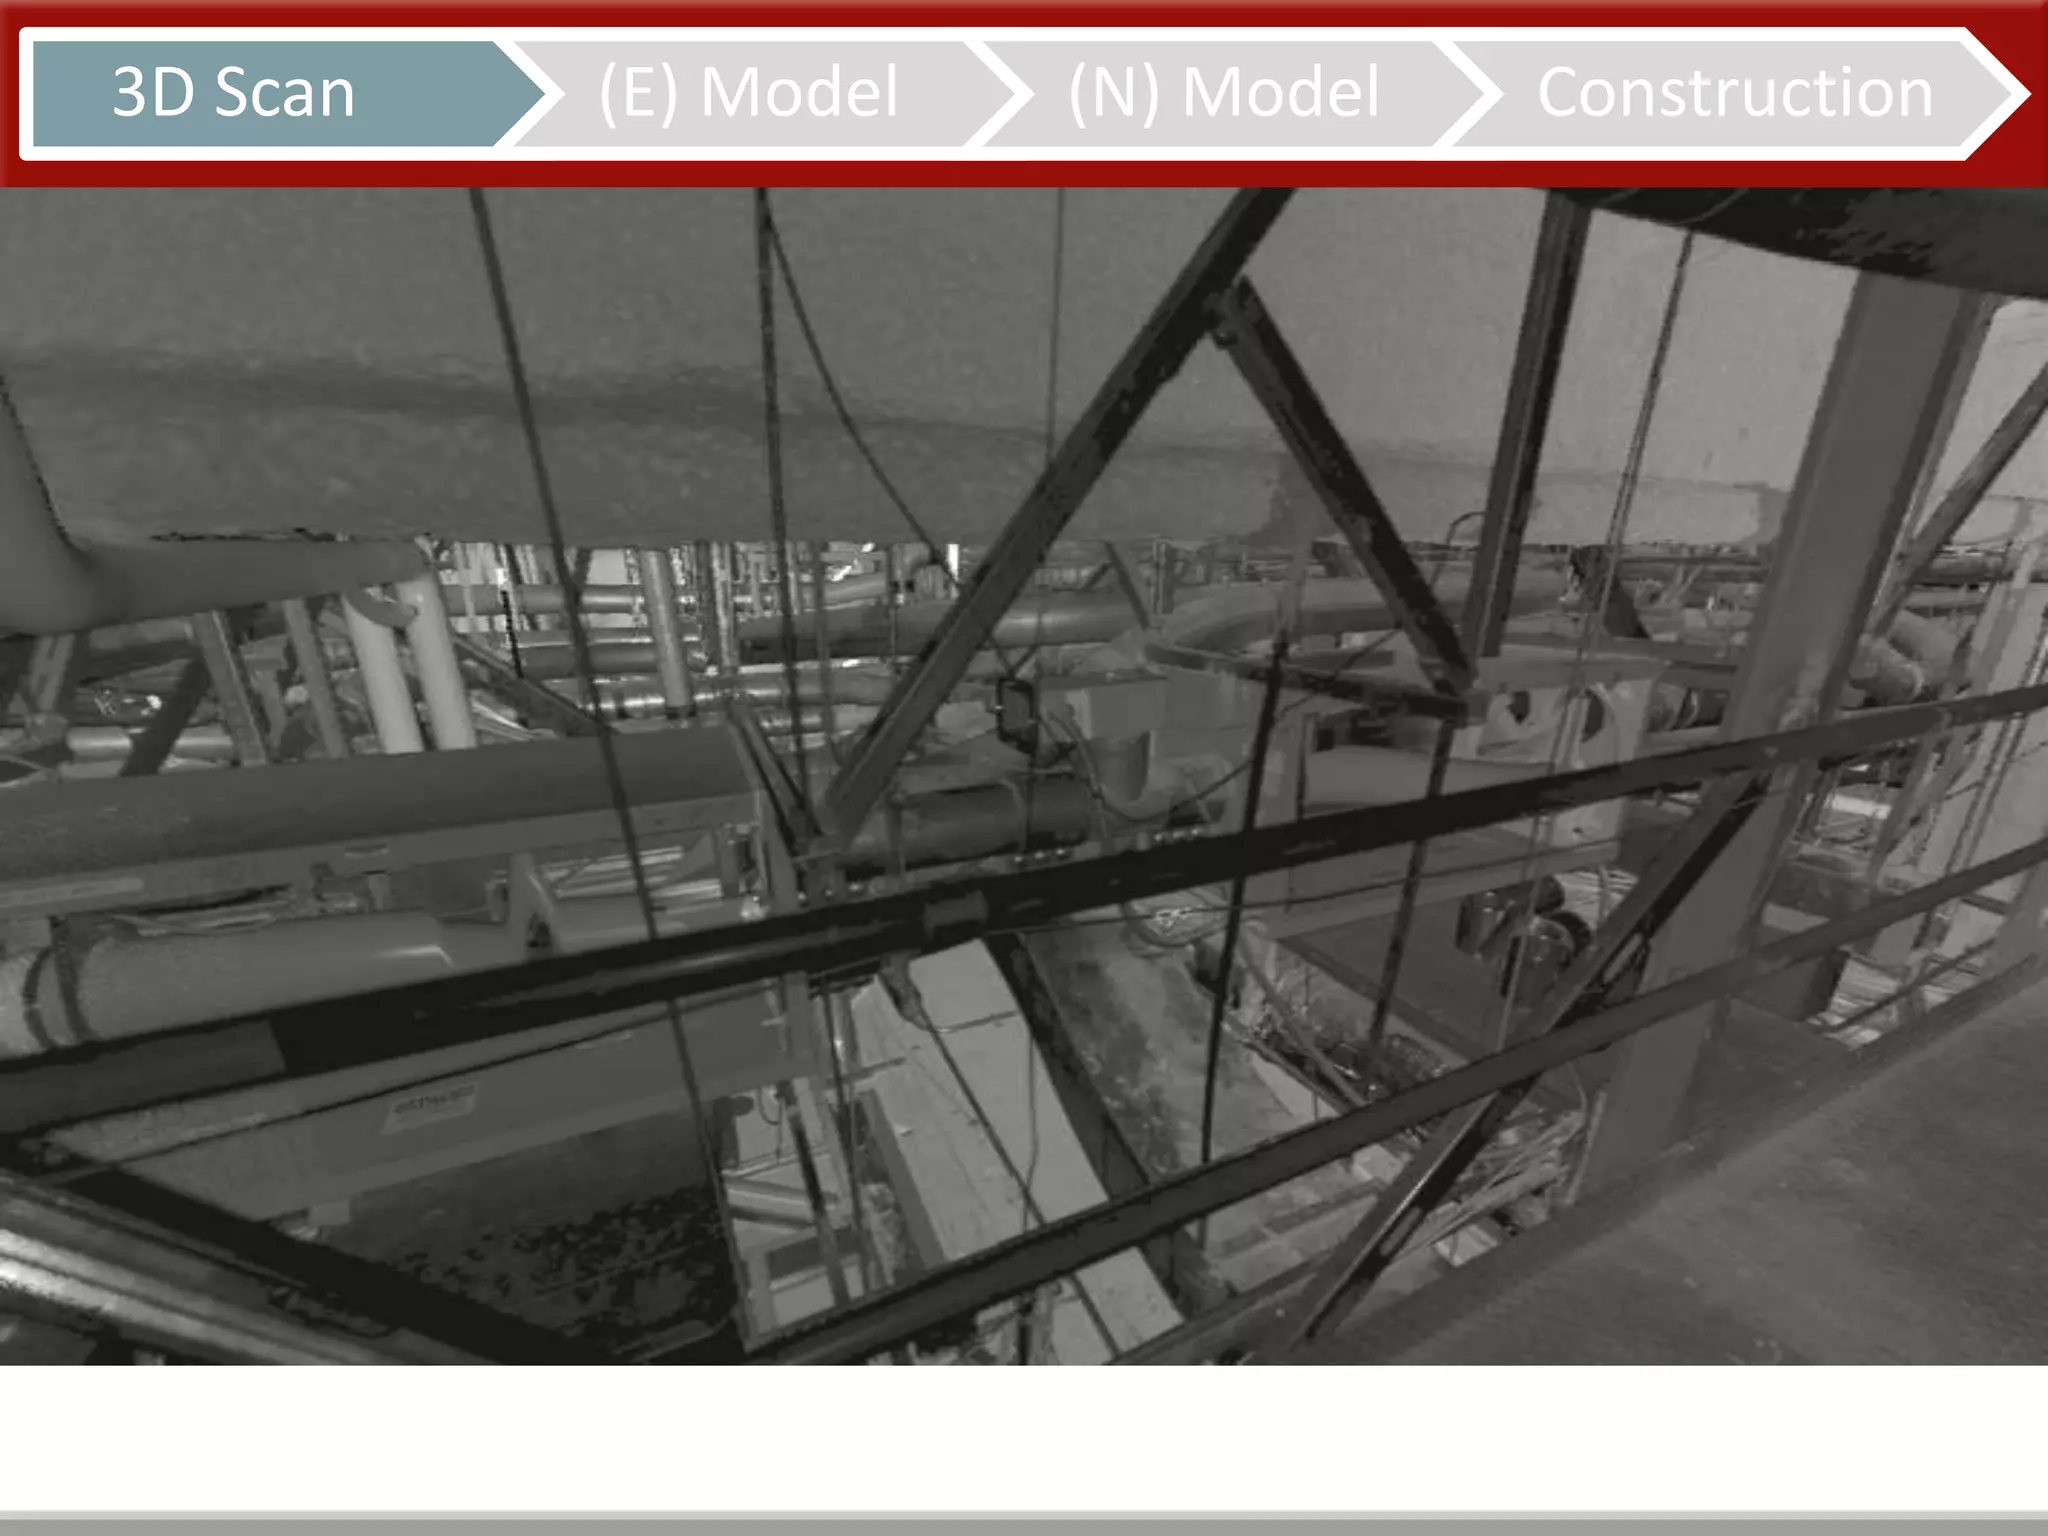
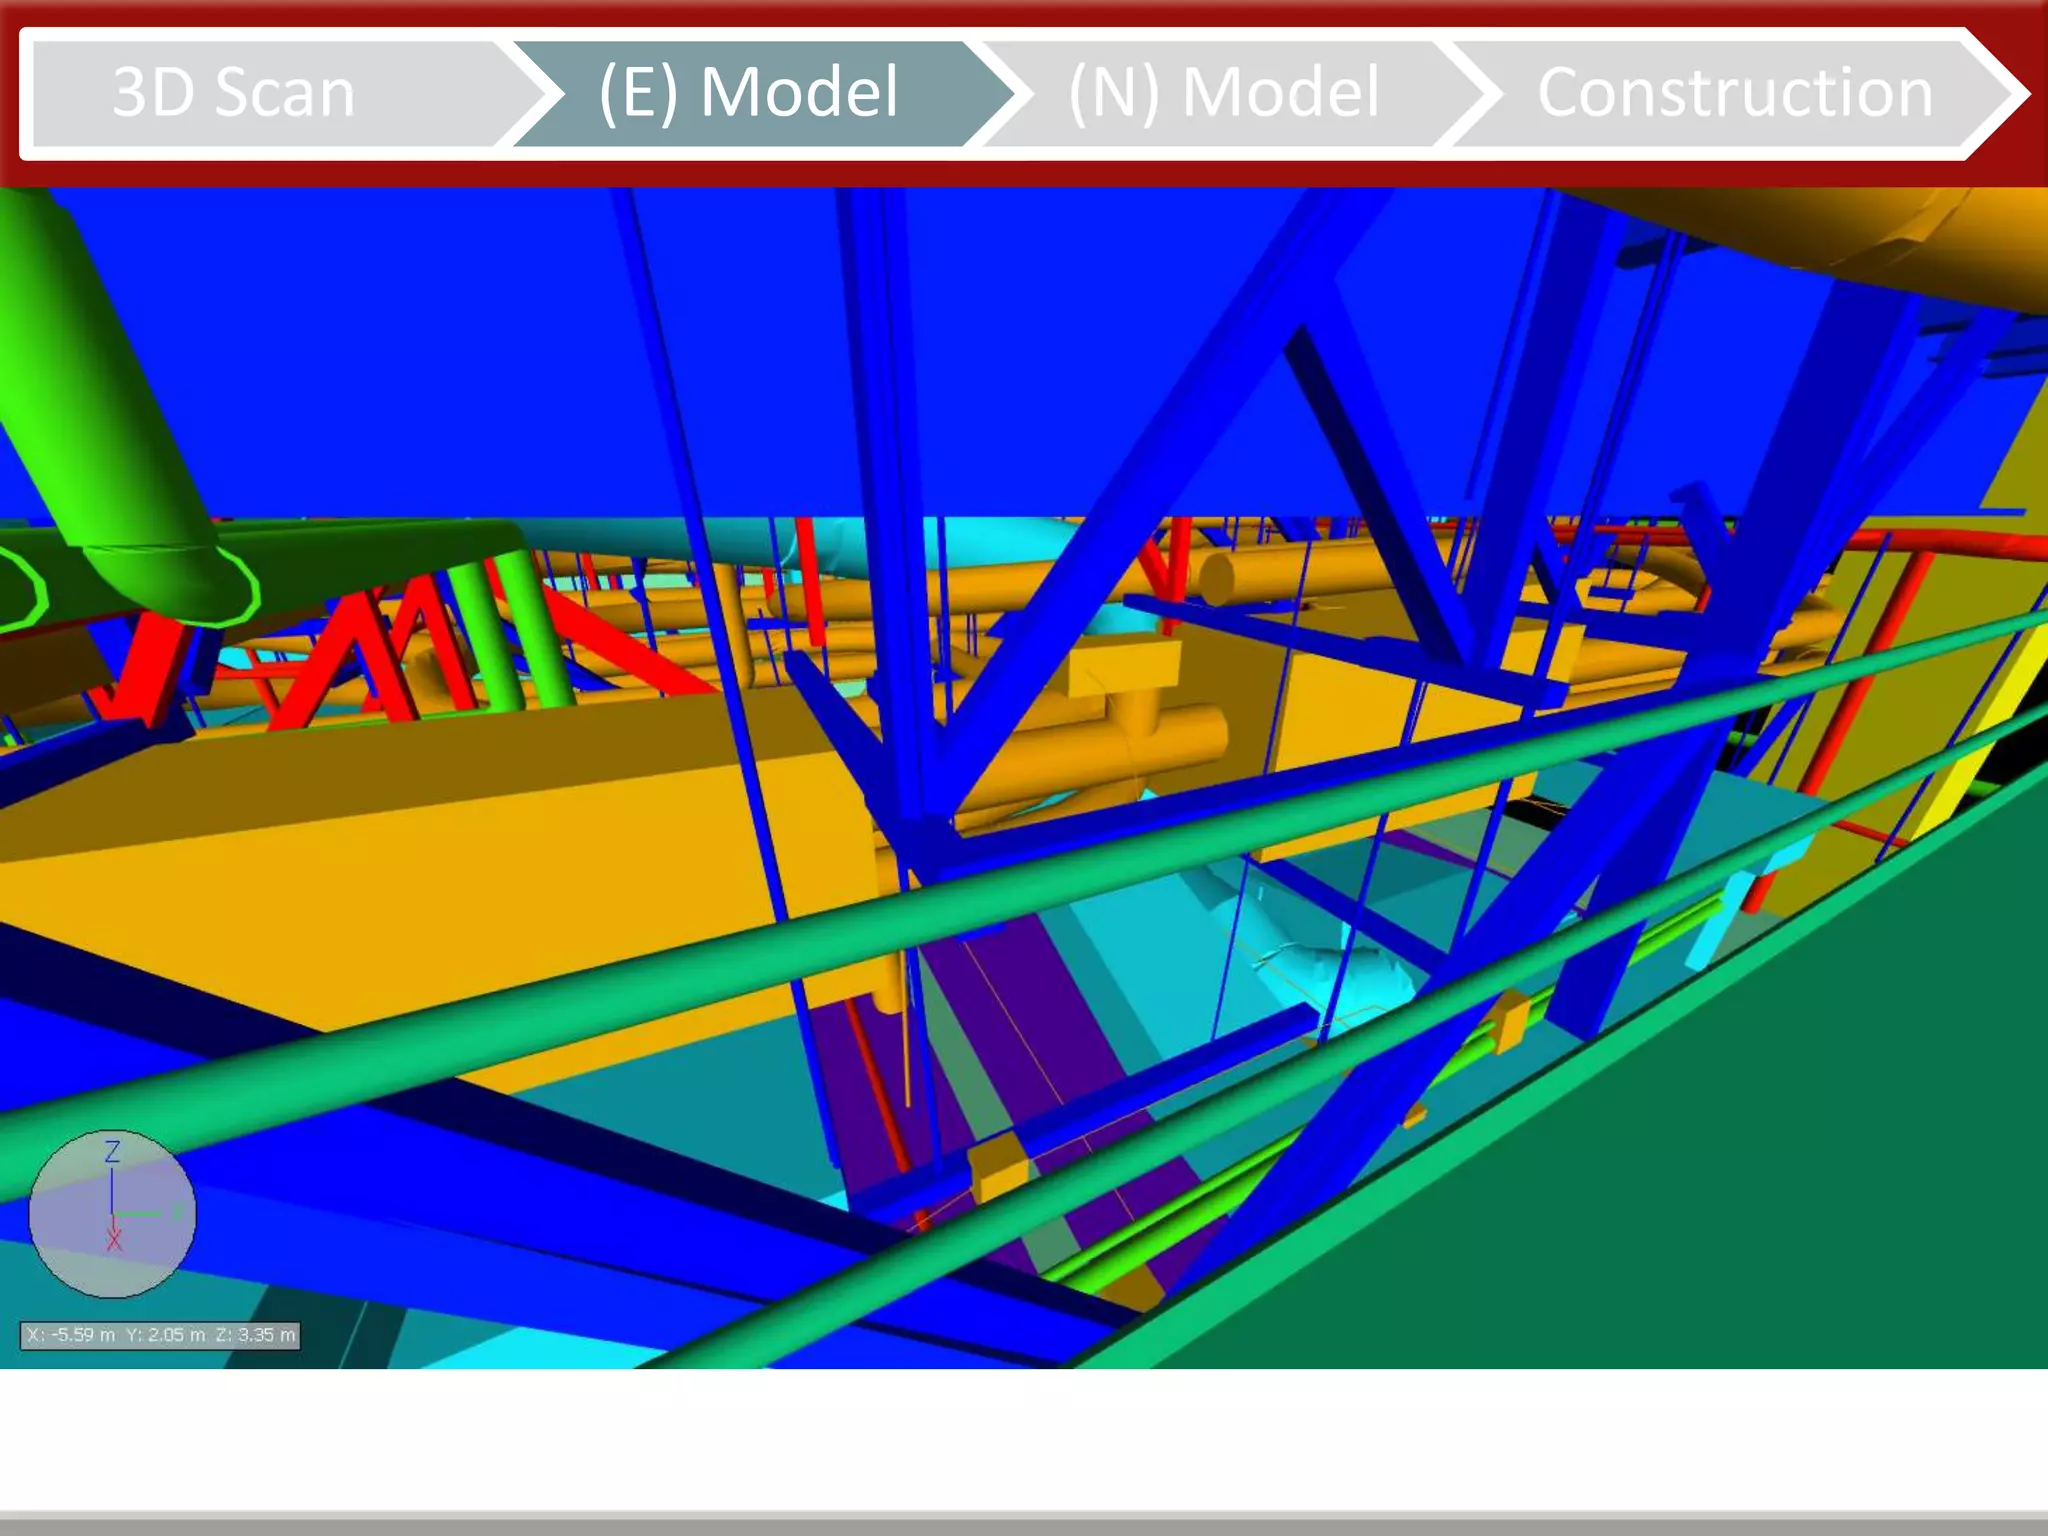
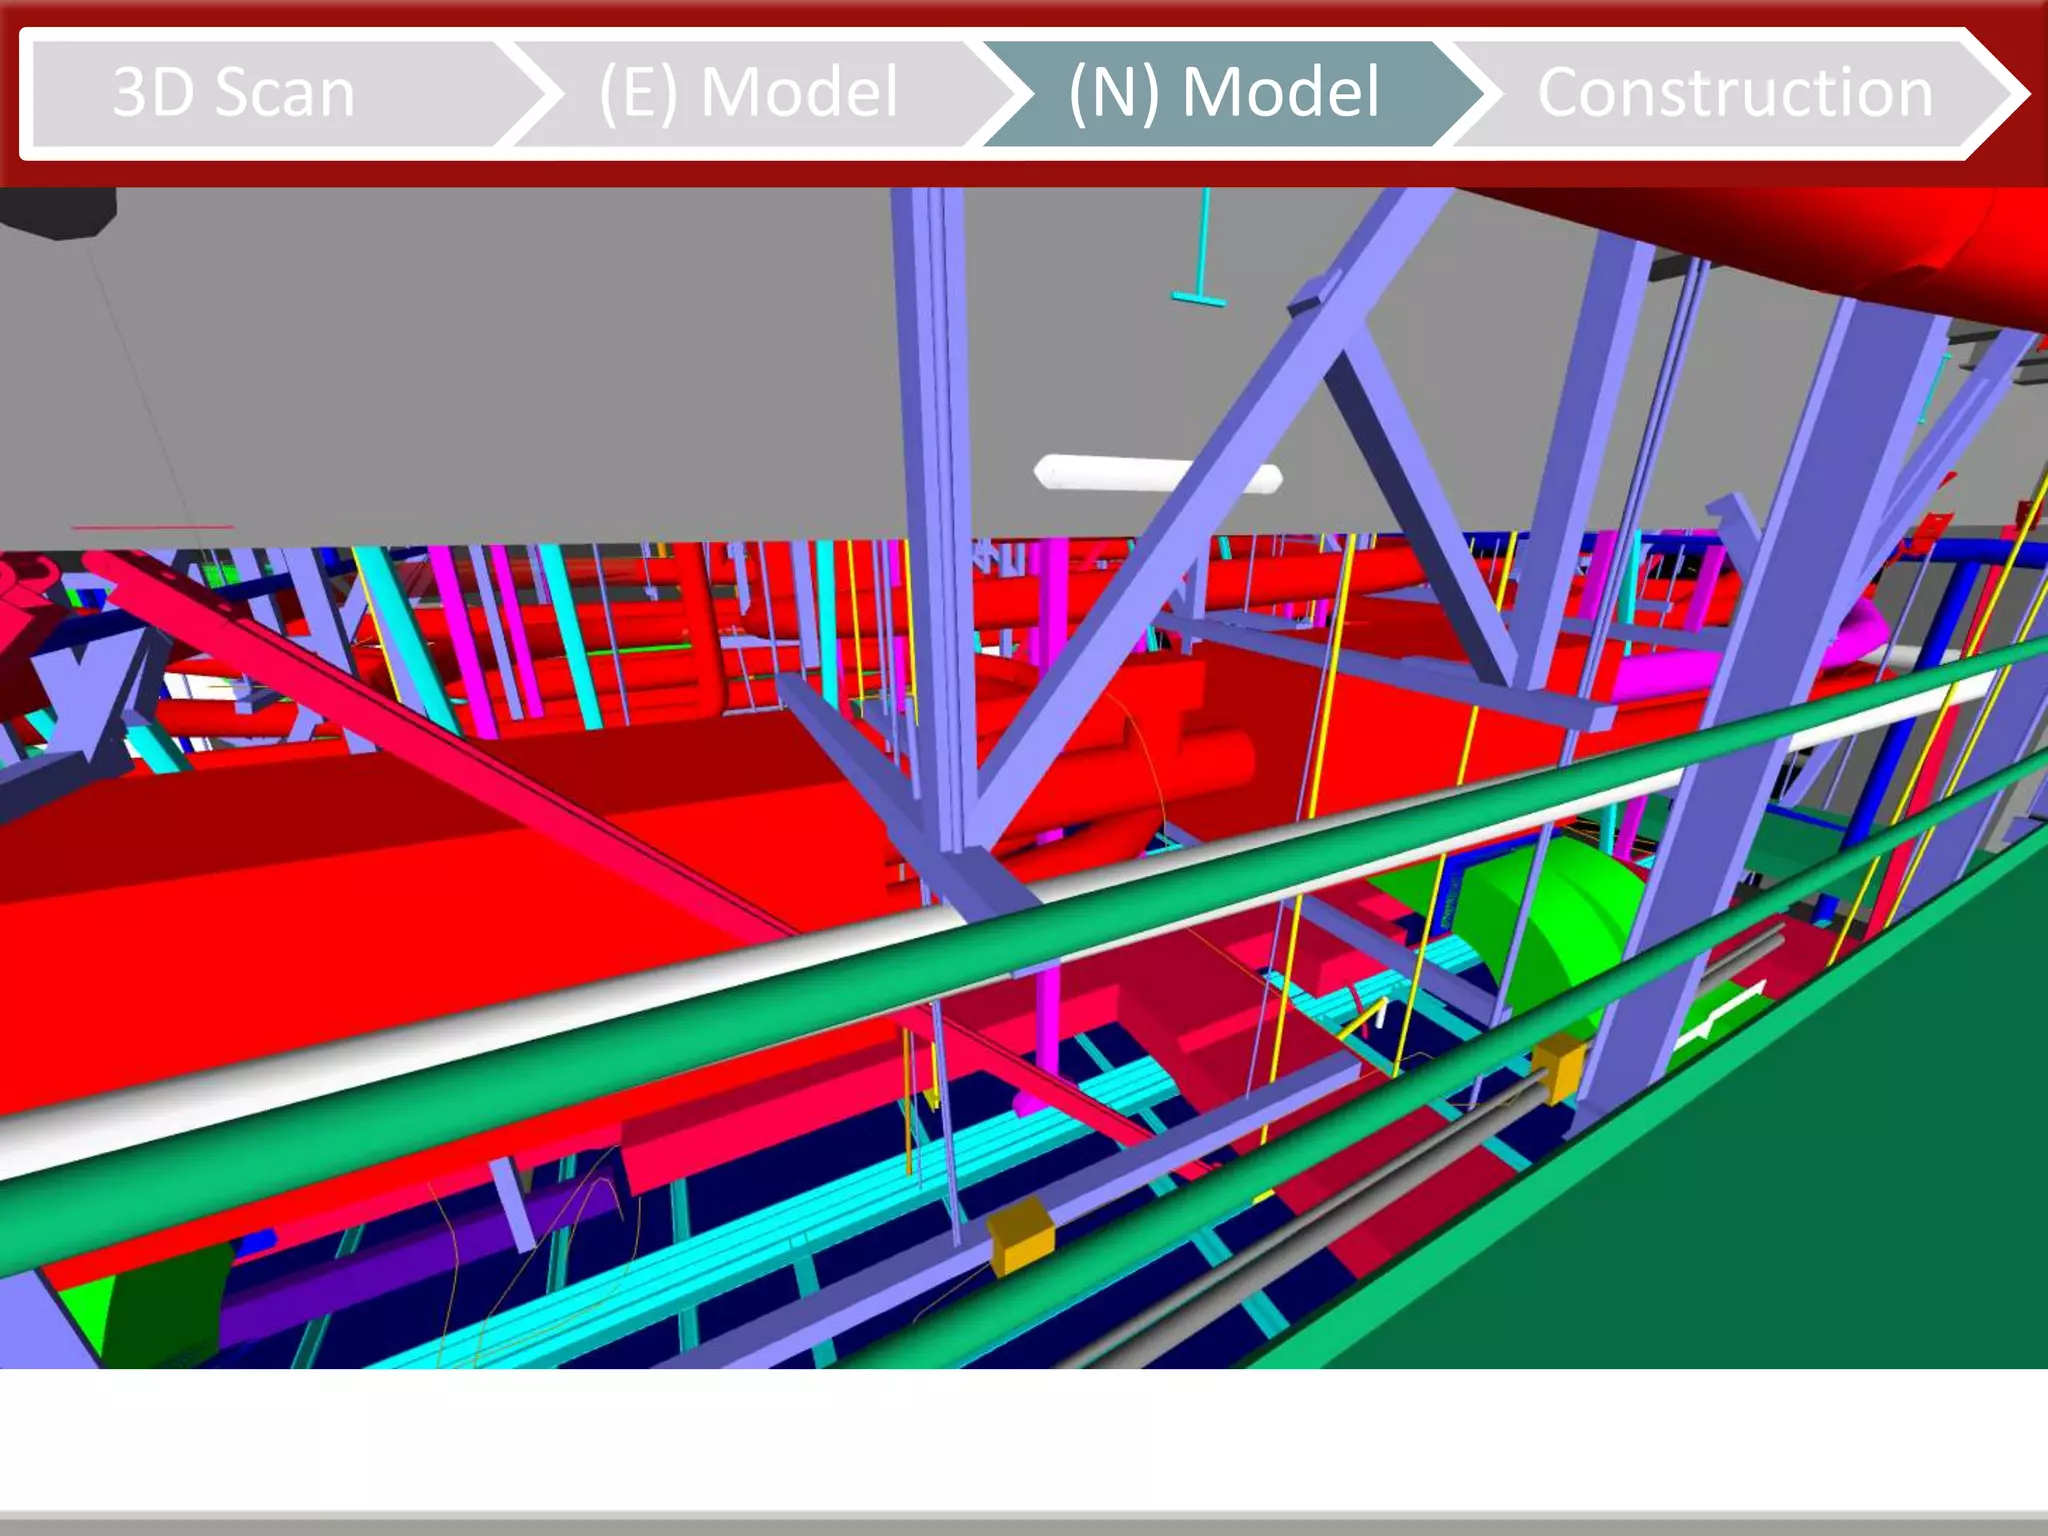
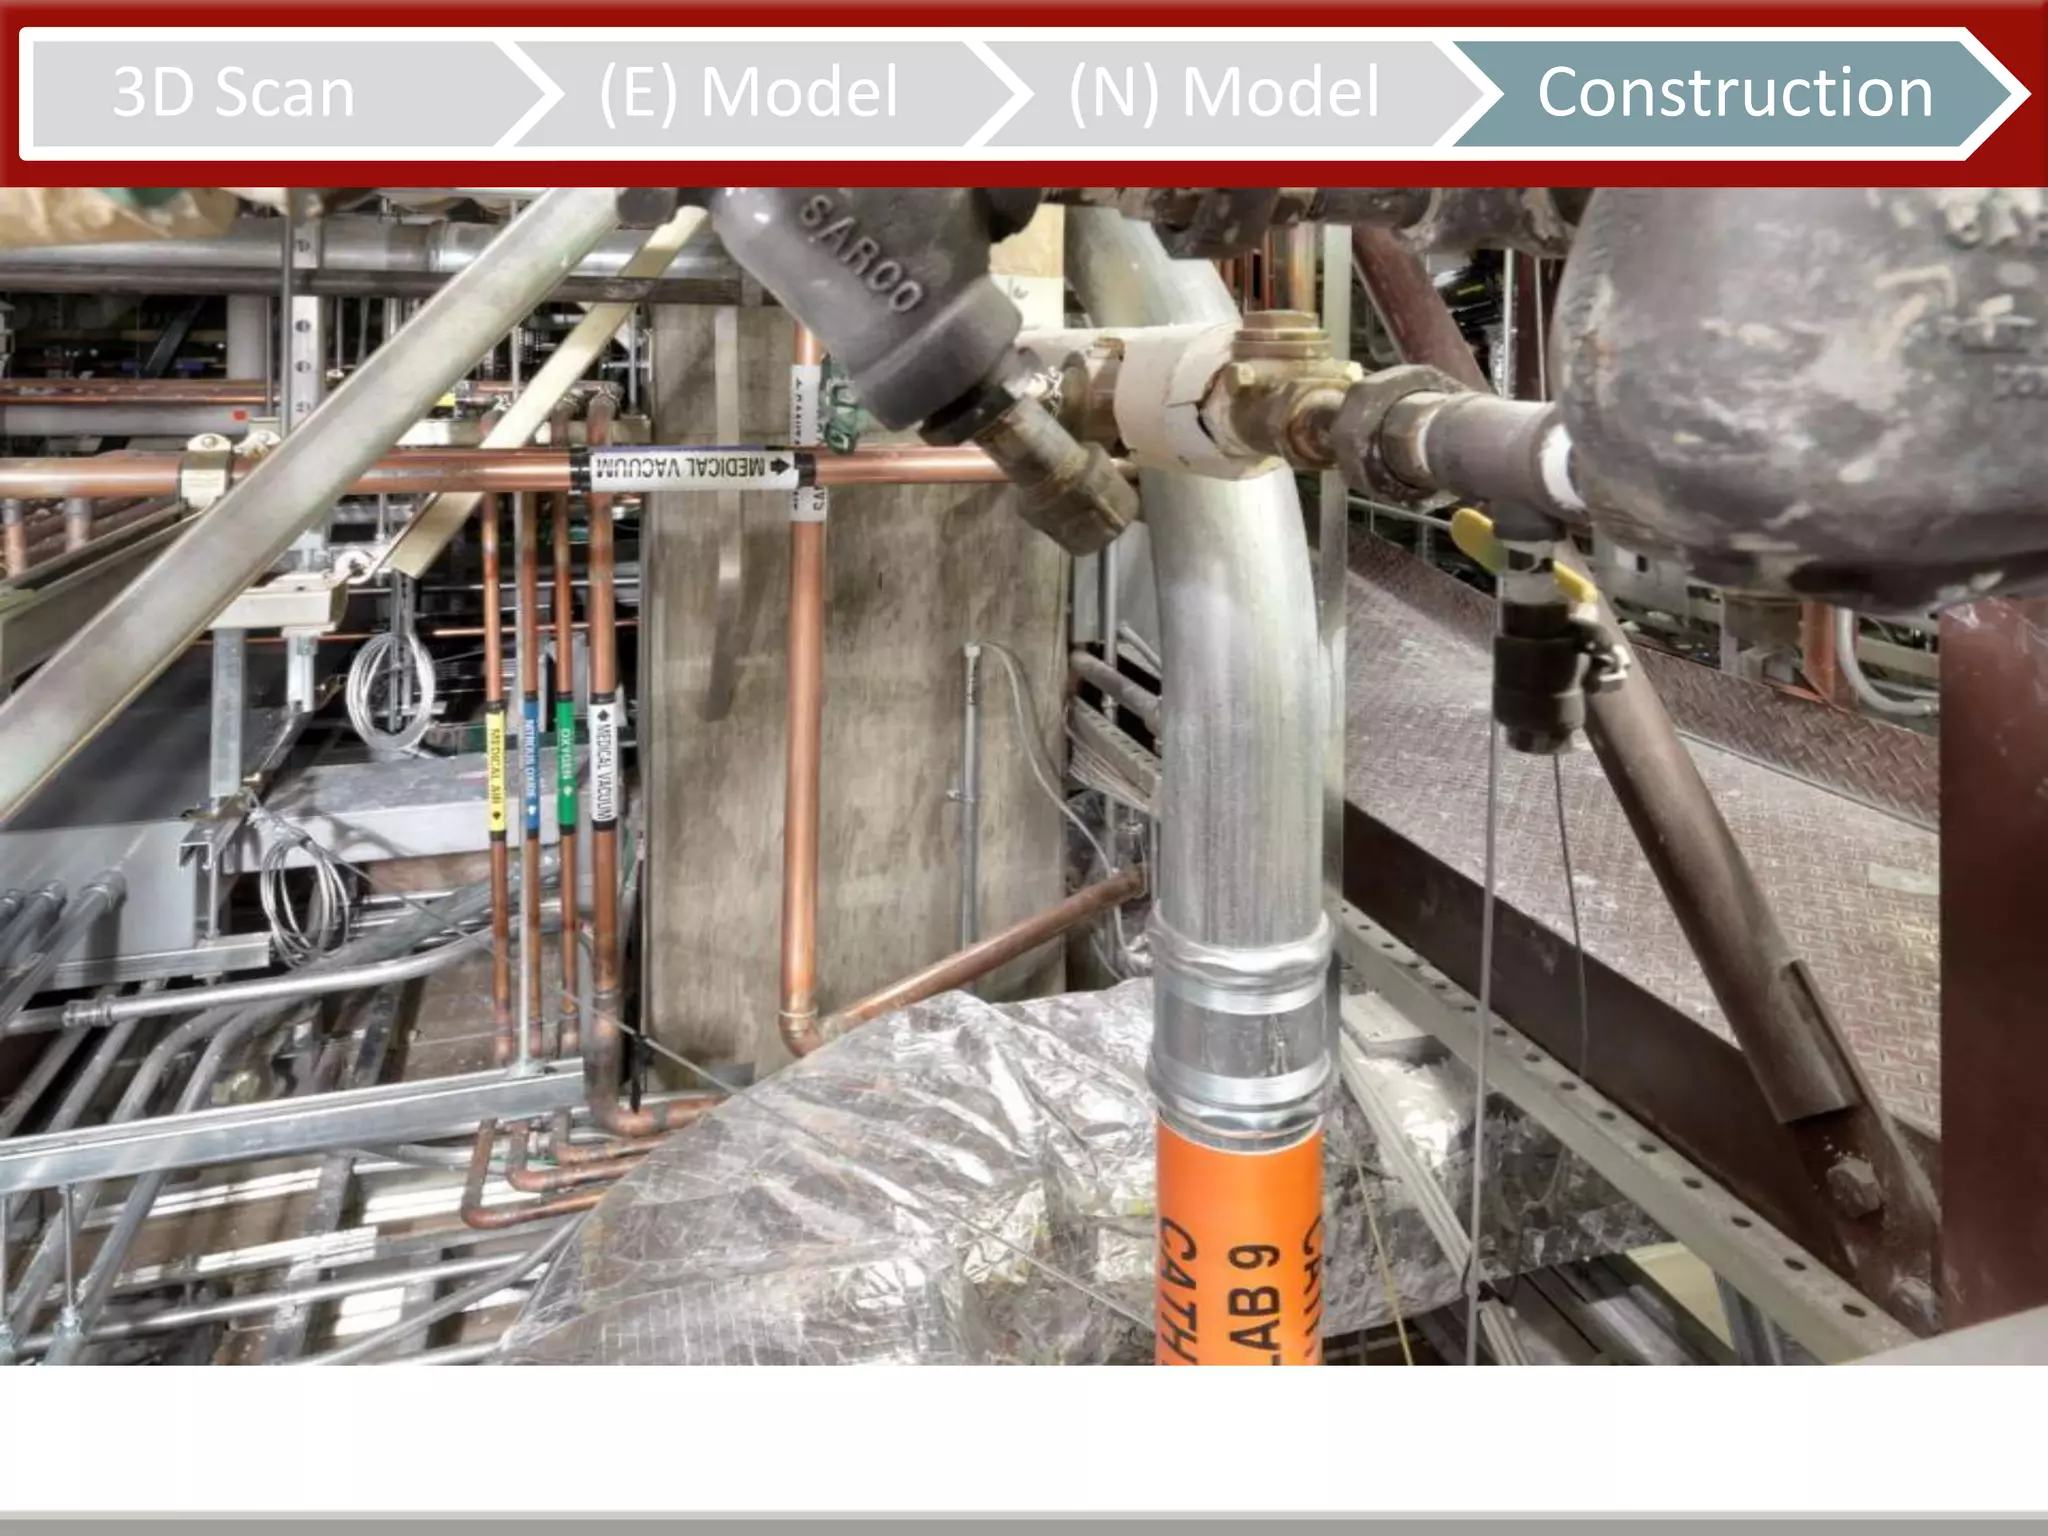
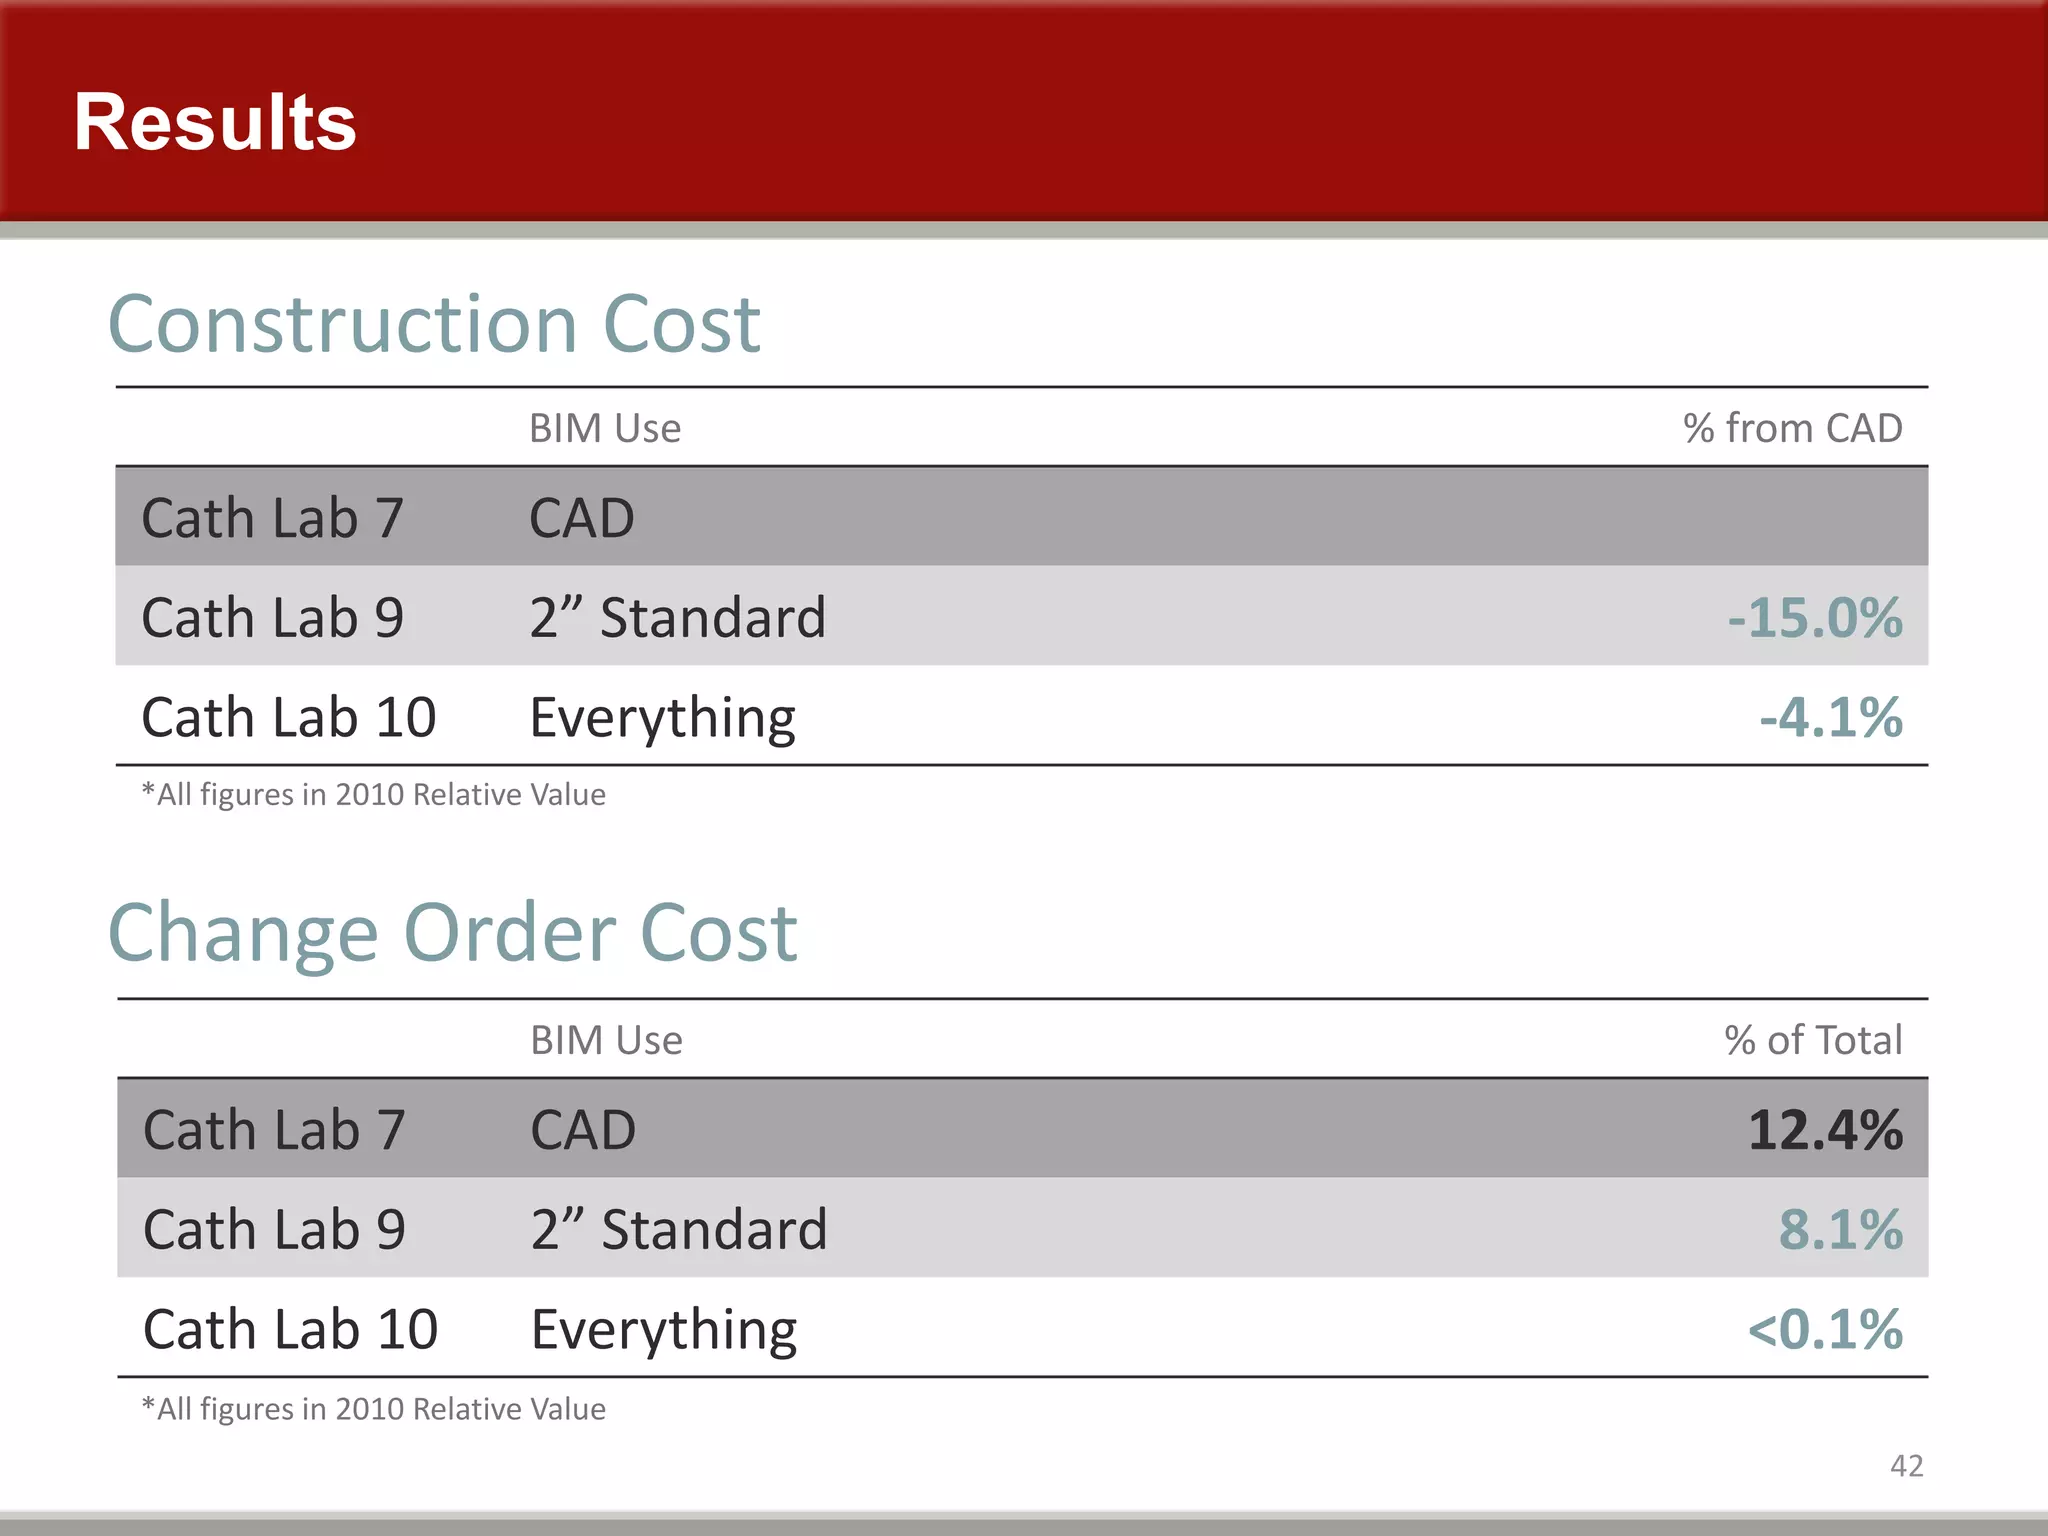
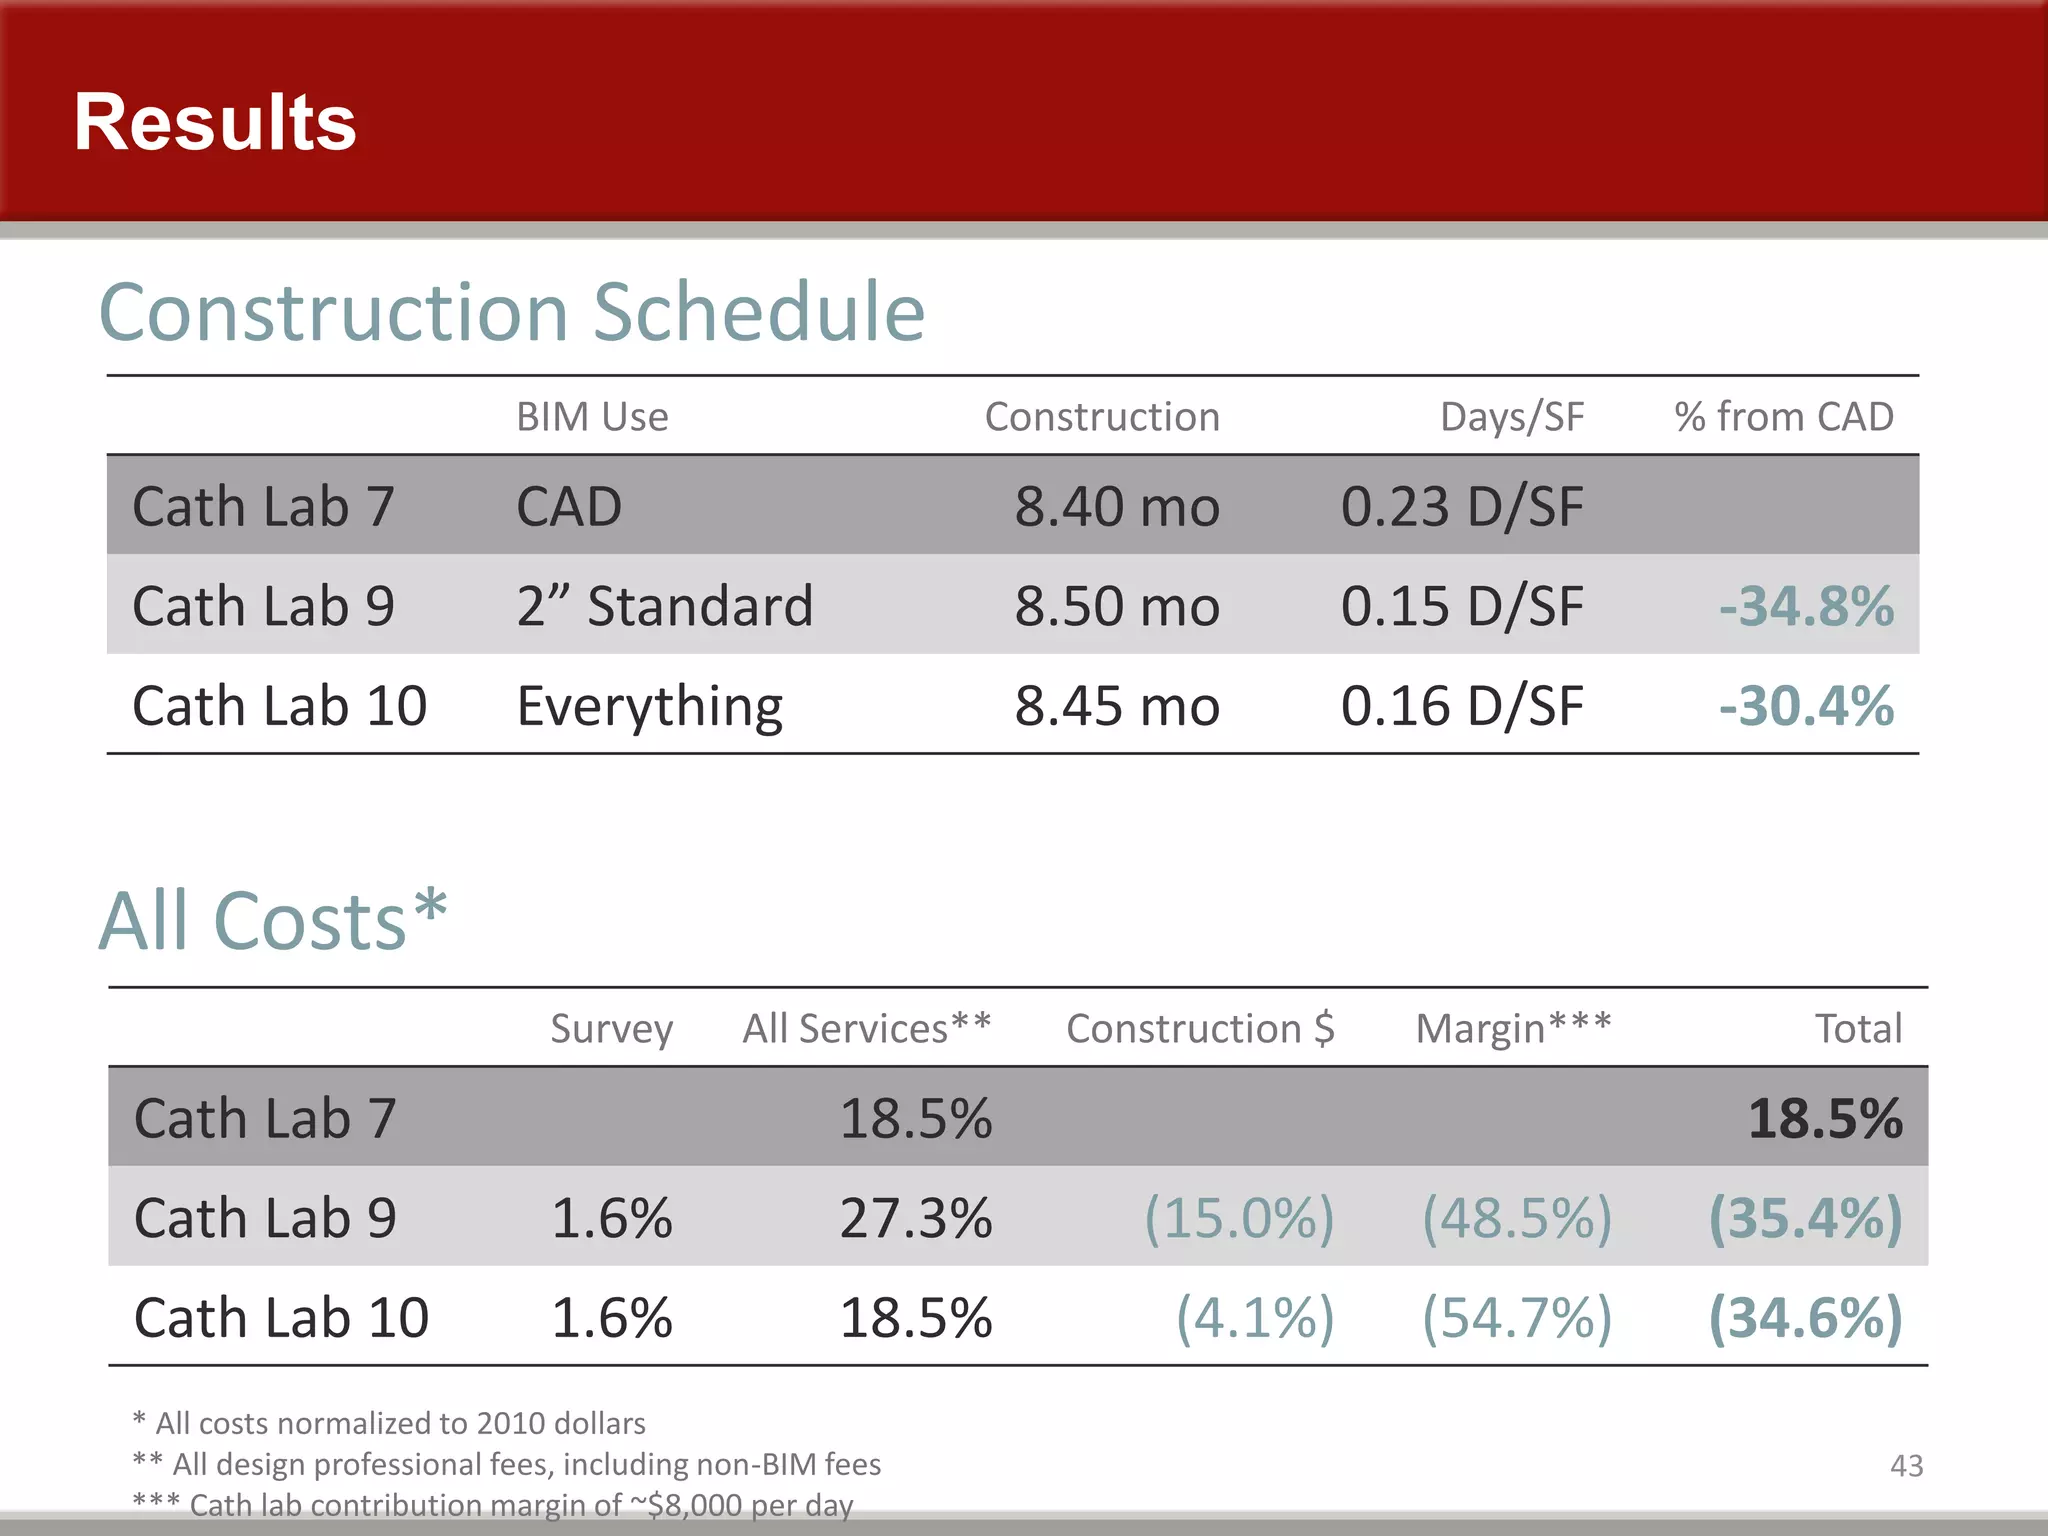
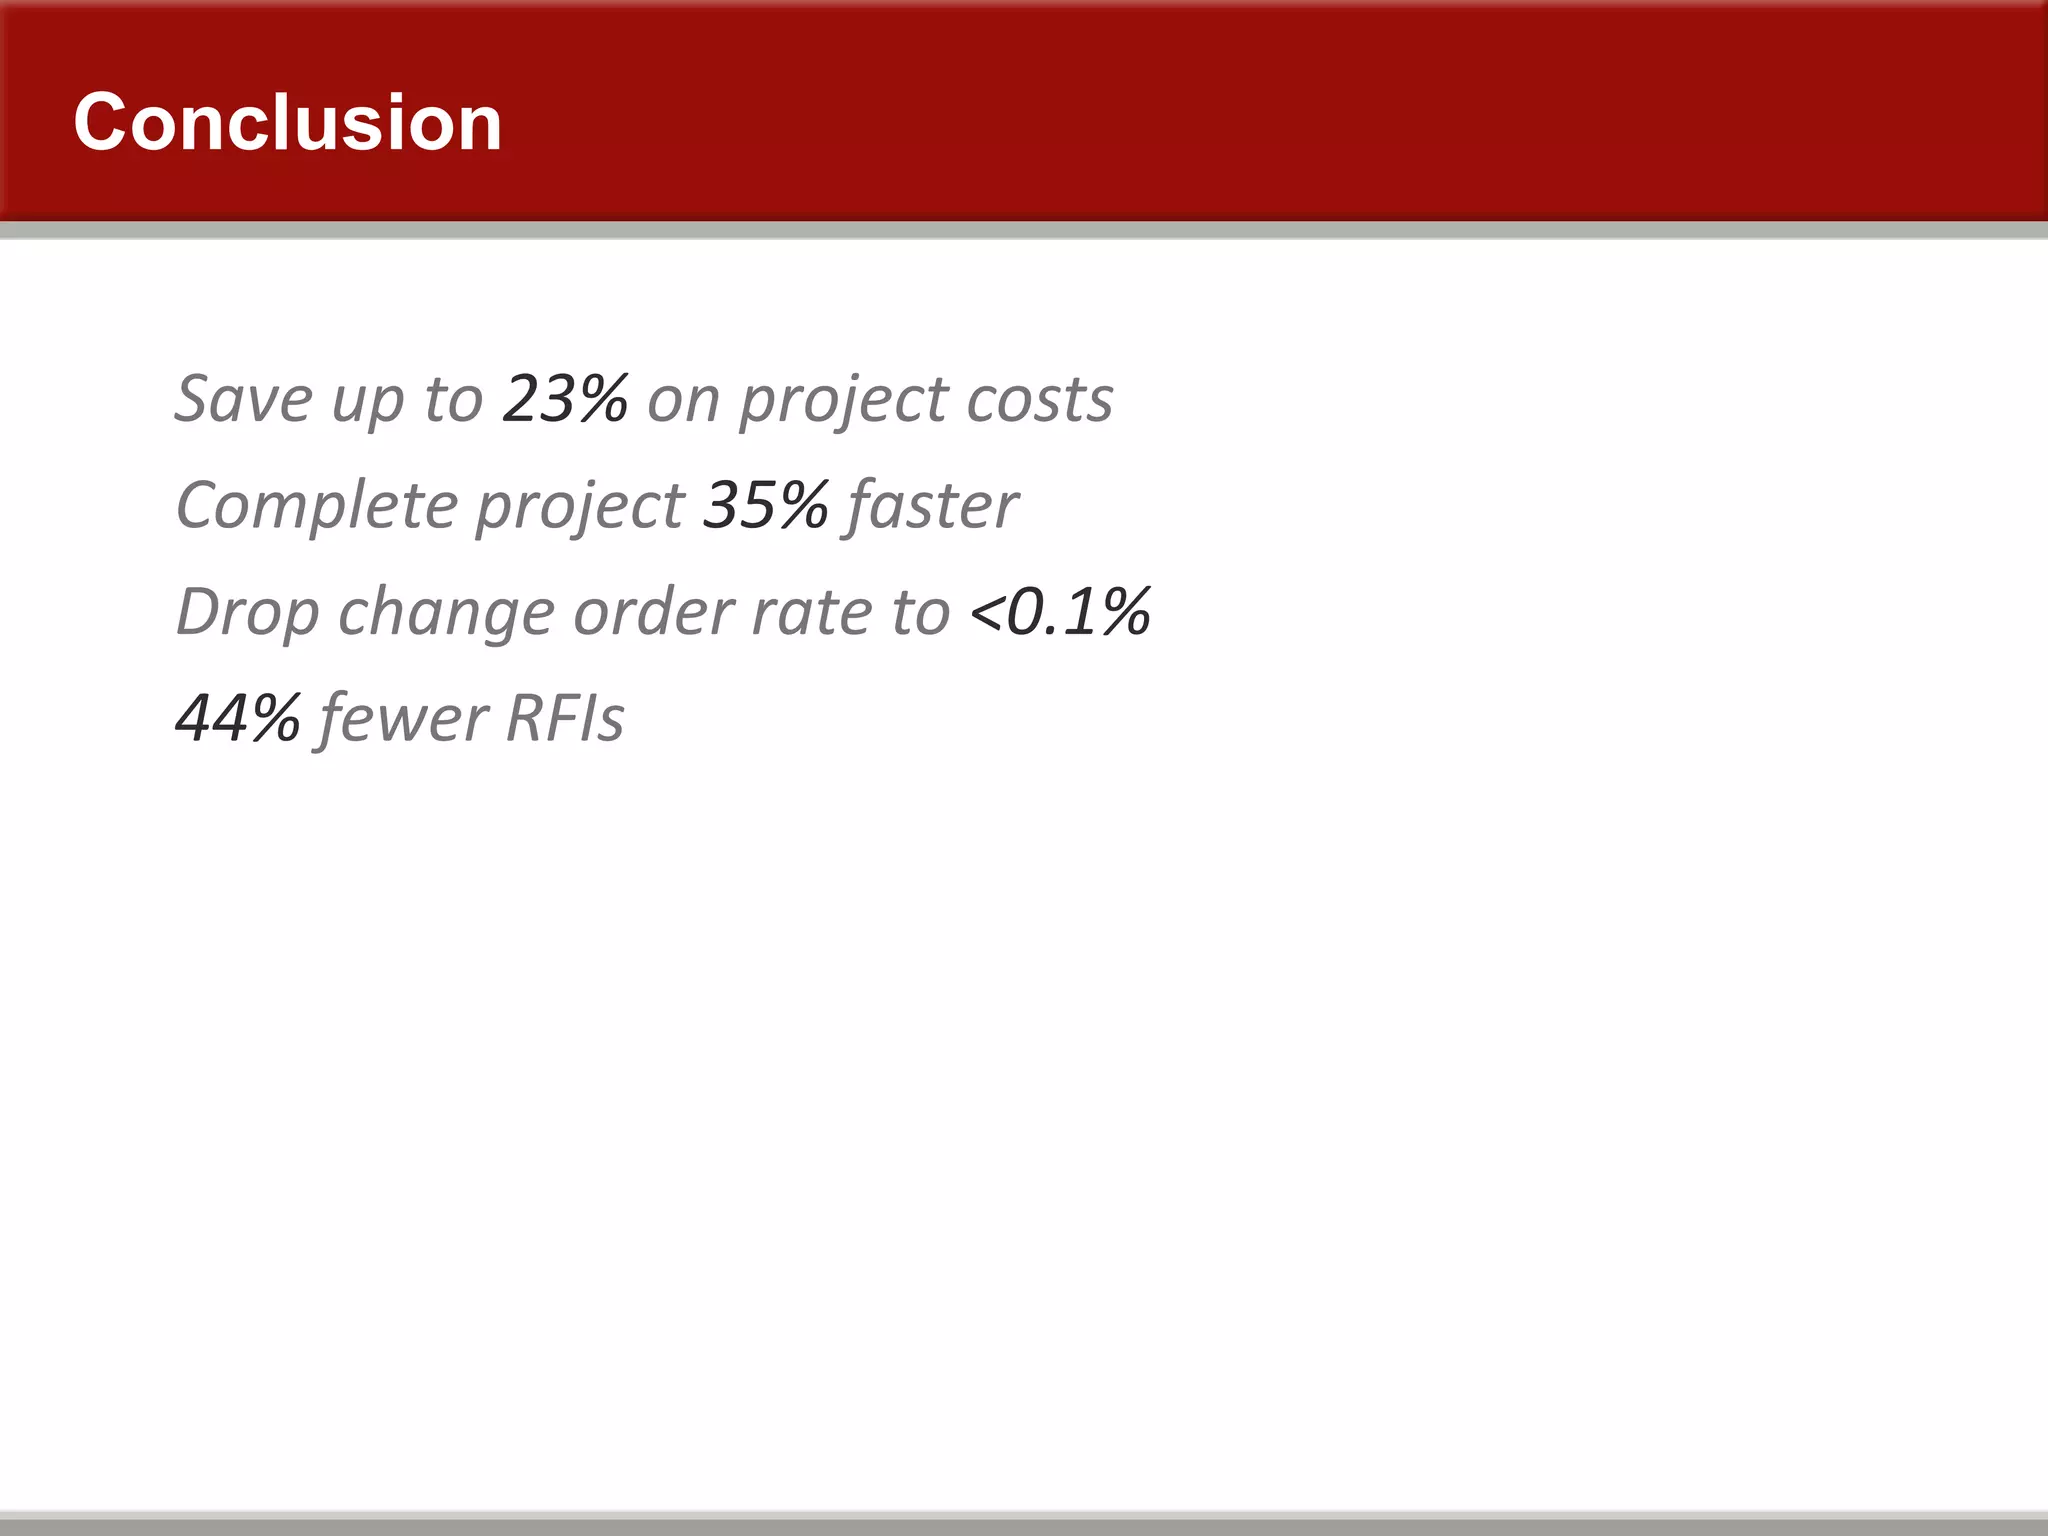
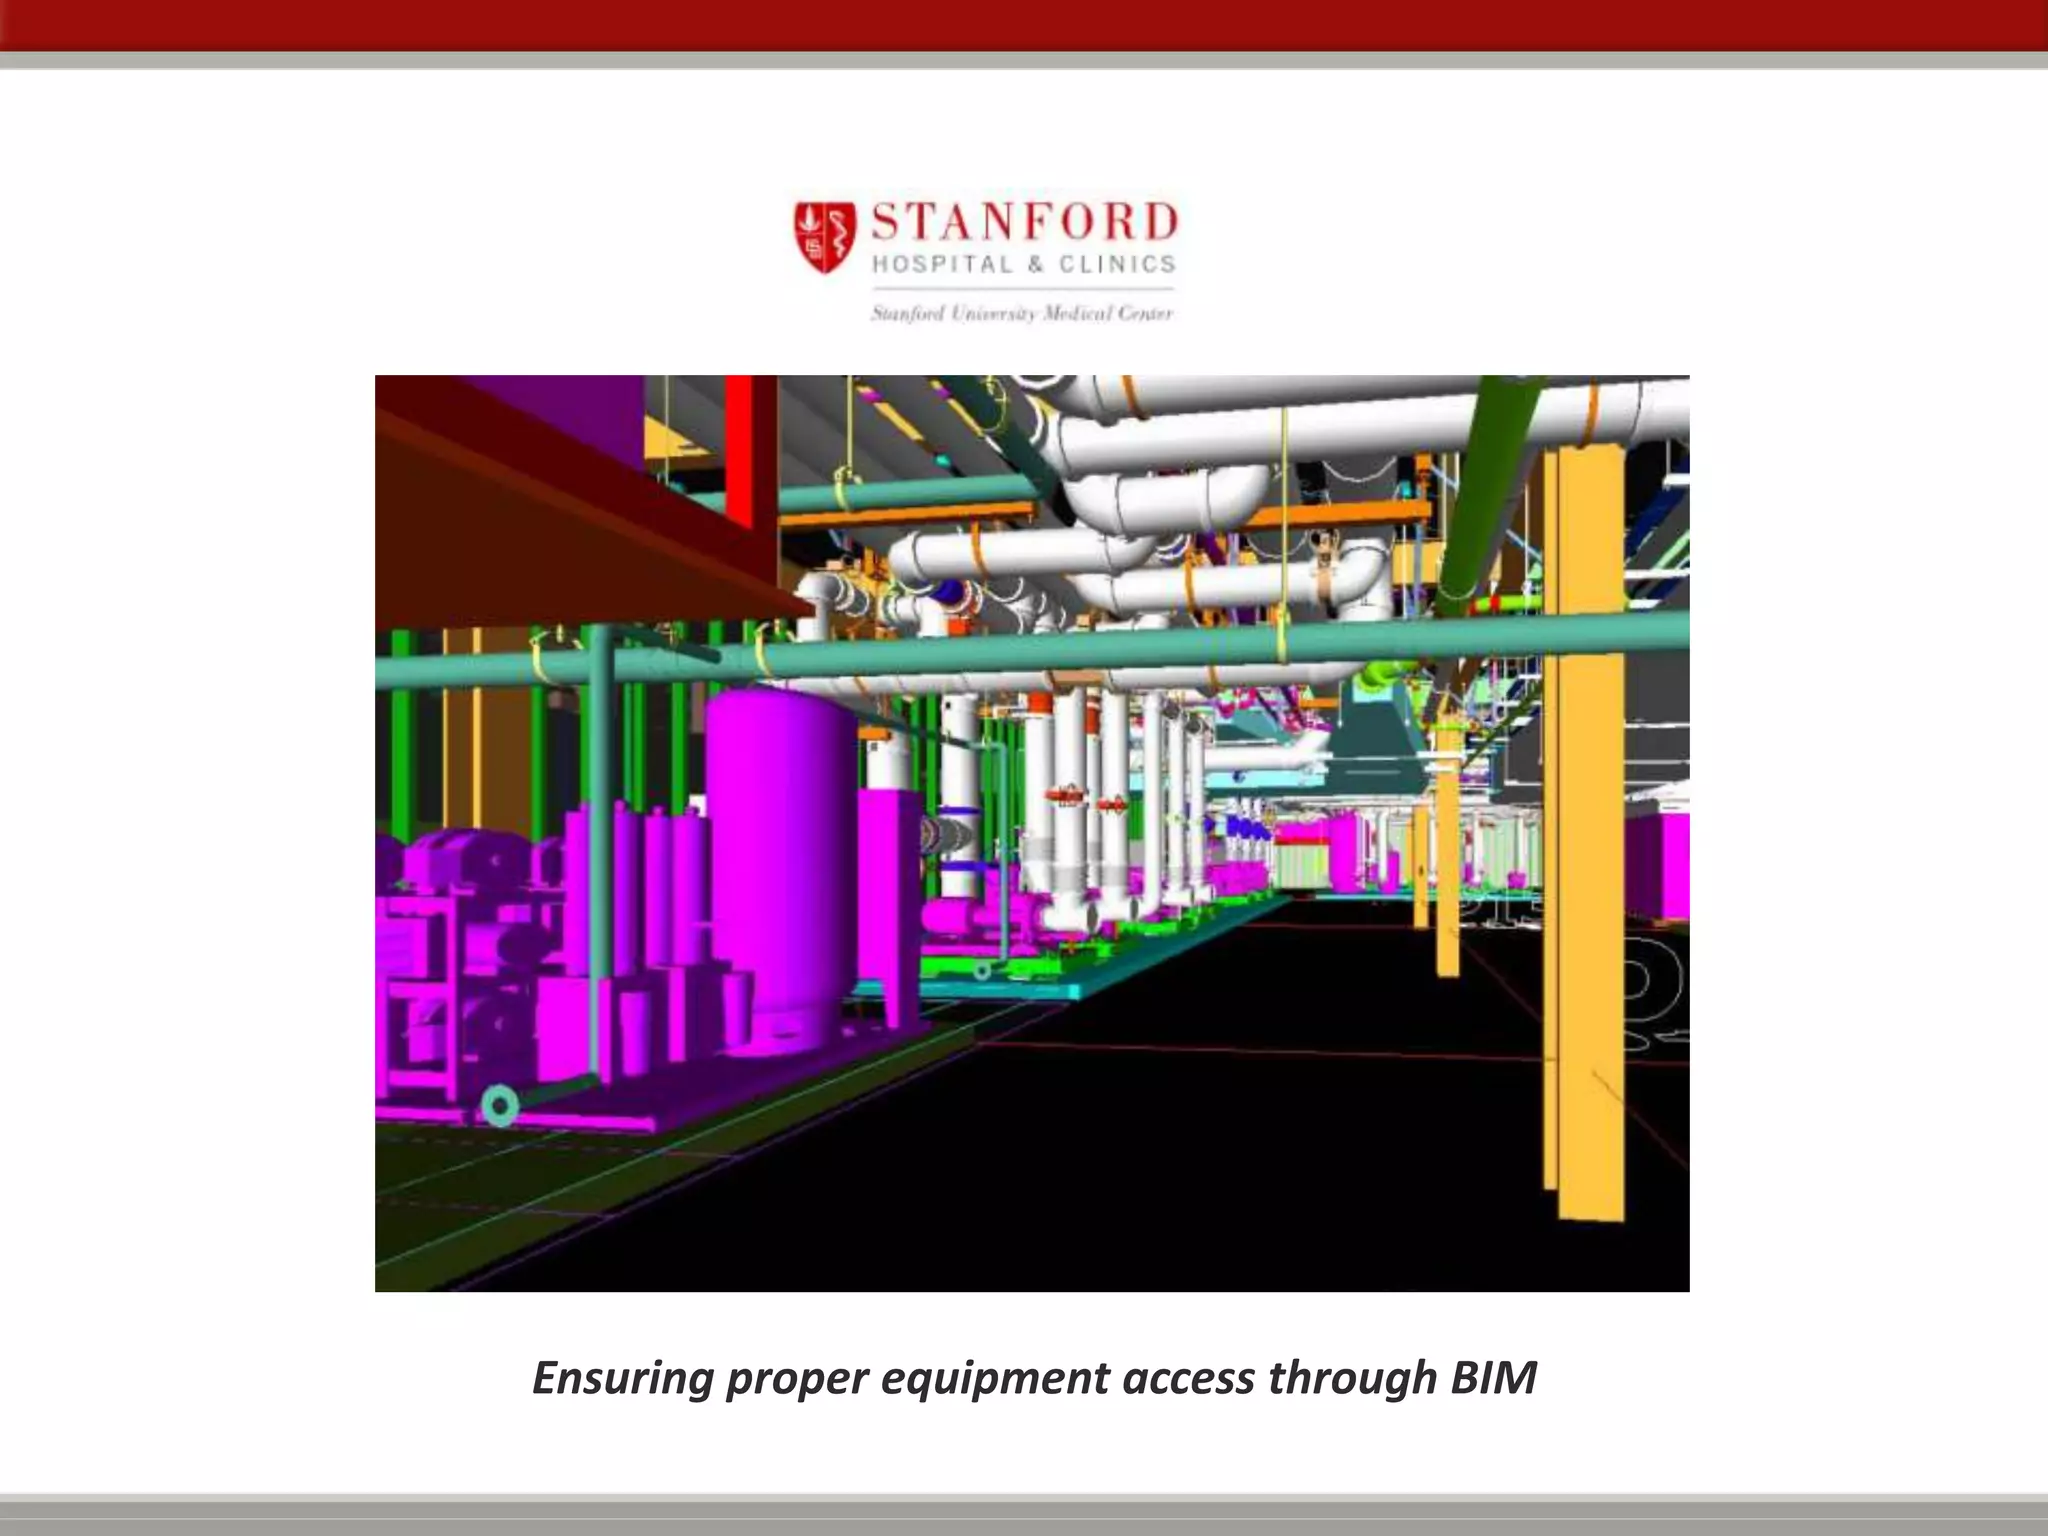
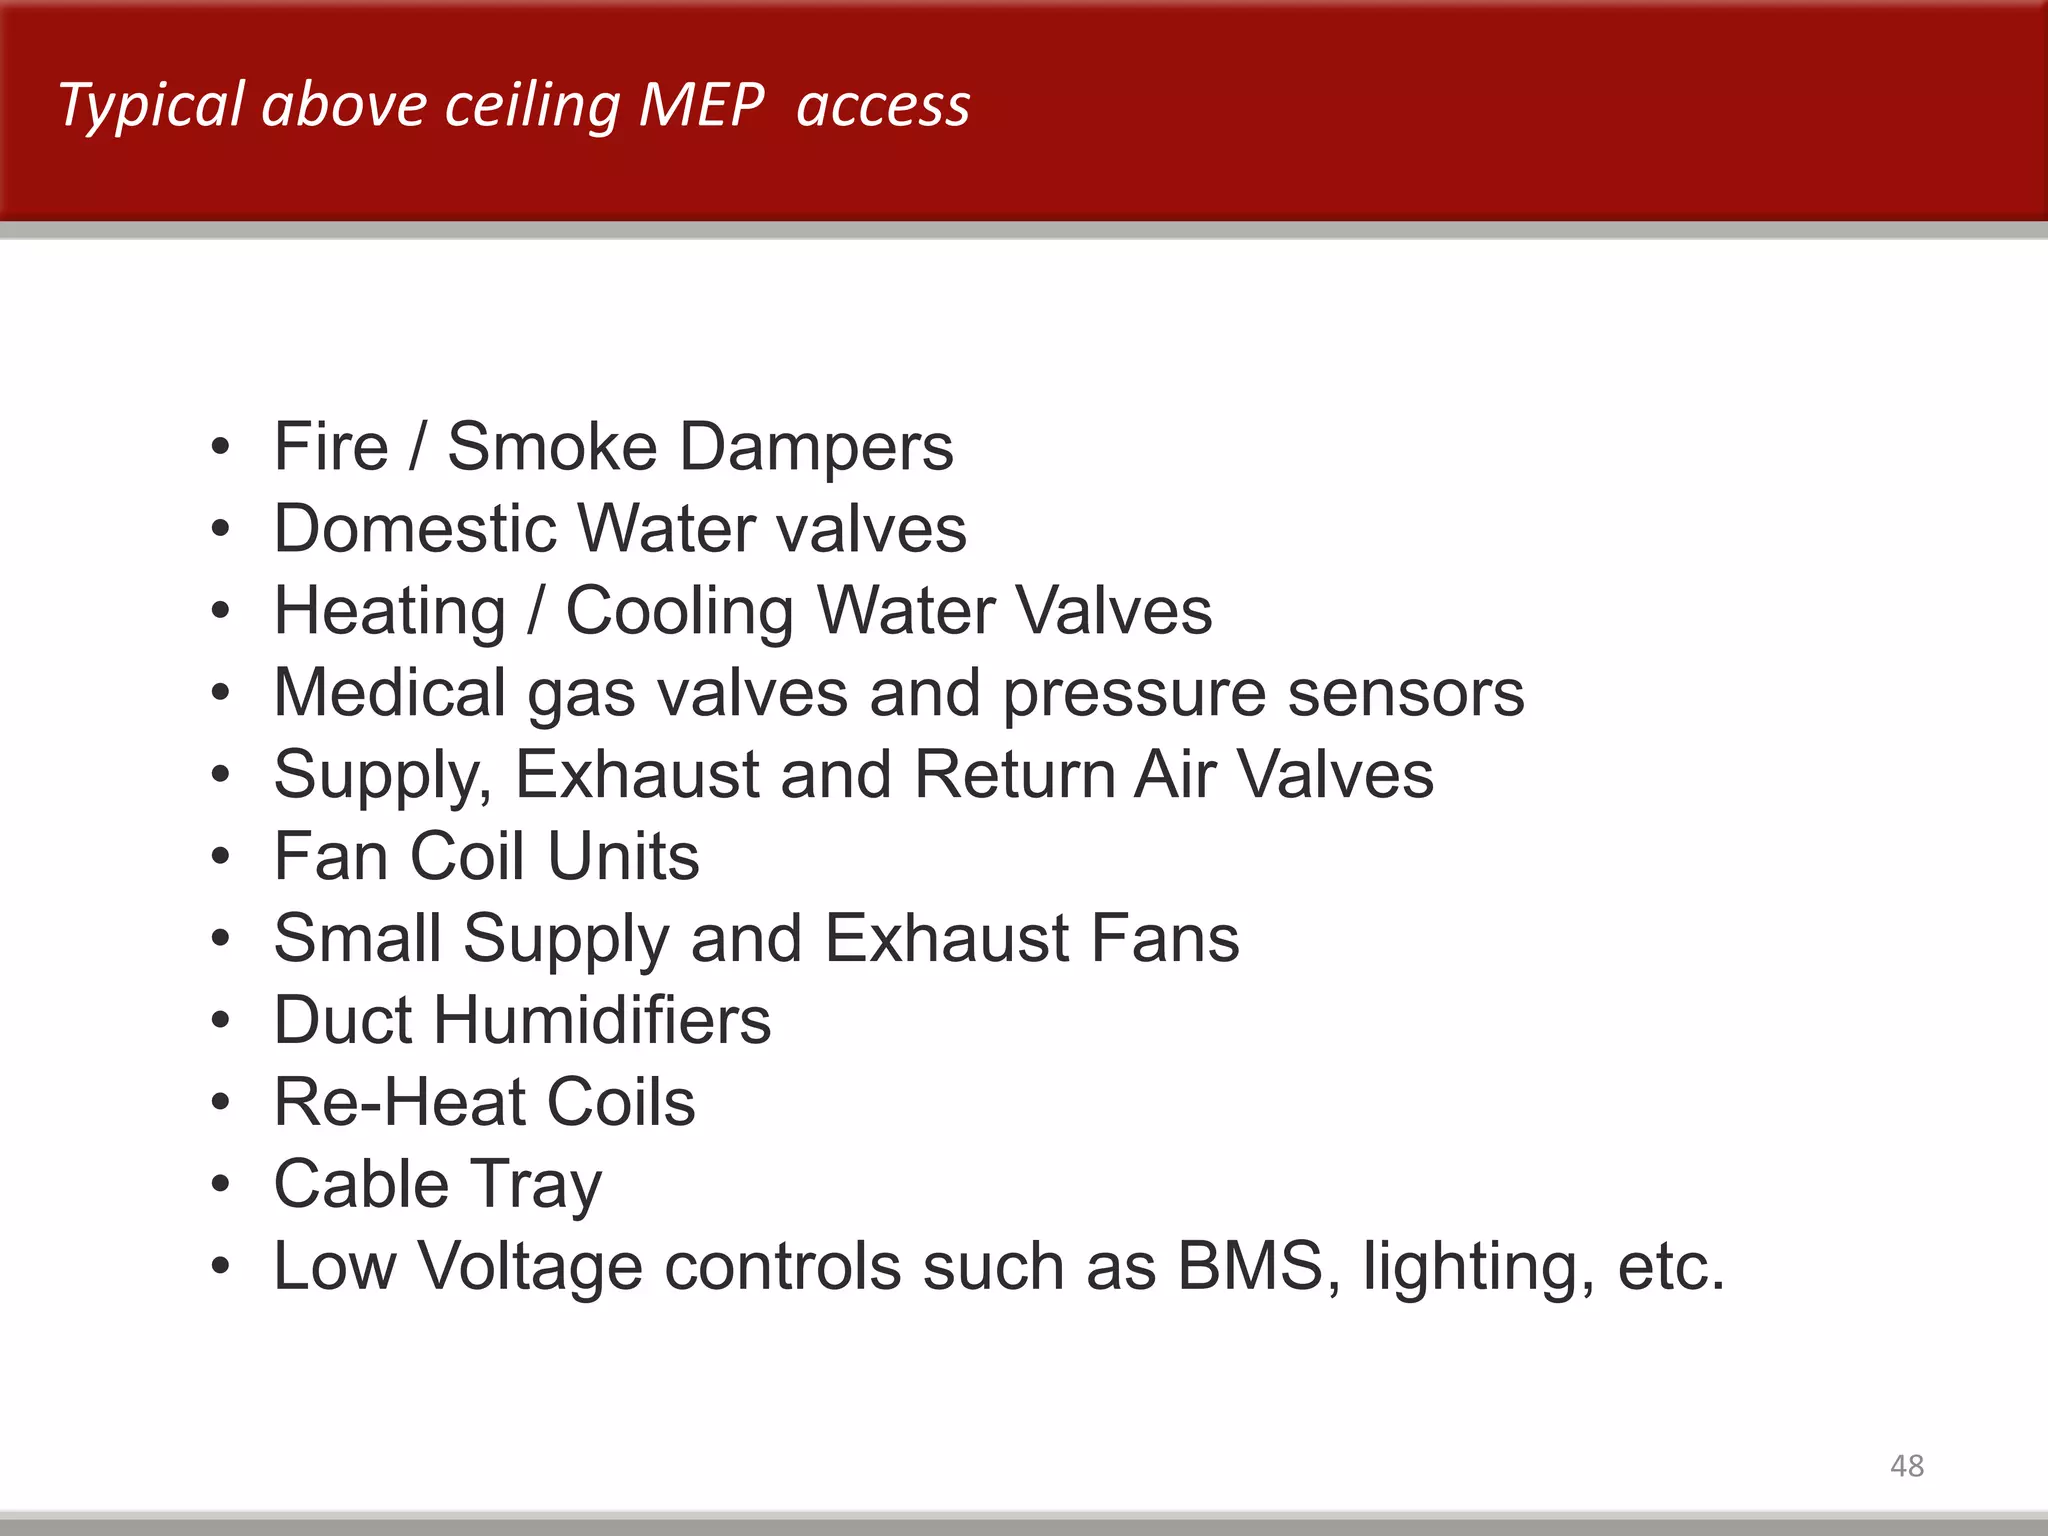
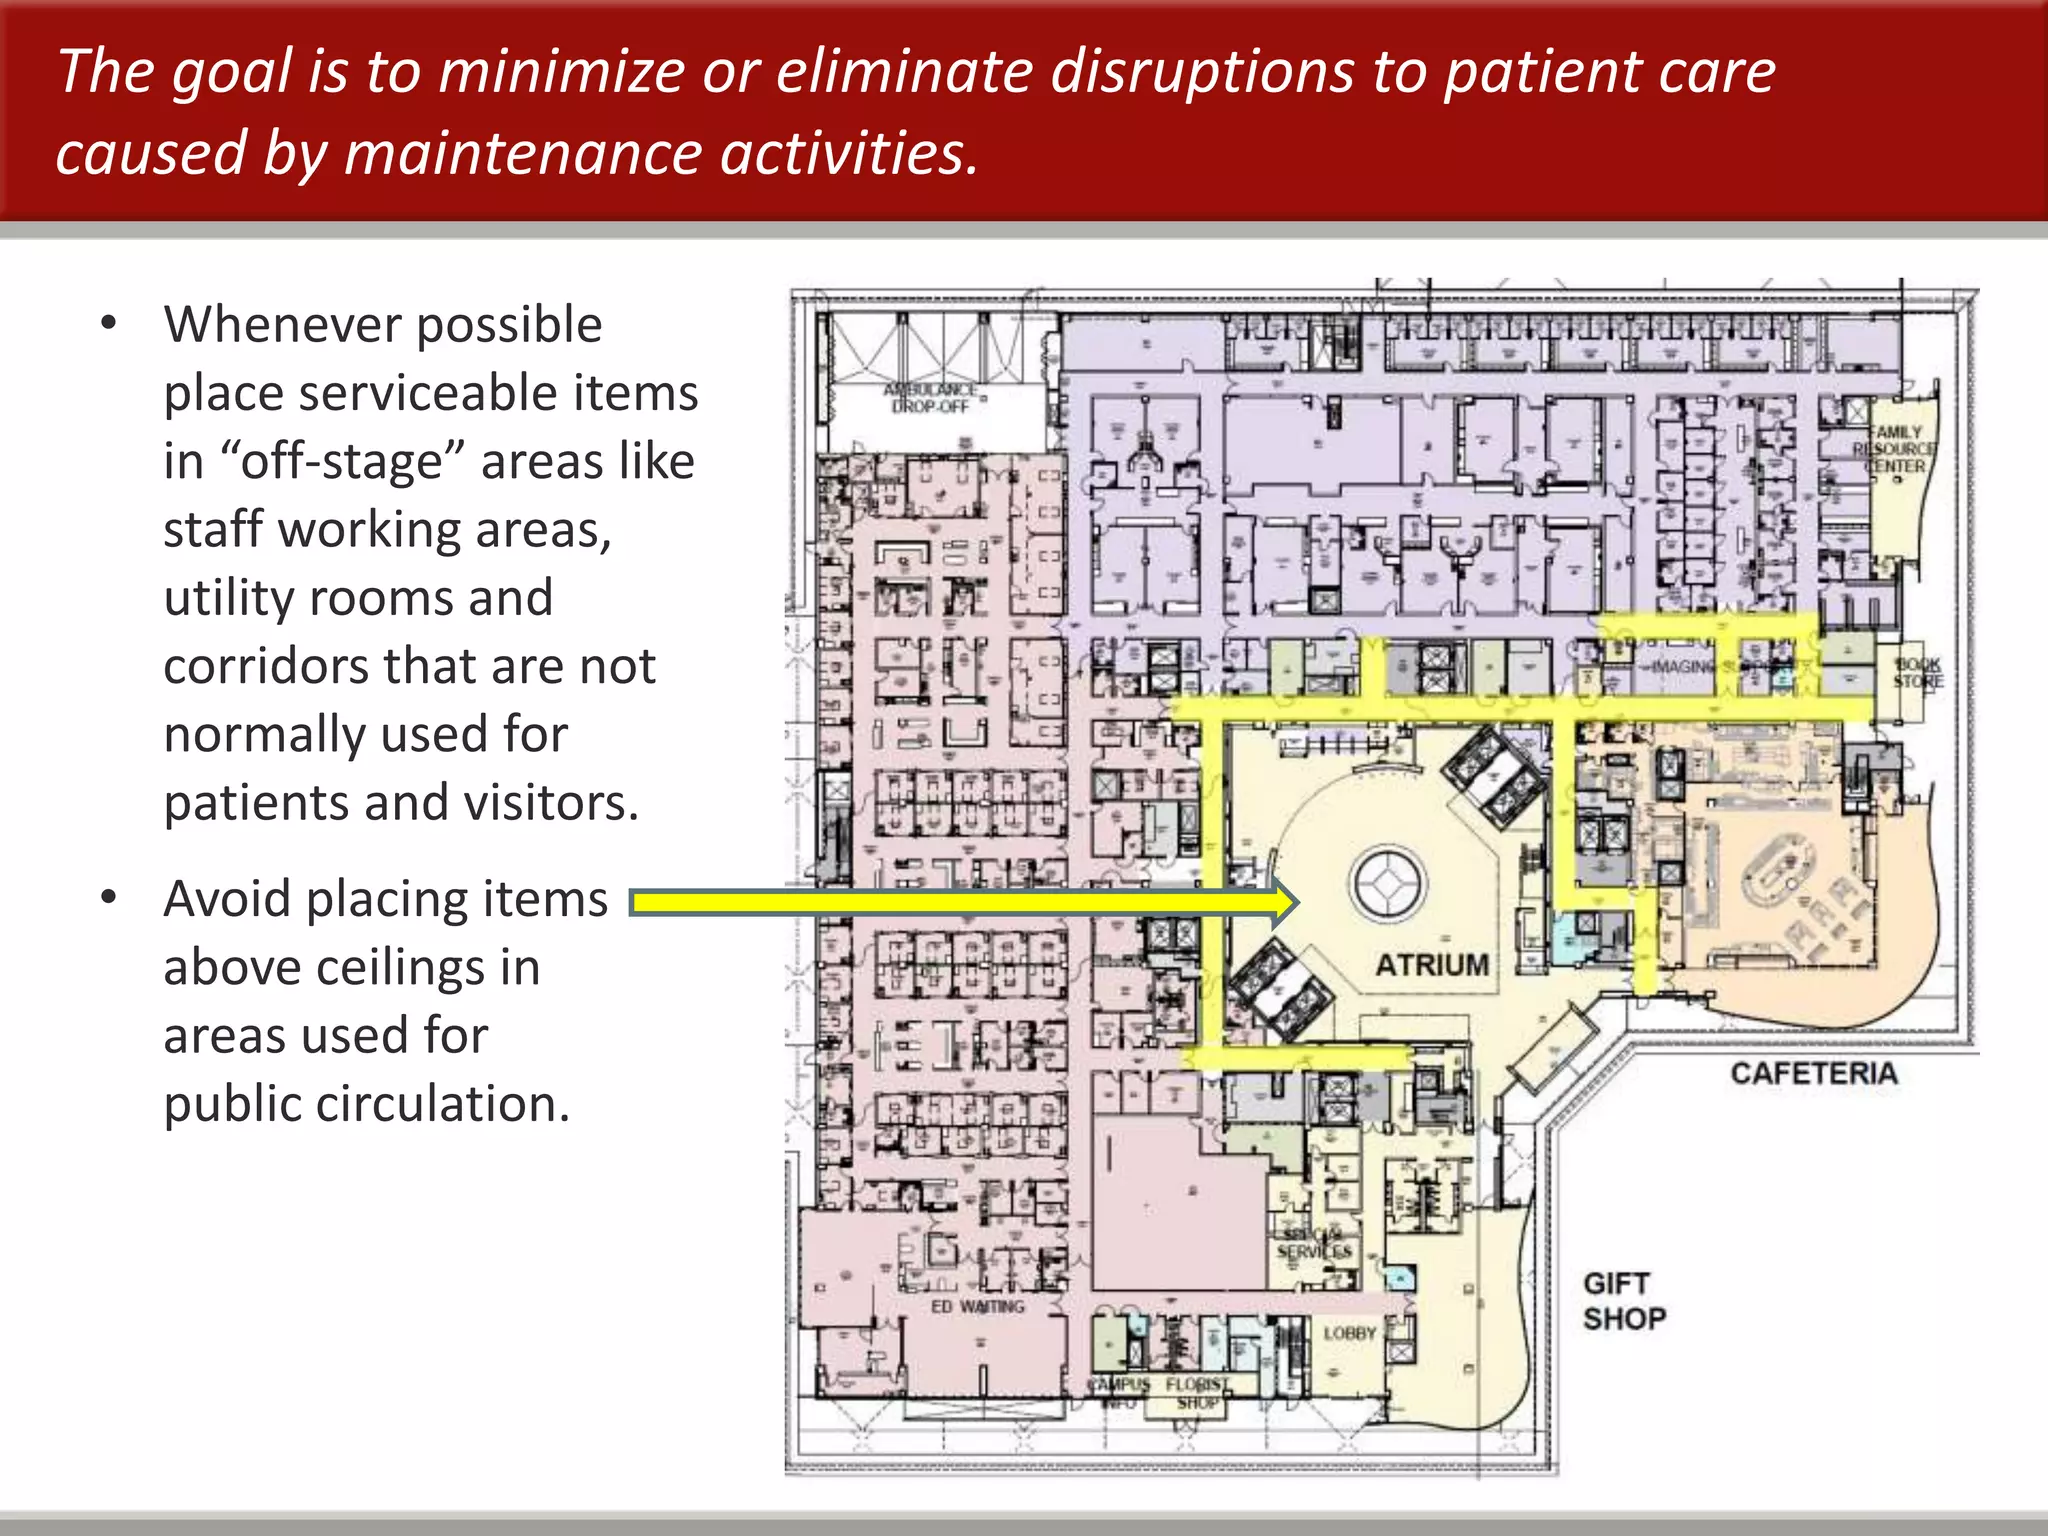
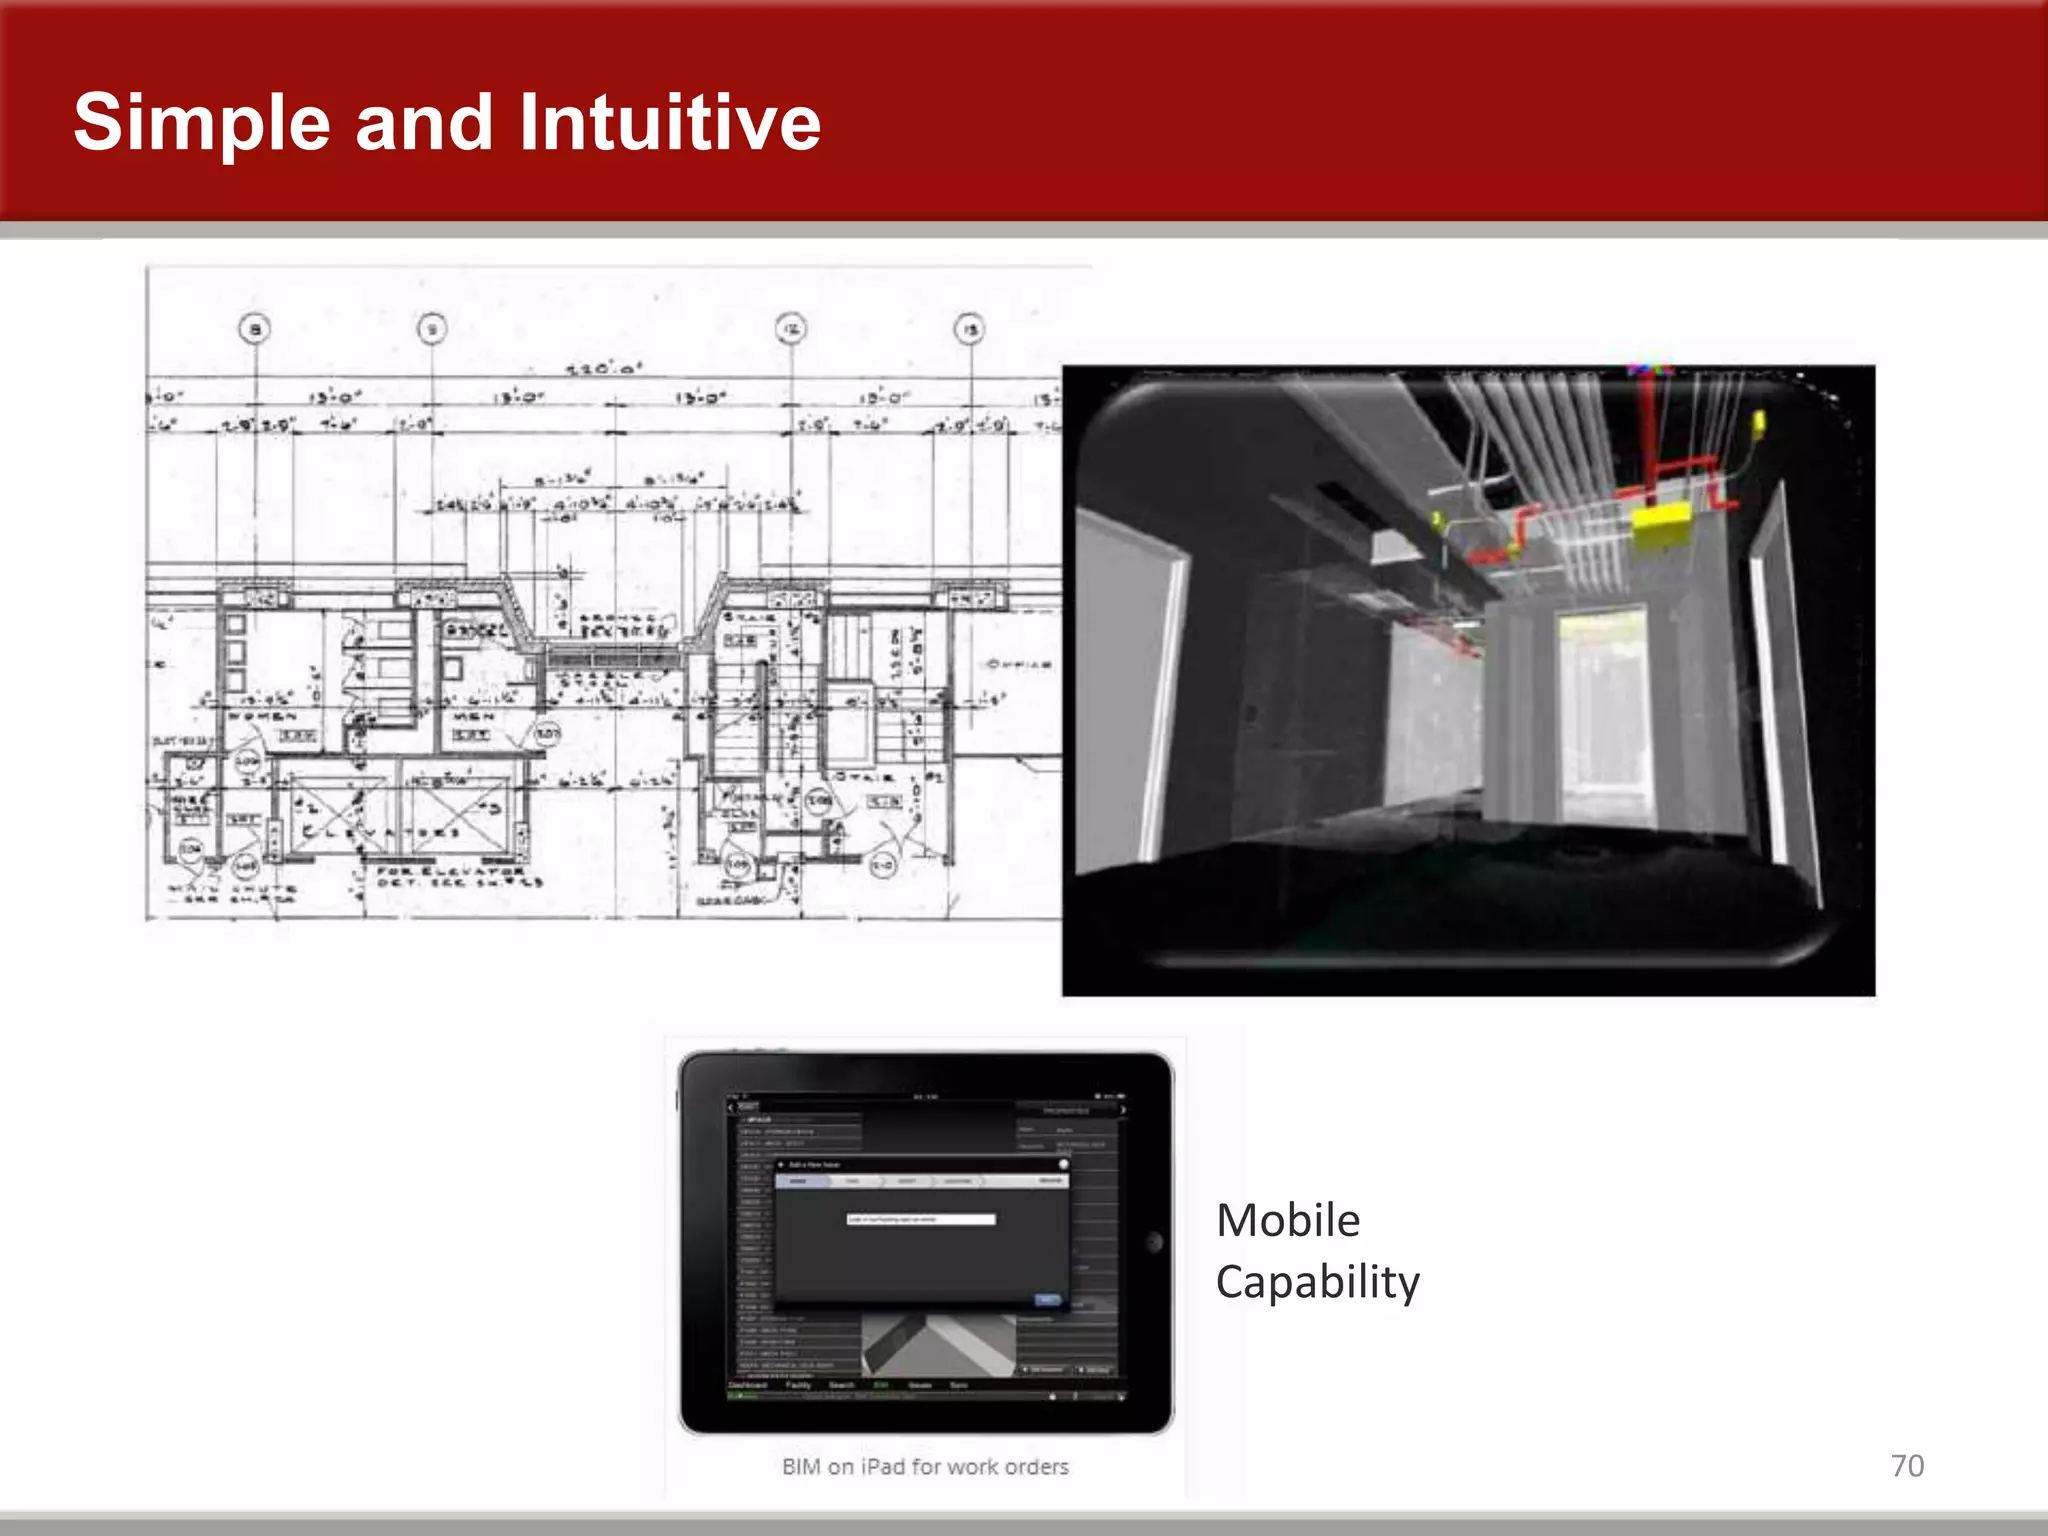
BIM at Stanford Hospital and Clinics
April 2014
Stanford Hospital and Clinics
Stanford Main Campus
Stanford Hospital and Clinics
Existing Hospital
New Hospital
Advanced Medicine Center
LPCH
LPCH Expansion
1.1M sqft
824K sqft
221K sqft
303K sqft
476k sqft
Stanford Hospital and Clinics
Existing Hospital
New Hospital
Advanced Medicine Center
LPCH
LPCH Expansion
1.1M sqft
824K sqft
221K sqft
303K sqft
476k sqft
Stanford Hospital and Clinics
Existing Hospital
New Hospital
Advanced Medicine Center
LPCH
LPCH Expansion
1.1M sqft
824K sqft
221K sqft
303K sqft
476k sqft
Stanford Hospital and Clinics
Existing Hospital
New Hospital
Advanced Medicine Center
LPCH
LPCH Expansion
1.1M sqft
824K sqft
221K sqft
303K sqft
476k sqft
Stanford Hospital and Clinics
Existing Hospital
New Hospital
Advanced Medicine Center
LPCH
LPCH Expansion
1.1M sqft
824K sqft
221K sqft
303K sqft
476k sqft
Stanford Hospital and Clinics
3M+ sqft on campus
4.5M sqft on and off site and growing
Organization
9
Design and Construction
Engineering & Maintenance
New Stanford
Hospital
Capital
Improvement
Projects
LPCH
Expansion
Project
Engineering &
Maintenance
Stanford Cath Labs 7, 9, & 10
Numeric results of CAD vs. BIM to 2” vs. full BIM
Jason Holbrook David Denysenko Eric Peabody
7
9
10
BIM Use Area* Start**
Cath Lab 7 CAD 720 SF 2006
Cath Lab 9 2” Standard 1,173 SF 2009
Cath Lab 10 Everything 1,060 SF 2010
Experimental Variables
*Results expressed per SF to normalize this variable
**Cost values escalated to 2010 relative value to normalize this variable
Experimental Controls
Potential Savings
Save up to 35% on project costs
Complete project 35% faster
Drop change order rate to <0.1%
44% fewer RFIs
Potential Savings
35% less $
Complete project 35% faster
Drop change order rate to <0.1%
44% fewer RFIs
Potential Savings
Save up to 35% on project costs
35% faster
Drop change order rate to <0.1%
44% fewer RFIs
Potential Savings
Save up to 35% on project costs
Complete project 35% faster
Changes to <0.1%
44% fewer RFIs
Potential Savings
Save up to 35% on project costs
Complete project 35% faster
Drop change order rate to <0.1%
44% fewer RFIs
Cath Lab 7
19
Cath Lab 7
CAD Only
7
Cath Lab 7: Siemens Biplane Cath Lab
Project Area: 720 Gross Square Feet Construction Start: 2006
Procedure Room: 600 Net Square Feet BIM Use: None
(E) CAD V.I.F. (N) CAD Construction
The delay was caused…by the over-
head structural and M/E/P/FP not
being coordinated. The majority of
the overhead had to be re-designed.
DPR Construction
Cath Lab 7
Cath Lab 9
27
Cath Lab 9
Model to 2”
9
Cath Lab 9: Siemens Biplane Hybrid OR
Project Area: 1,173 Gross Square Feet Construction Start: 2009
Procedure Room: 821 Net Square Feet BIM Use: Model to 2”
3D Scan (E) Model (N) Model Construction
Cath Lab 10
34
Cath Lab 10
Model Everything
10
Cath Lab 10: Siemens Biplane Pediatric Cath Lab
Project Area: 1060 Gross Square Feet Construction Start: 2010
Procedure Room: 717 Net Square Feet BIM Use: Model Everything
3D Scan (E) Model (N) Model Construction
Cath Labs 7, 9, 10
41
Results
Results
42
BIM Use % from CAD
Cath Lab 7 CAD
Cath Lab 9 2” Standard -15.0%
Cath Lab 10 Everything -4.1%
Construction Cost
Change Order Cost
*All figures in 2010 Relative Value
BIM Use % of Total
Cath Lab 7 CAD 12.4%
Cath Lab 9 2” Standard 8.1%
Cath Lab 10 Everything <0.1%
*All figures in 2010 Relative Value
Results
43
BIM Use Construction Days/SF % from CAD
Cath Lab 7 CAD 8.40 mo 0.23 D/SF
Cath Lab 9 2” Standard 8.50 mo 0.15 D/SF -34.8%
Cath Lab 10 Everything 8.45 mo 0.16 D/SF -30.4%
Construction Schedule
All Costs*
* All costs normalized to 2010 dollars
** All design professional fees, including non-BIM fees
*** Cath lab contribution margin of ~$8,000 per day
Survey All Services** Construction $ Margin*** Total
Cath Lab 7 18.5% 18.5%
Cath Lab 9 1.6% 27.3% (15.0%) (48.5%) (35.4%)
Cath Lab 10 1.6% 18.5% (4.1%) (54.7%) (34.6%)
Conclusion
Save up to 23% on project costs
Complete project 35% faster
Drop change order rate to <0.1%
44% fewer RFIs
That Went Well
45
Next Project 6% CO Rate
Not everything was resolved in the model
Some of the same team members
Standard Work is Needed
BIM Procedures Manual
46
Ensuring proper equipment access through BIM
48
• Fire / Smoke Dampers
• Domestic Water valves
• Heating / Cooling Water Valves
• Medical gas valves and pressure sensors
• Supply, Exhaust and Return Air Valves
• Fan Coil Units
• Small Supply and Exhaust Fans
• Duct Humidifiers
• Re-Heat Coils
• Cable Tray
• Low Voltage controls such as BMS, lighting, etc.
Typical above ceiling MEP access
49
The goal is to minimize or eliminate disruptions to patient care
caused by maintenance activities.
• Whenever possible
place serviceable items
in “off-stage” areas like
staff working areas,
utility rooms and
corridors that are not
normally used for
patients and visitors.
• Avoid placing items
above ceilings in
areas used for
public circulation.
50
Ceiling Access through an Infection Control Cube
Containment cubes are typically just
slightly larger than the 2’ X 4’ ceiling
tile opening.
An opened 8’ ladder barely fits
within the cube.
51
Plastic “Zip Wall” Containment:
If you can’t use a portable
containment cube the next option
is to build a temporary plastic wall. A valve at or above 16 feet high will
require a 14 foot ladder for safe
access
14 Foot ladder base is over 100” wide
52
1st Floor @ 18’
2nd Floor @ 20’
Patient Floors @ 16’
Ground Floor @ 18’
The New Stanford
Hospital’s deck to deck
heights range from 16’
to 20’.
This makes it easy to
place MEP equipment
out of reach even if
there is nothing
blocking it’s access.
53
MEP Access Zone Guidelines
These guidelines are intended to be used during finite coordination to reduce possible
remodeling and re-coordination efforts needed to maintain maintenance access to
above ceiling MEP equipment.
Fire / Smoke Damper access:
• Accessible from the corridor side.
• Place over break rooms, conference rooms, mechanical and electrical rooms.
Valves:
• Do not install more than 12 feet above the floor.
• Locate valves in corridors, storerooms, utility rooms, etc.
• Never place over nurse’s stations or within patient rooms.
• Do Not locate valves above any patient care room door.
Do not place MEP serviceable items above fixed equipment, shelving or
casework.
How Stanford is addressing access issues during modeling:
54
MEP Access Zone Guidelines continued . . . . .
Supply, Exhaust and Return Air valves:
• Provide access directly below actuators.
• When actuator is on top of unit, place access adjacent to the air valves.
Fan Coil Units, Supply and Exhaust Fans:
• Align ceiling grid, light fixtures, sprinkler heads, etc. with bottom access units to insure
access doors open fully.
• In hard lid ceilings insure access hatches are located on the service side of the
equipment.
Other above ceiling MEP considerations:
• BMS and Lighting Control boxes require front access.
• Medical gas valves and pressure sensors placed below 12’ above the floor.
• Re-Heat coil access to control valves and duct access hatch.
• Consider sharing Cable Tray access zones with other MEP access zones.
55
“Sufficient access is determined not only by above ceiling clearances but by
the ability to use a containment cube and an appropriate sized ladder
placed below the ceiling.”
Reviewing the model for access issues:
56
Access Zones should be modeled to the floor and clashed with
(known) fixed equipment, shelving and casework.
Modeling Access Zones:
57
• Route the cable tray over the duct or use J-hooks to get over the
duct.
• Whenever possible place cable tray 18” – 24” from the wall to share
access zones.
Resolve all access clashes: (or they’ll need to be resolved in the field)
58
• Model review completed after 1st pass Finite Coordination
• Discrepancies logged and shared with the Design Team
• Changes made and closed out during 2nd pass Finite Coordination
Model Reviews and Issues Log:
59
Taking the model to the field to support construction:
BIManywhere Pro iPad App shown here
Using the model in the field is critical to
insuring that the fully coordinated model
becomes a fully coordinated building.
Stanford will be using the model to it’s fullest
potential.
60
For future projects:
1. Make it a requirement to model access zones from the equipment to the
floor below and clash with fixed equipment and furniture.
2. Add the “MEP Access Zones Guidelines” to the BIM Management Plan.
3. Insist on getting experienced Facilities Maintenance staff involved. They are
your best resource for identifying true access issues.
4. Keep it reasonable. Access to MEP equipment above ceilings has to be
provided but it doesn’t always have to be easy access.
BiM for Facilities Management
i=information
without information its only a building model
April 2014
Model is complete and building is close to activation?
What Now ?
 Facilities Services & Planning currently maintains
 1.2 million square feet onsite
 1 million square feet offsite
 Staff of 60 building engineers and facility managers with avg of 150
work orders/day
 New Hospital adds 820,000 SF of high demand clinical space consisting
patient rooms, level 1 trauma,ED, surgical, diagnostic and treatment rooms.
 Maintenance of the facility must be 24/7 with no equipment
failures or down time
Current FM Practices
63
• Cost and time needed to develop input for CMMS (normally around $1-
$3per gross SF, takes significant time after startup
• Cost and time needed to refer to paper files when FM problems occur
• Poorer building and equipment performance (lack of adequate data for
preventive maintenance)
Integration
64
BIM is a better tool in reducing time to complete a work
order
65
Service Scenario Assignment
Facilities Engineer is assigned to service HVAC Building with 70 VAV, 8 pumps, 14 fan motors & 2
centrifugal pumps
Equaling = 18 tickets per day per trade
Real Case
66
Nightmare Case
67
Use Case with BIM
68
Potential Cost Savings just for service on VAVs,pumps
and motors
69
Note:
Cost Savings per year in service to
VAVs, pumps and motors related
to HVAC system
Simple and Intuitive
70
Mobile
Capability
Integrated Project Delivery ensure’s delivery of BIM for
FM upfront
Construction Operations Building Information Exchange
72
What is COBie?
• A standard method of exchanging
information that drives down cost
73
COBie
74
COBie
The Plan and current Deliverables
75
Stanford Hospital & Clinics is in the research and discovery Phase
1. Toured several hospital on the east coast and locally and observed:
 Technology is NEW and not fully developed in facilities management
 Lack of data in the model
 Lack of training in facilities maintenance staff
Goals for FY15
Define Use Cases and Specifications
• In 3D model: Simple access to O&M manuals, Warranties, product data and replacement value
• In 3D model: Metadata for all objects ie fire rating, floor type,
• In 2D drawings: MEP and med gas system flow diagrams with shut off valves and Single lines
• Integrated with employee name, dept. & machine
• an ‘energy’ model and ability to compare actual energy use to baseline design energy use
Actions
• Form BIM for FM execution team
• Conduct pilot project and implement use cases in production with staff
• Define BIM gaps in current BIM model and establish BIM deliverables from construction team
Estimate costs to maintain BIM system
• For TI/remodels: update models, drawings, equip. metadata
• Internal staffing and related vendor costs ( BIM Department)
Operating Costs
76
Vision: BIM for FM with complete integration with
CMMS/BAS/Asset Management/Space Management
77

BIM at Stanford - Building Success

  • 1.
    BIM at StanfordHospital and Clinics April 2014
  • 2.
    Stanford Hospital andClinics Stanford Main Campus
  • 3.
    Stanford Hospital andClinics Existing Hospital New Hospital Advanced Medicine Center LPCH LPCH Expansion 1.1M sqft 824K sqft 221K sqft 303K sqft 476k sqft
  • 4.
    Stanford Hospital andClinics Existing Hospital New Hospital Advanced Medicine Center LPCH LPCH Expansion 1.1M sqft 824K sqft 221K sqft 303K sqft 476k sqft
  • 5.
    Stanford Hospital andClinics Existing Hospital New Hospital Advanced Medicine Center LPCH LPCH Expansion 1.1M sqft 824K sqft 221K sqft 303K sqft 476k sqft
  • 6.
    Stanford Hospital andClinics Existing Hospital New Hospital Advanced Medicine Center LPCH LPCH Expansion 1.1M sqft 824K sqft 221K sqft 303K sqft 476k sqft
  • 7.
    Stanford Hospital andClinics Existing Hospital New Hospital Advanced Medicine Center LPCH LPCH Expansion 1.1M sqft 824K sqft 221K sqft 303K sqft 476k sqft
  • 8.
    Stanford Hospital andClinics 3M+ sqft on campus 4.5M sqft on and off site and growing
  • 9.
    Organization 9 Design and Construction Engineering& Maintenance New Stanford Hospital Capital Improvement Projects LPCH Expansion Project Engineering & Maintenance
  • 10.
    Stanford Cath Labs7, 9, & 10 Numeric results of CAD vs. BIM to 2” vs. full BIM Jason Holbrook David Denysenko Eric Peabody
  • 12.
  • 13.
    BIM Use Area*Start** Cath Lab 7 CAD 720 SF 2006 Cath Lab 9 2” Standard 1,173 SF 2009 Cath Lab 10 Everything 1,060 SF 2010 Experimental Variables *Results expressed per SF to normalize this variable **Cost values escalated to 2010 relative value to normalize this variable Experimental Controls
  • 14.
    Potential Savings Save upto 35% on project costs Complete project 35% faster Drop change order rate to <0.1% 44% fewer RFIs
  • 15.
    Potential Savings 35% less$ Complete project 35% faster Drop change order rate to <0.1% 44% fewer RFIs
  • 16.
    Potential Savings Save upto 35% on project costs 35% faster Drop change order rate to <0.1% 44% fewer RFIs
  • 17.
    Potential Savings Save upto 35% on project costs Complete project 35% faster Changes to <0.1% 44% fewer RFIs
  • 18.
    Potential Savings Save upto 35% on project costs Complete project 35% faster Drop change order rate to <0.1% 44% fewer RFIs
  • 19.
    Cath Lab 7 19 CathLab 7 CAD Only
  • 20.
  • 21.
    Cath Lab 7:Siemens Biplane Cath Lab Project Area: 720 Gross Square Feet Construction Start: 2006 Procedure Room: 600 Net Square Feet BIM Use: None
  • 22.
    (E) CAD V.I.F.(N) CAD Construction
  • 23.
    (E) CAD V.I.F.(N) CAD Construction
  • 24.
    (E) CAD V.I.F.(N) CAD Construction
  • 25.
    (E) CAD V.I.F.(N) CAD Construction
  • 26.
    The delay wascaused…by the over- head structural and M/E/P/FP not being coordinated. The majority of the overhead had to be re-designed. DPR Construction Cath Lab 7
  • 27.
    Cath Lab 9 27 CathLab 9 Model to 2”
  • 28.
  • 29.
    Cath Lab 9:Siemens Biplane Hybrid OR Project Area: 1,173 Gross Square Feet Construction Start: 2009 Procedure Room: 821 Net Square Feet BIM Use: Model to 2”
  • 30.
    3D Scan (E)Model (N) Model Construction
  • 31.
    3D Scan (E)Model (N) Model Construction
  • 32.
    3D Scan (E)Model (N) Model Construction
  • 33.
    3D Scan (E)Model (N) Model Construction
  • 34.
    Cath Lab 10 34 CathLab 10 Model Everything
  • 35.
  • 36.
    Cath Lab 10:Siemens Biplane Pediatric Cath Lab Project Area: 1060 Gross Square Feet Construction Start: 2010 Procedure Room: 717 Net Square Feet BIM Use: Model Everything
  • 37.
    3D Scan (E)Model (N) Model Construction
  • 38.
    3D Scan (E)Model (N) Model Construction
  • 39.
    3D Scan (E)Model (N) Model Construction
  • 40.
    3D Scan (E)Model (N) Model Construction
  • 41.
    Cath Labs 7,9, 10 41 Results
  • 42.
    Results 42 BIM Use %from CAD Cath Lab 7 CAD Cath Lab 9 2” Standard -15.0% Cath Lab 10 Everything -4.1% Construction Cost Change Order Cost *All figures in 2010 Relative Value BIM Use % of Total Cath Lab 7 CAD 12.4% Cath Lab 9 2” Standard 8.1% Cath Lab 10 Everything <0.1% *All figures in 2010 Relative Value
  • 43.
    Results 43 BIM Use ConstructionDays/SF % from CAD Cath Lab 7 CAD 8.40 mo 0.23 D/SF Cath Lab 9 2” Standard 8.50 mo 0.15 D/SF -34.8% Cath Lab 10 Everything 8.45 mo 0.16 D/SF -30.4% Construction Schedule All Costs* * All costs normalized to 2010 dollars ** All design professional fees, including non-BIM fees *** Cath lab contribution margin of ~$8,000 per day Survey All Services** Construction $ Margin*** Total Cath Lab 7 18.5% 18.5% Cath Lab 9 1.6% 27.3% (15.0%) (48.5%) (35.4%) Cath Lab 10 1.6% 18.5% (4.1%) (54.7%) (34.6%)
  • 44.
    Conclusion Save up to23% on project costs Complete project 35% faster Drop change order rate to <0.1% 44% fewer RFIs
  • 45.
    That Went Well 45 NextProject 6% CO Rate Not everything was resolved in the model Some of the same team members Standard Work is Needed
  • 46.
  • 47.
    Ensuring proper equipmentaccess through BIM
  • 48.
    48 • Fire /Smoke Dampers • Domestic Water valves • Heating / Cooling Water Valves • Medical gas valves and pressure sensors • Supply, Exhaust and Return Air Valves • Fan Coil Units • Small Supply and Exhaust Fans • Duct Humidifiers • Re-Heat Coils • Cable Tray • Low Voltage controls such as BMS, lighting, etc. Typical above ceiling MEP access
  • 49.
    49 The goal isto minimize or eliminate disruptions to patient care caused by maintenance activities. • Whenever possible place serviceable items in “off-stage” areas like staff working areas, utility rooms and corridors that are not normally used for patients and visitors. • Avoid placing items above ceilings in areas used for public circulation.
  • 50.
    50 Ceiling Access throughan Infection Control Cube Containment cubes are typically just slightly larger than the 2’ X 4’ ceiling tile opening. An opened 8’ ladder barely fits within the cube.
  • 51.
    51 Plastic “Zip Wall”Containment: If you can’t use a portable containment cube the next option is to build a temporary plastic wall. A valve at or above 16 feet high will require a 14 foot ladder for safe access 14 Foot ladder base is over 100” wide
  • 52.
    52 1st Floor @18’ 2nd Floor @ 20’ Patient Floors @ 16’ Ground Floor @ 18’ The New Stanford Hospital’s deck to deck heights range from 16’ to 20’. This makes it easy to place MEP equipment out of reach even if there is nothing blocking it’s access.
  • 53.
    53 MEP Access ZoneGuidelines These guidelines are intended to be used during finite coordination to reduce possible remodeling and re-coordination efforts needed to maintain maintenance access to above ceiling MEP equipment. Fire / Smoke Damper access: • Accessible from the corridor side. • Place over break rooms, conference rooms, mechanical and electrical rooms. Valves: • Do not install more than 12 feet above the floor. • Locate valves in corridors, storerooms, utility rooms, etc. • Never place over nurse’s stations or within patient rooms. • Do Not locate valves above any patient care room door. Do not place MEP serviceable items above fixed equipment, shelving or casework. How Stanford is addressing access issues during modeling:
  • 54.
    54 MEP Access ZoneGuidelines continued . . . . . Supply, Exhaust and Return Air valves: • Provide access directly below actuators. • When actuator is on top of unit, place access adjacent to the air valves. Fan Coil Units, Supply and Exhaust Fans: • Align ceiling grid, light fixtures, sprinkler heads, etc. with bottom access units to insure access doors open fully. • In hard lid ceilings insure access hatches are located on the service side of the equipment. Other above ceiling MEP considerations: • BMS and Lighting Control boxes require front access. • Medical gas valves and pressure sensors placed below 12’ above the floor. • Re-Heat coil access to control valves and duct access hatch. • Consider sharing Cable Tray access zones with other MEP access zones.
  • 55.
    55 “Sufficient access isdetermined not only by above ceiling clearances but by the ability to use a containment cube and an appropriate sized ladder placed below the ceiling.” Reviewing the model for access issues:
  • 56.
    56 Access Zones shouldbe modeled to the floor and clashed with (known) fixed equipment, shelving and casework. Modeling Access Zones:
  • 57.
    57 • Route thecable tray over the duct or use J-hooks to get over the duct. • Whenever possible place cable tray 18” – 24” from the wall to share access zones. Resolve all access clashes: (or they’ll need to be resolved in the field)
  • 58.
    58 • Model reviewcompleted after 1st pass Finite Coordination • Discrepancies logged and shared with the Design Team • Changes made and closed out during 2nd pass Finite Coordination Model Reviews and Issues Log:
  • 59.
    59 Taking the modelto the field to support construction: BIManywhere Pro iPad App shown here Using the model in the field is critical to insuring that the fully coordinated model becomes a fully coordinated building. Stanford will be using the model to it’s fullest potential.
  • 60.
    60 For future projects: 1.Make it a requirement to model access zones from the equipment to the floor below and clash with fixed equipment and furniture. 2. Add the “MEP Access Zones Guidelines” to the BIM Management Plan. 3. Insist on getting experienced Facilities Maintenance staff involved. They are your best resource for identifying true access issues. 4. Keep it reasonable. Access to MEP equipment above ceilings has to be provided but it doesn’t always have to be easy access.
  • 61.
    BiM for FacilitiesManagement i=information without information its only a building model April 2014
  • 62.
    Model is completeand building is close to activation? What Now ?  Facilities Services & Planning currently maintains  1.2 million square feet onsite  1 million square feet offsite  Staff of 60 building engineers and facility managers with avg of 150 work orders/day  New Hospital adds 820,000 SF of high demand clinical space consisting patient rooms, level 1 trauma,ED, surgical, diagnostic and treatment rooms.  Maintenance of the facility must be 24/7 with no equipment failures or down time
  • 63.
    Current FM Practices 63 •Cost and time needed to develop input for CMMS (normally around $1- $3per gross SF, takes significant time after startup • Cost and time needed to refer to paper files when FM problems occur • Poorer building and equipment performance (lack of adequate data for preventive maintenance)
  • 64.
  • 65.
    BIM is abetter tool in reducing time to complete a work order 65 Service Scenario Assignment Facilities Engineer is assigned to service HVAC Building with 70 VAV, 8 pumps, 14 fan motors & 2 centrifugal pumps Equaling = 18 tickets per day per trade
  • 66.
  • 67.
  • 68.
  • 69.
    Potential Cost Savingsjust for service on VAVs,pumps and motors 69 Note: Cost Savings per year in service to VAVs, pumps and motors related to HVAC system
  • 70.
  • 71.
    Integrated Project Deliveryensure’s delivery of BIM for FM upfront
  • 72.
    Construction Operations BuildingInformation Exchange 72 What is COBie? • A standard method of exchanging information that drives down cost
  • 73.
  • 74.
  • 75.
    The Plan andcurrent Deliverables 75 Stanford Hospital & Clinics is in the research and discovery Phase 1. Toured several hospital on the east coast and locally and observed:  Technology is NEW and not fully developed in facilities management  Lack of data in the model  Lack of training in facilities maintenance staff Goals for FY15 Define Use Cases and Specifications • In 3D model: Simple access to O&M manuals, Warranties, product data and replacement value • In 3D model: Metadata for all objects ie fire rating, floor type, • In 2D drawings: MEP and med gas system flow diagrams with shut off valves and Single lines • Integrated with employee name, dept. & machine • an ‘energy’ model and ability to compare actual energy use to baseline design energy use Actions • Form BIM for FM execution team • Conduct pilot project and implement use cases in production with staff • Define BIM gaps in current BIM model and establish BIM deliverables from construction team Estimate costs to maintain BIM system • For TI/remodels: update models, drawings, equip. metadata • Internal staffing and related vendor costs ( BIM Department)
  • 76.
  • 77.
    Vision: BIM forFM with complete integration with CMMS/BAS/Asset Management/Space Management 77