Download to read offline
![International Journal of Innovative Research in Information Security (IJIRIS) ISSN: 2349-7017(O)
Volume 1 Issue 3 (September 2014) ISSN: 2349-7009(P)
www.ijiris.com
_________________________________________________________________________________________________
© 2014, IJIRIS- All Rights Reserved Page - 17
Big Data: Review, Classification and Analysis
Survey
K.Arun Dr.L.Jabasheela
Department of Computer Applications, Department of Computer Applications,
Jeppiaar Engineering College, Panimalar Engineering College,
Chennai, India. Chennai, India.
Abstract— World Wide Web plays an important role in providing various knowledge sources to the world, which helps
many applications to provide quality service to the consumers. As the years go on the web is overloaded with lot of
information and it becomes very hard to extract the relevant information from the web. This gives way to the evolution
of the Big Data and the volume of the data keeps increasing rapidly day by day. Data mining techniques are used to
find the hidden information from the big data. In this paper we focus on the review of Big Data, its data classification
methods and the way it can be mined using various mining methods.
Keywords-Big Data,Data Mining,Data Classificaion,Mining Techniques
I. INTRODUCTION
The concept of big data has been endemic within computer science since the earliest days of computing. “Big Data”
originally meant the volume of data that could not be processed by traditional database methods and tools. Each time a
new storage medium was invented, the amount of data aaccessible exploded because it could be easily accessed. The
original definition focused on structured data, but most researchers and practitioners have come to realize that most of the
world’s information resides in massive, unstructured information, largely in the form of text and imagery. The explosion
of data has not been accompanied by a corresponding new storage medium. The structure of this paper is as follows:
Section 2 is about Big Data, Section 3 Big Data Characteristics, Section 4 Architecture and Classification, Sections 5, 6,
and 7 discuss on Big Data Analytics, Open Source Revolution, and Mining Techniques for Big Data, and finally Section
8 concludes the paper.
II. BIG DATA
Big Data is a new term assigned to the datasets which appear large in size; we cannot manage them with the traditional
data mining techniques and software tools available. “Big Data “appears as a concrete large size dataset which hides any
information in its massive volume, which cannot be explored without using new algorithms or data mining techniques.
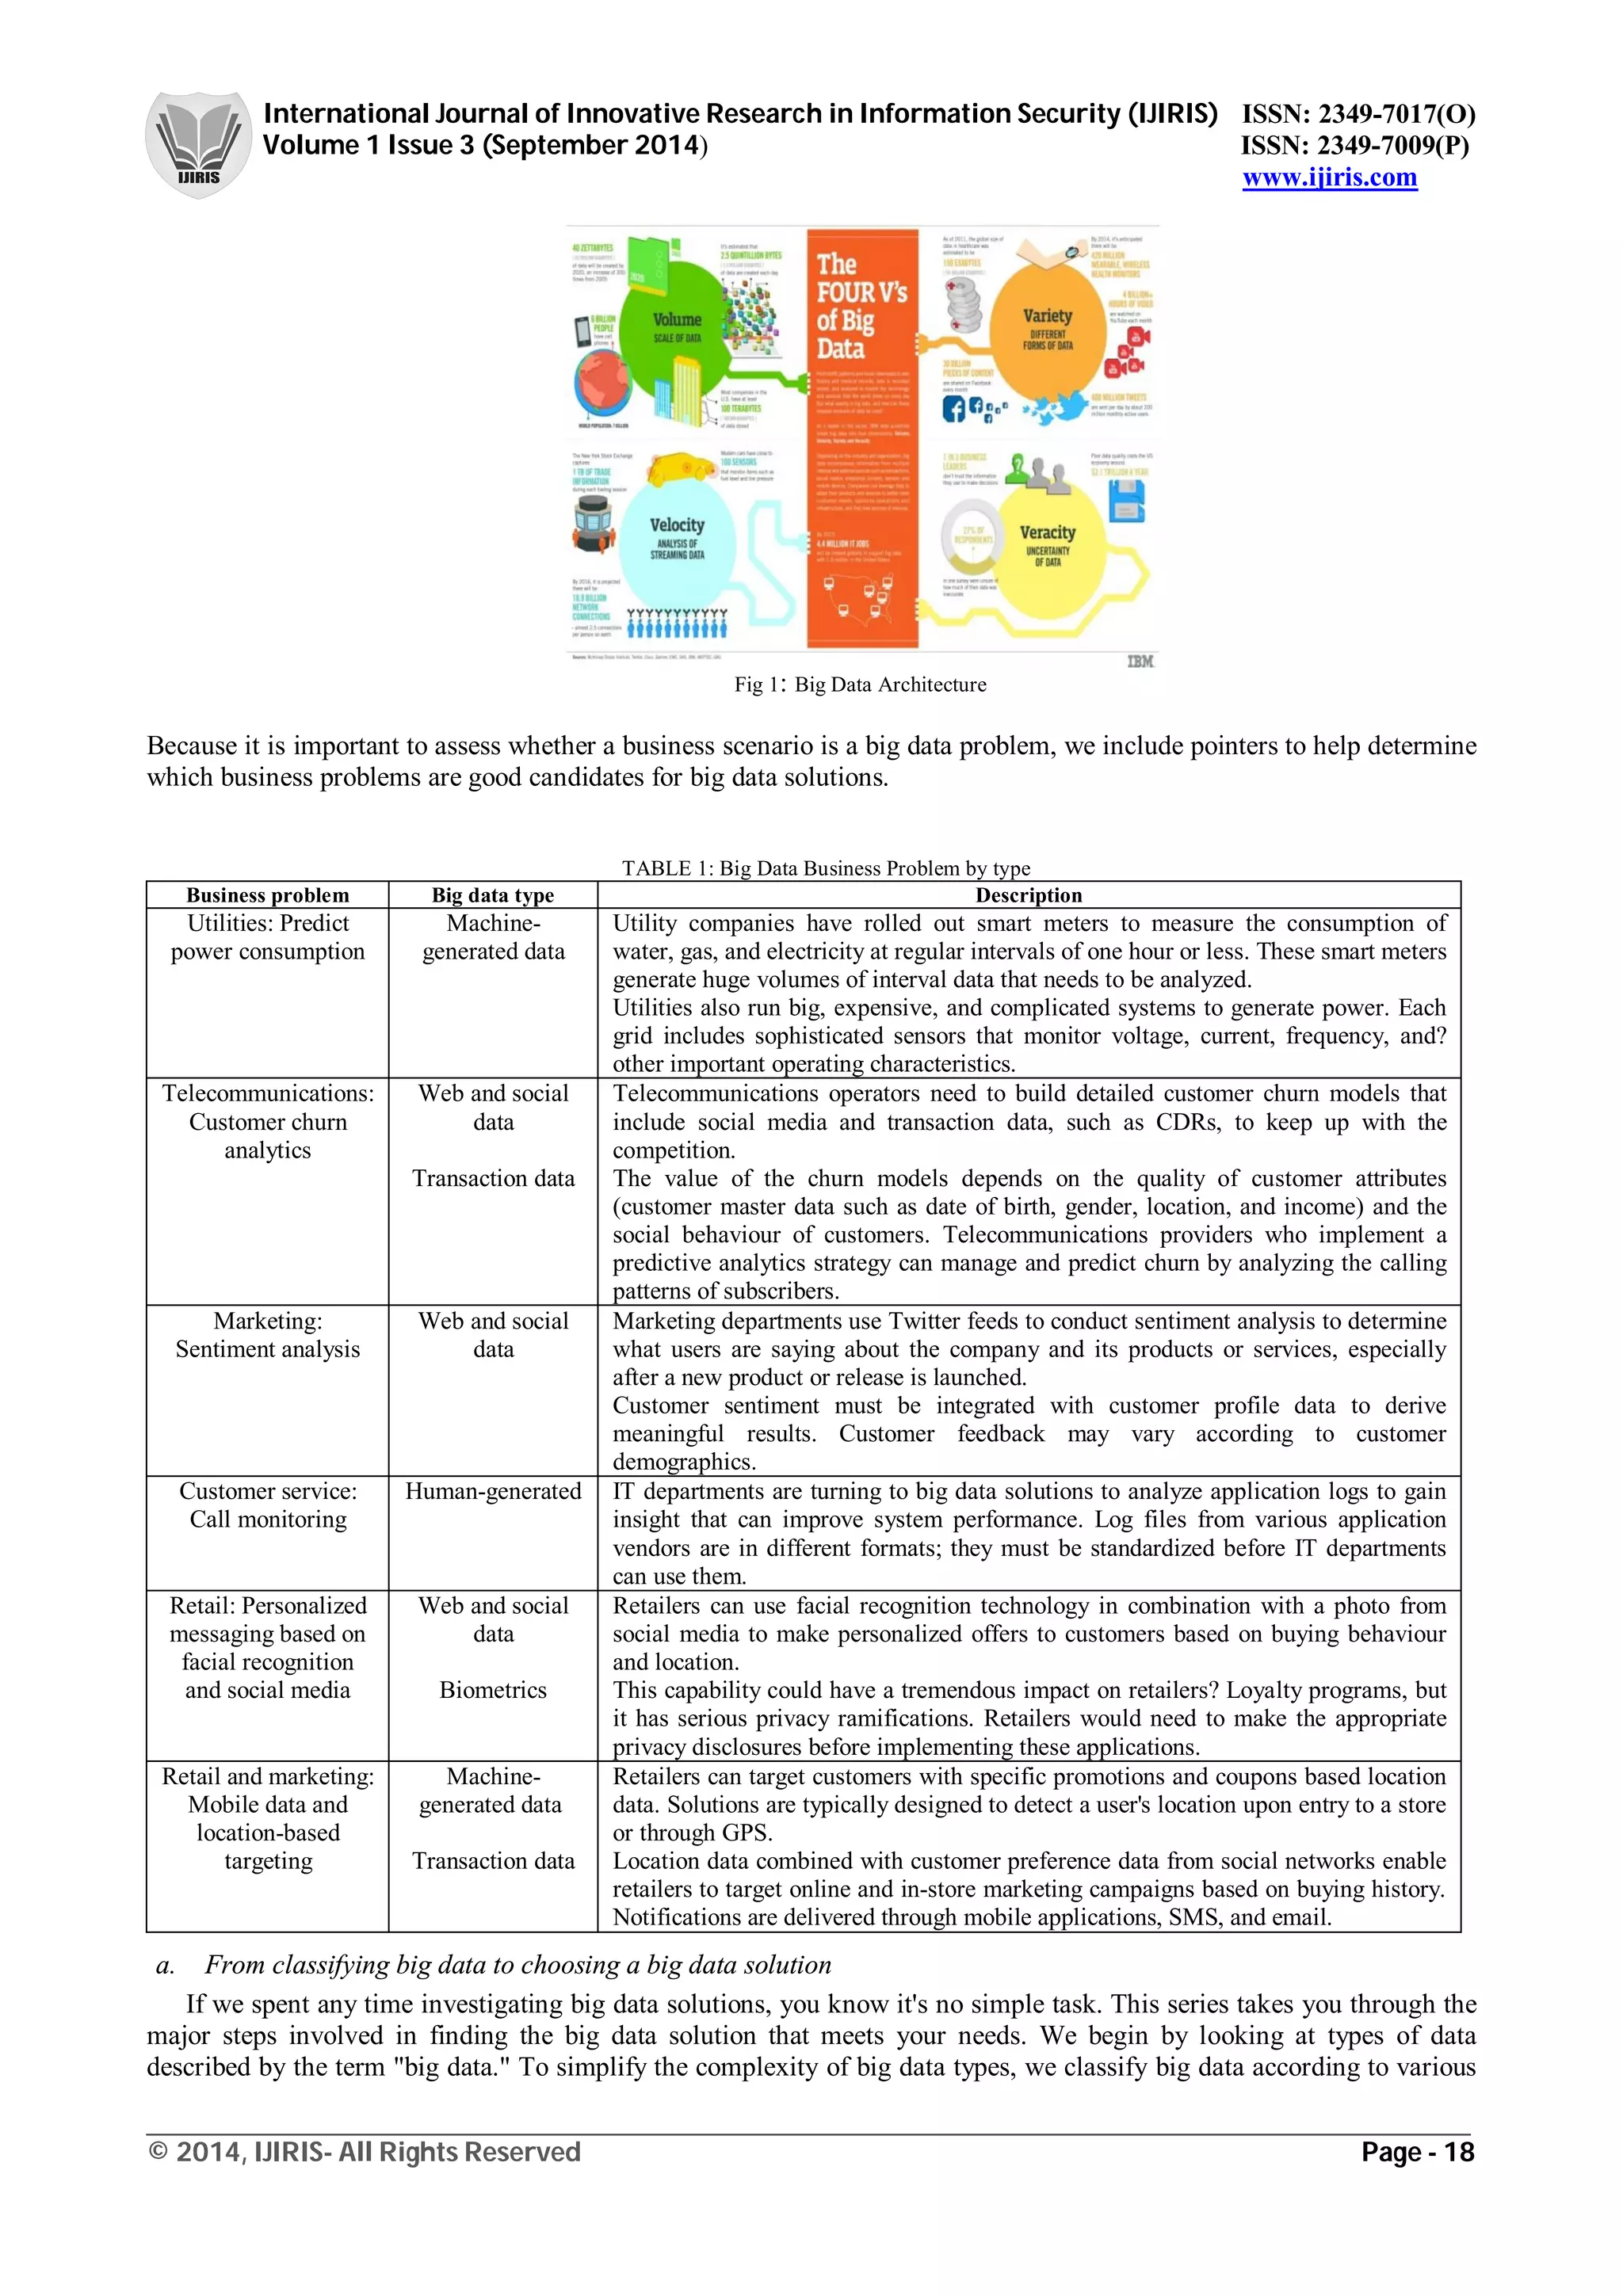
III. BIG DATA CHARACTERISTICS
We have all heard of the 3Vs of big data which are Volume, Variety and Velocity, yet other Vs that IT, business and
data scientists need to be concerned with, most notably big data Veracity.
Data Volume: Data volume measures the amount of data available to an organization, which does not
necessarily have to own all of it as long as it can access it. As data volume increases, the value of different data
records will decrease in proportion to age, type, richness, and quantity among other factors.
Data Variety: Data variety is a measure of the richness of the data representation – text, images video, audio,
etc. From an analytic perspective, it is probably the biggest obstacle to effectively using large volumes of data.
Incompatible data formats, non-aligned data structures, and inconsistent data semantics represents significant
challenges that can lead to analytic sprawl.
Data Velocity: Data velocity measures the speed of data creation, streaming, and aggregation. Ecommerce has
rapidly increased the speed and richness of data used for different business transactions (for example, web-site
clicks). Data velocity management is much more than a bandwidth issue; it is also an ingest issue.
Data Veracity: Data veracity refers to the biases, noise and abnormality in data. Is the data that is being stored,
and mined meaningful to the problem being analyzed. Veracity in data analysis is the biggest challenge when
compares to things like volume and velocity.
IV. BIG DATA ARCHITECTURE AND CLASSIFICATION
This "Big data architecture and patterns" series presents a structured and pattern-based approach to simplify the task
of defining an overall big data architecture [8].](https://image.slidesharecdn.com/issp1008704-160710143338/75/Big-Data-Review-Classification-and-Analysis-Survey-1-2048.jpg)
![International Journal of Innovative Research in Information Security (IJIRIS) ISSN: 2349-7017(O)
Volume 1 Issue 3 (September 2014) ISSN: 2349-7009(P)
www.ijiris.com
_________________________________________________________________________________________________
© 2014, IJIRIS- All Rights Reserved Page - 21
public health and safety. Proposed projects included one that showed how to improve public safety by tracking cell phone
data to map where people went after emergencies; another showed how to use cellular data for disease containment.
VI. TOOLS : OPEN SOURCE REVOLUTION
Apache Hadoop [3]: software for data-intensive distributed applications, based in the MapReduce programming model
and a distributed file system called Hadoop Distributed Filesystem (HDFS). Hadoop allows writing applications that
rapidly process large amounts of data in parallel on large clusters of compute nodes. A MapReduce job divides the input
dataset into independent subsets that are processed by map tasks in parallel. This step of mapping is then followed by a
step of reducing tasks. These reduce tasks use the output of the maps to obtain the final result of the job.
Apache Pig [6]: software for analyzing large data sets that consists of a high-level language similar to SQL for expressing
data analysis programs, coupled with infrastructure for evaluating these rograms. It contains a compiler that produces
sequences of Map- Reduce programs.
Cascading [10]: software abstraction layer for Hadoop, intended to hide the underlying complexity of MapReduce jobs.
Cascading allows users to create and execute data processing workflows on Hadoop clusters using any JVM-based
language.
Scribe [11]: server software developed by Facebook and released in 2008. It is intended for aggregating log data
streamed in real time from a large number of servers.
Apache HBase [4]: non-relational columnar distributed database designed to run on top of Hadoop Distributed
Filesystem (HDFS). It is written in Java and modeled after Google’s BigTable. HBase is an example if a NoSQL data
store.
Apache Cassandra [2]: another open source distributed database management system developed by Facebook. Cassandra
is used by Netflix, which uses Cassandra as the back-end database for its streaming services.
Apache S4 [15]: platform for processing continuous data streams. S4 is designed specifically for managing data streams.
S4 apps are designed combining streams and processing elements in real time.
In Big Data Mining, there are many open source initiatives. The most popular are the following:
– Apache Mahout [5]: Scalable machine learning and data mining open source software based mainly in Hadoop. It has
implementations of a wide range of machine learning and data mining algorithms: clustering, classification, collaborative
filtering and frequent pattern mining.
MOA [9]: Stream data mining open source software to perform data mining in real time. It has implementations of
classification, regression, clustering and frequent item set mining and frequent graph mining. It started as a project of the
Machine Learning group of University of Waikato, New Zealand, famous for the WEKA software. The streams
framework [12] provides an environment for defining and running stream processes using simple XML based definitions
and is able to use MOA.
– R [16]: open source programming language and software environment designed for statistical computing and
visualization. R was designed by Ross Ihaka and Robert Gentleman at the University of Auckland, New Zealand
beginning in 1993 and is used for statistical analysis of very large data sets.
Vowpal Wabbit [13]: open source project started at Yahoo! Research and continuing at Microsoft Research to design a
fast, scalable, useful learning algorithm. VW is able to learn from terafeature datasets. It can exceed the throughput of
any single machine network interface when doing linear learning, via parallel learning.
– PEGASUS [12]: big graph mining system built on top of MAPREDUCE. It allows to find patterns and anomalies in
massive real-world graphs.
– GraphLab [14]: high-level graph-parallel system built without using MAPREDUCE. GraphLab computes over
dependent records which are stored as vertices in a large distributed data-graph. Algorithms in GraphLab are expressed as
vertex-programs which are executed in parallel on each vertex and can interact with neighboring vertices.
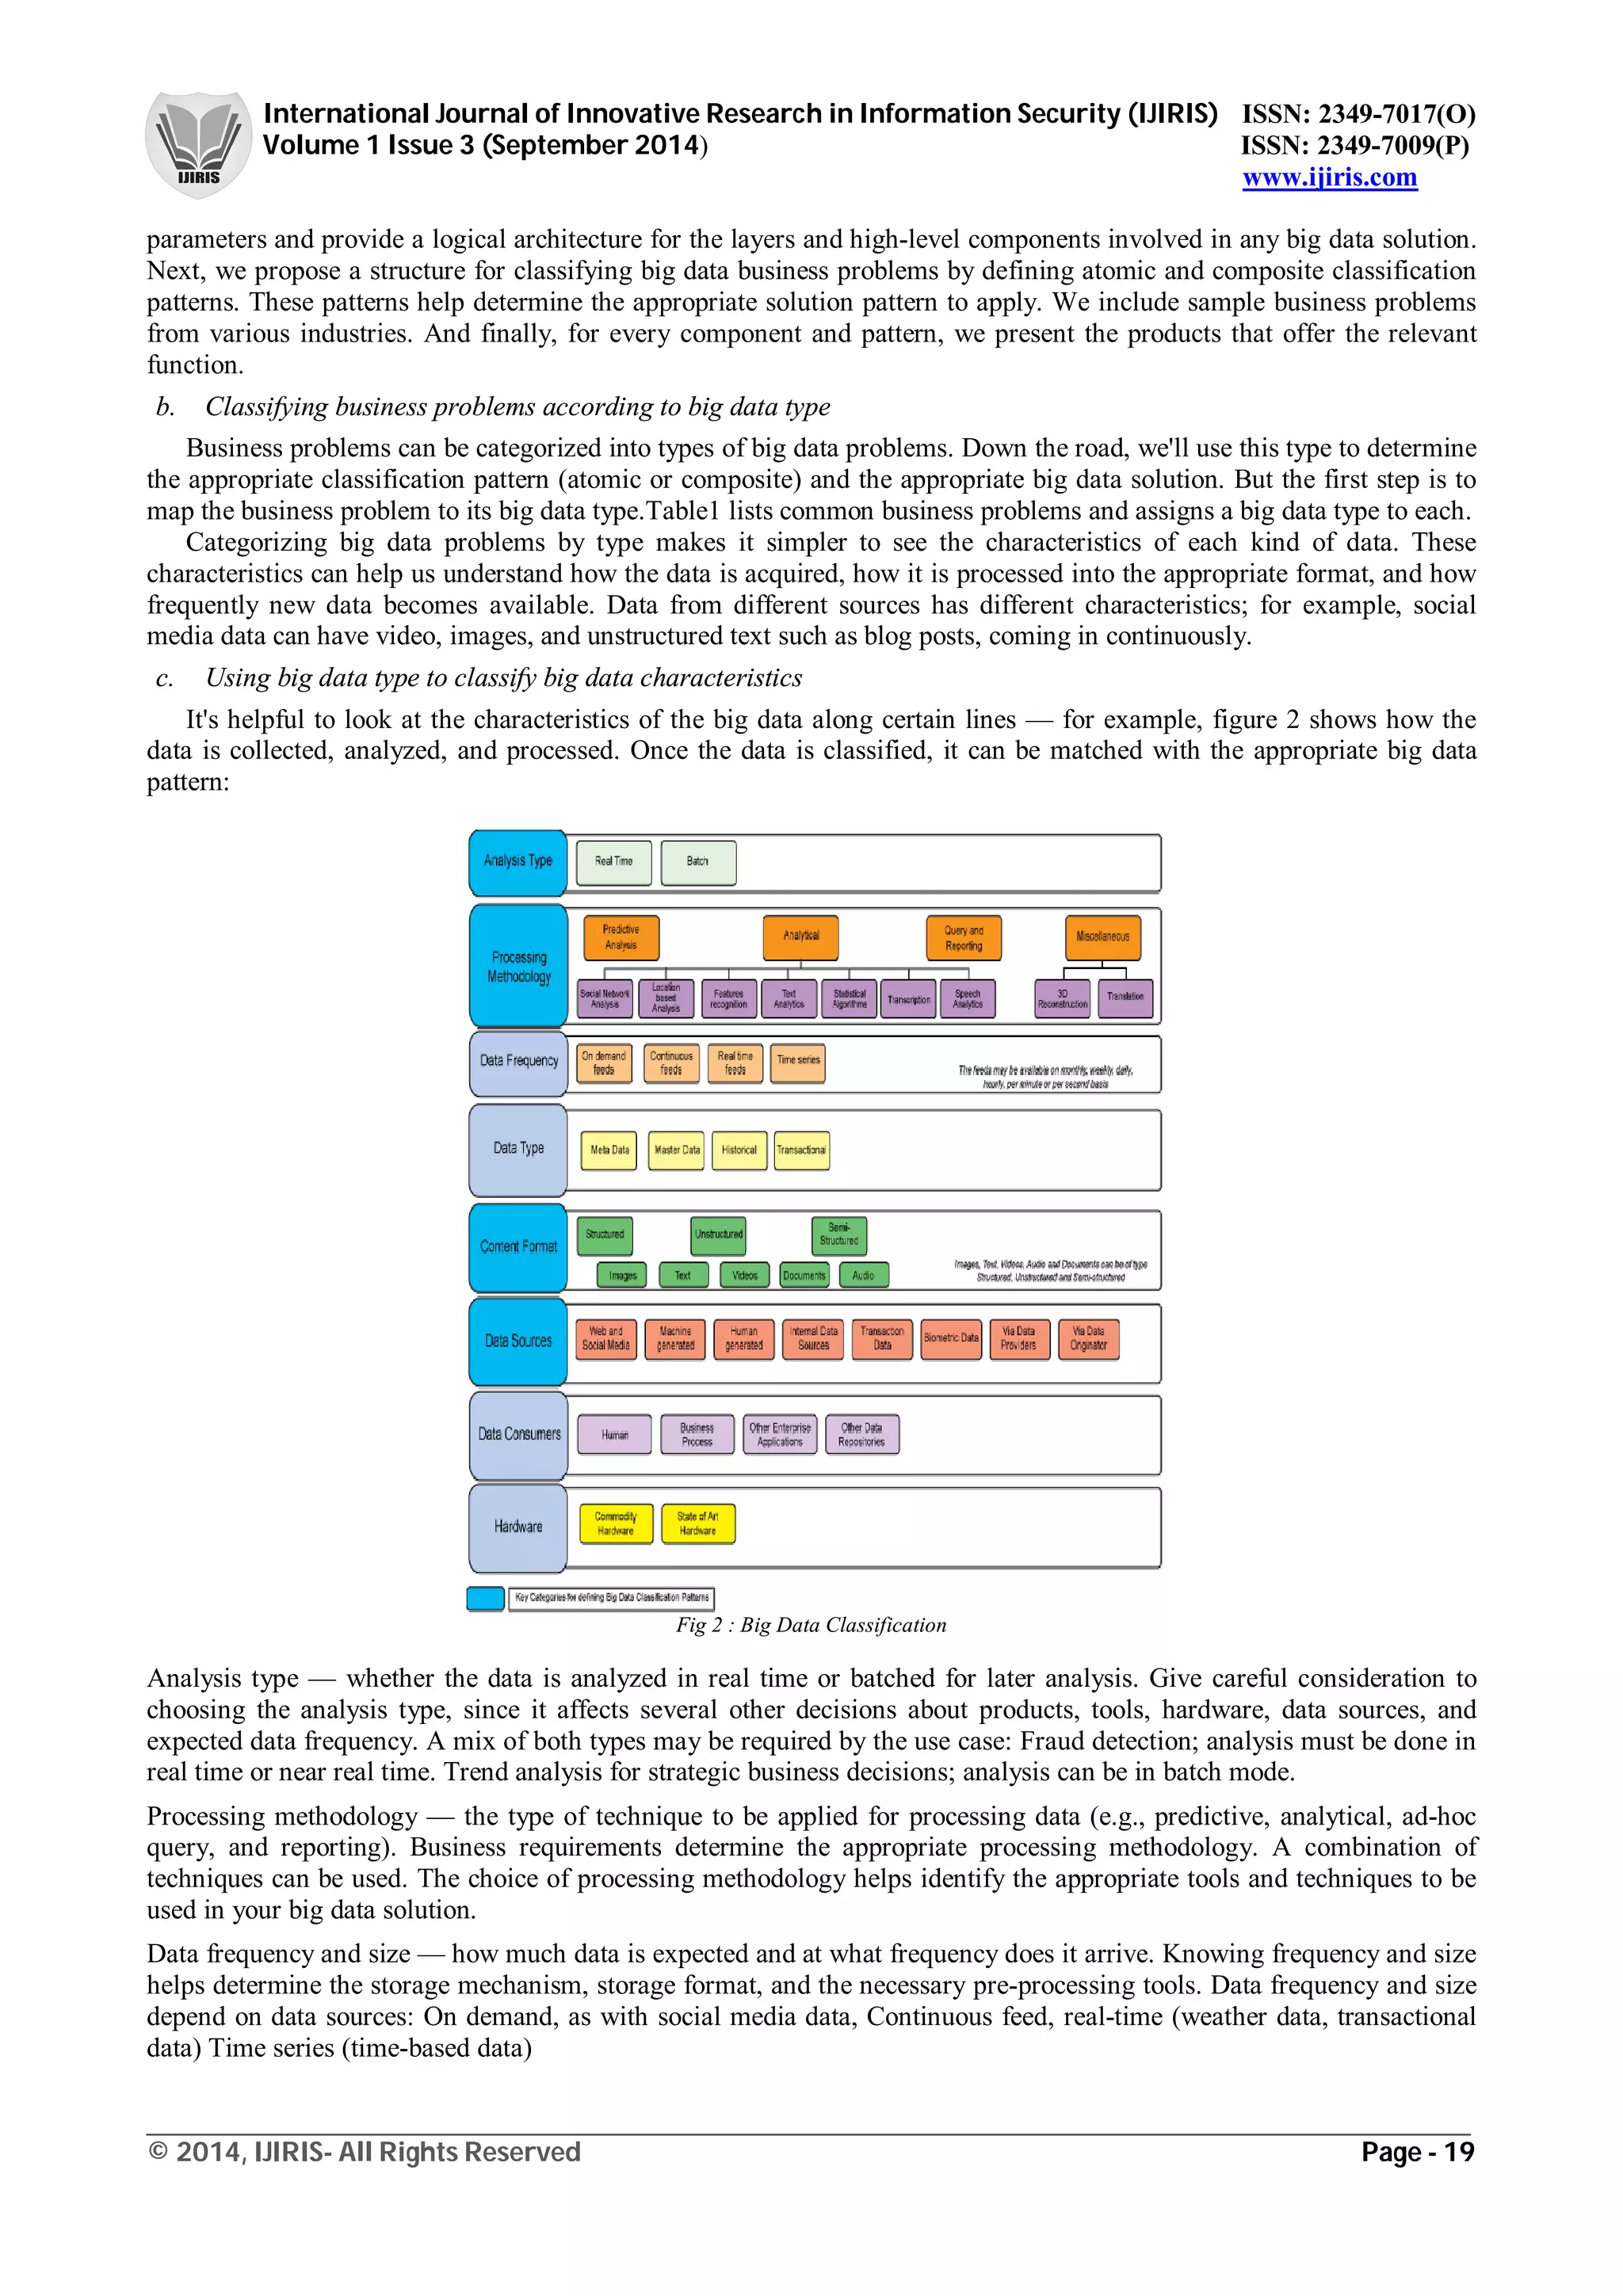
VII. MINING TECHINQUES FOR BIG DATA
There are many different types of analysis that can be done in order to retrieve information from big data. Each type of
analysis will have a different impact or result. Which type of data mining technique you should use really depends on the
type of business problem that you are trying to solve. Different analyses will deliver different outcomes and thus provide](https://image.slidesharecdn.com/issp1008704-160710143338/75/Big-Data-Review-Classification-and-Analysis-Survey-5-2048.jpg)
![International Journal of Innovative Research in Information Security (IJIRIS) ISSN: 2349-7017(O)
Volume 1 Issue 3 (September 2014) ISSN: 2349-7009(P)
www.ijiris.com
_________________________________________________________________________________________________
© 2014, IJIRIS- All Rights Reserved Page - 23
can help you find the love of your live on an online dating website. The website eHarmony uses a regression model that
matches two individual singles based on 29 variables to find the best partner.
Data mining can help organisations and scientists to find and select the most important and relevant information. This
information can be used to create models that can help make predictions how people or systems will behave so you can
anticipate on it. The more data you have the better the models will become that you can create using the data mining
techniques, resulting in more business value for your organisation.
VIII. CONCLUSION
This paper describes about the advent of Big Data, Architecture and Characteristics. Here we discussed about the
classifications of Big Data to the business needs and how for it will help us in decision making in the business
environment. Our future work focuses on the analysis part of the big data classification by implementing a different data
mining techniques in it.
REFERENCE
[1] http://www.pro.techtarget.com
[2] Apache Cassandra, http://cassandra. apache.org.
[3] Apache Hadoop, http://hadoop.apache.org.
[4] Apache HBase, http://hbase.apache.org.
[5] Apache Mahout, http://mahout.apache.org.
[6] Apache Pig, http://www.pig.apache.org/.
[7] http://www.webopedia.com/
[8] http://www.ibm.com/library/
[9] A. Bifet, G. Holmes, R. Kirkby, and B. Pfahringer.MOA: Massive Online Analysis http://moa.cms.waikato.ac.nz/.
Journal of Machine Learning Research (JMLR), 2010.
[10] Cascading, http://www.cascading.org/.
[11] Facebook Scribe, https://github.com/ facebook/scribe.
[12] U. Kang, D. H. Chau, and C. Faloutsos. PEGASUS:Mining Billion-Scale Graphs in the Cloud. 2012.
[13] J. Langford. Vowpal Wabbit, http://hunch.net/˜vw/,2011.
[14] Y. Low, J. Gonzalez, A. Kyrola, D. Bickson,C. Guestrin, and J. M. Hellerstein. Graphlab: A new parallel framework
for machine learning. In Conference on Uncertainty in Artificial Intelligence (UAI), Catalina Island, California, July
2010.
[15] L. Neumeyer, B. Robbins, A. Nair, and A. Kesari. S4:Distributed Stream Computing Platform. In ICDM
Workshops, pages 170–177, 2010.
[16] R Core Team. R: A Language and Environment for Statistical Computing. R Foundation for Statistical Computing,
Vienna, Austria, 2012. ISBN 3-900051-07-0.](https://image.slidesharecdn.com/issp1008704-160710143338/75/Big-Data-Review-Classification-and-Analysis-Survey-7-2048.jpg)

The document reviews big data, its classification, and mining techniques, highlighting the challenges and characteristics of handling large datasets. It emphasizes the necessity for advanced analytics and the evolution of data management techniques to handle unstructured and structured data effectively. The paper also discusses various applications of big data analytics across different sectors, showcasing its potential to improve operational efficiency and drive business decisions.


![[DSC Europe 25] Dusan Jovicic - AI Story: From on-prem to cloud and back agai...](https://cdn.slidesharecdn.com/ss_thumbnails/8kp49m6uq22ifnbwhfnk-2-251205085715-964d11a6-thumbnail.jpg?width=640&height=640&fit=bounds)

![[DSC Europe 25] Dragan Vucic - Building the Learning Organization - How AI Tr...](https://cdn.slidesharecdn.com/ss_thumbnails/8brigo2sbu6qur6gxrra-7-251205085715-6ae07d24-thumbnail.jpg?width=640&height=640&fit=bounds)
![[DSC Europe 25] Goran Obradovic - The Rise of Sovereign AI: Building the Regi...](https://cdn.slidesharecdn.com/ss_thumbnails/7nw2xxixrxqdxvrb5wca-6-251205085714-ab09a2ac-thumbnail.jpg?width=640&height=640&fit=bounds)

![[DSC Europe 25] Nikola Rajovic - Hardware Technologies Under the Hood: RISC-V...](https://cdn.slidesharecdn.com/ss_thumbnails/o2gptrmtoyqndgoshwgq-dsc2025-tenstorrent-rajovic-251205090438-814685f5-thumbnail.jpg?width=640&height=640&fit=bounds)

![[DSC Europe 25] Bogdan Daniel Maruneac - AI - It starts with you.pptx](https://cdn.slidesharecdn.com/ss_thumbnails/odov3snhrcqs9hx5ny2n-4-251205085715-f1daacfe-thumbnail.jpg?width=640&height=640&fit=bounds)


![[DSC Europe 25] Dragana Ilic - AI for Big Data in Astronomy.pptx](https://cdn.slidesharecdn.com/ss_thumbnails/8palya86qaatvjhva1ms-2-dragana-ilic-ai-ilic-251208151906-652b819c-thumbnail.jpg?width=640&height=640&fit=bounds)


