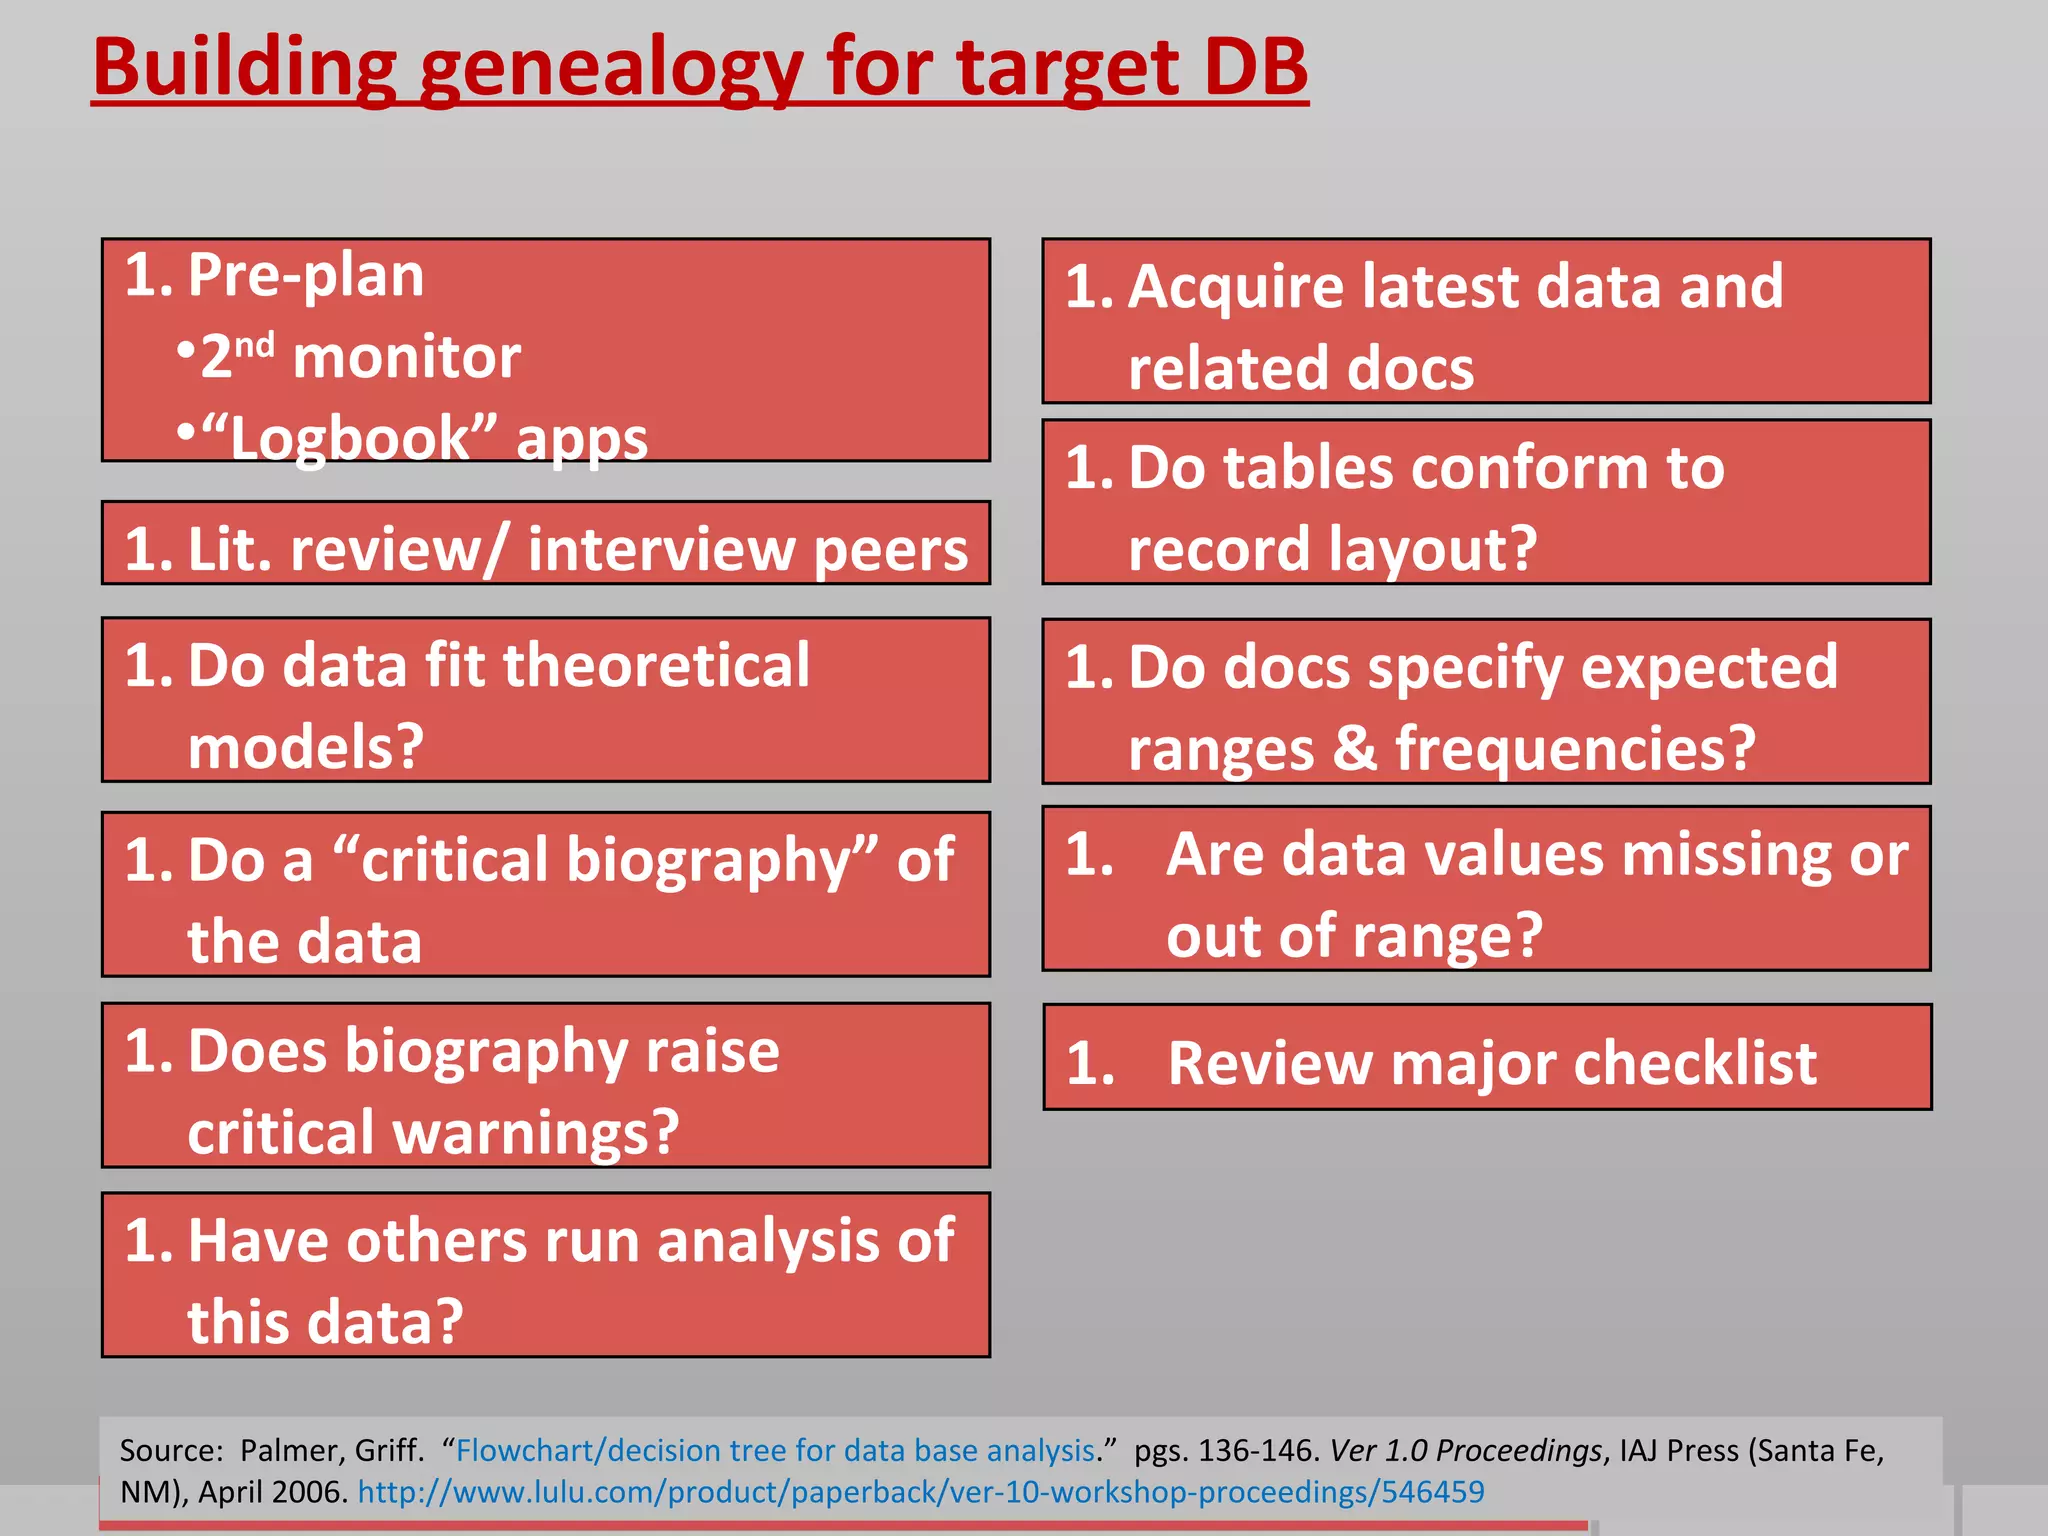
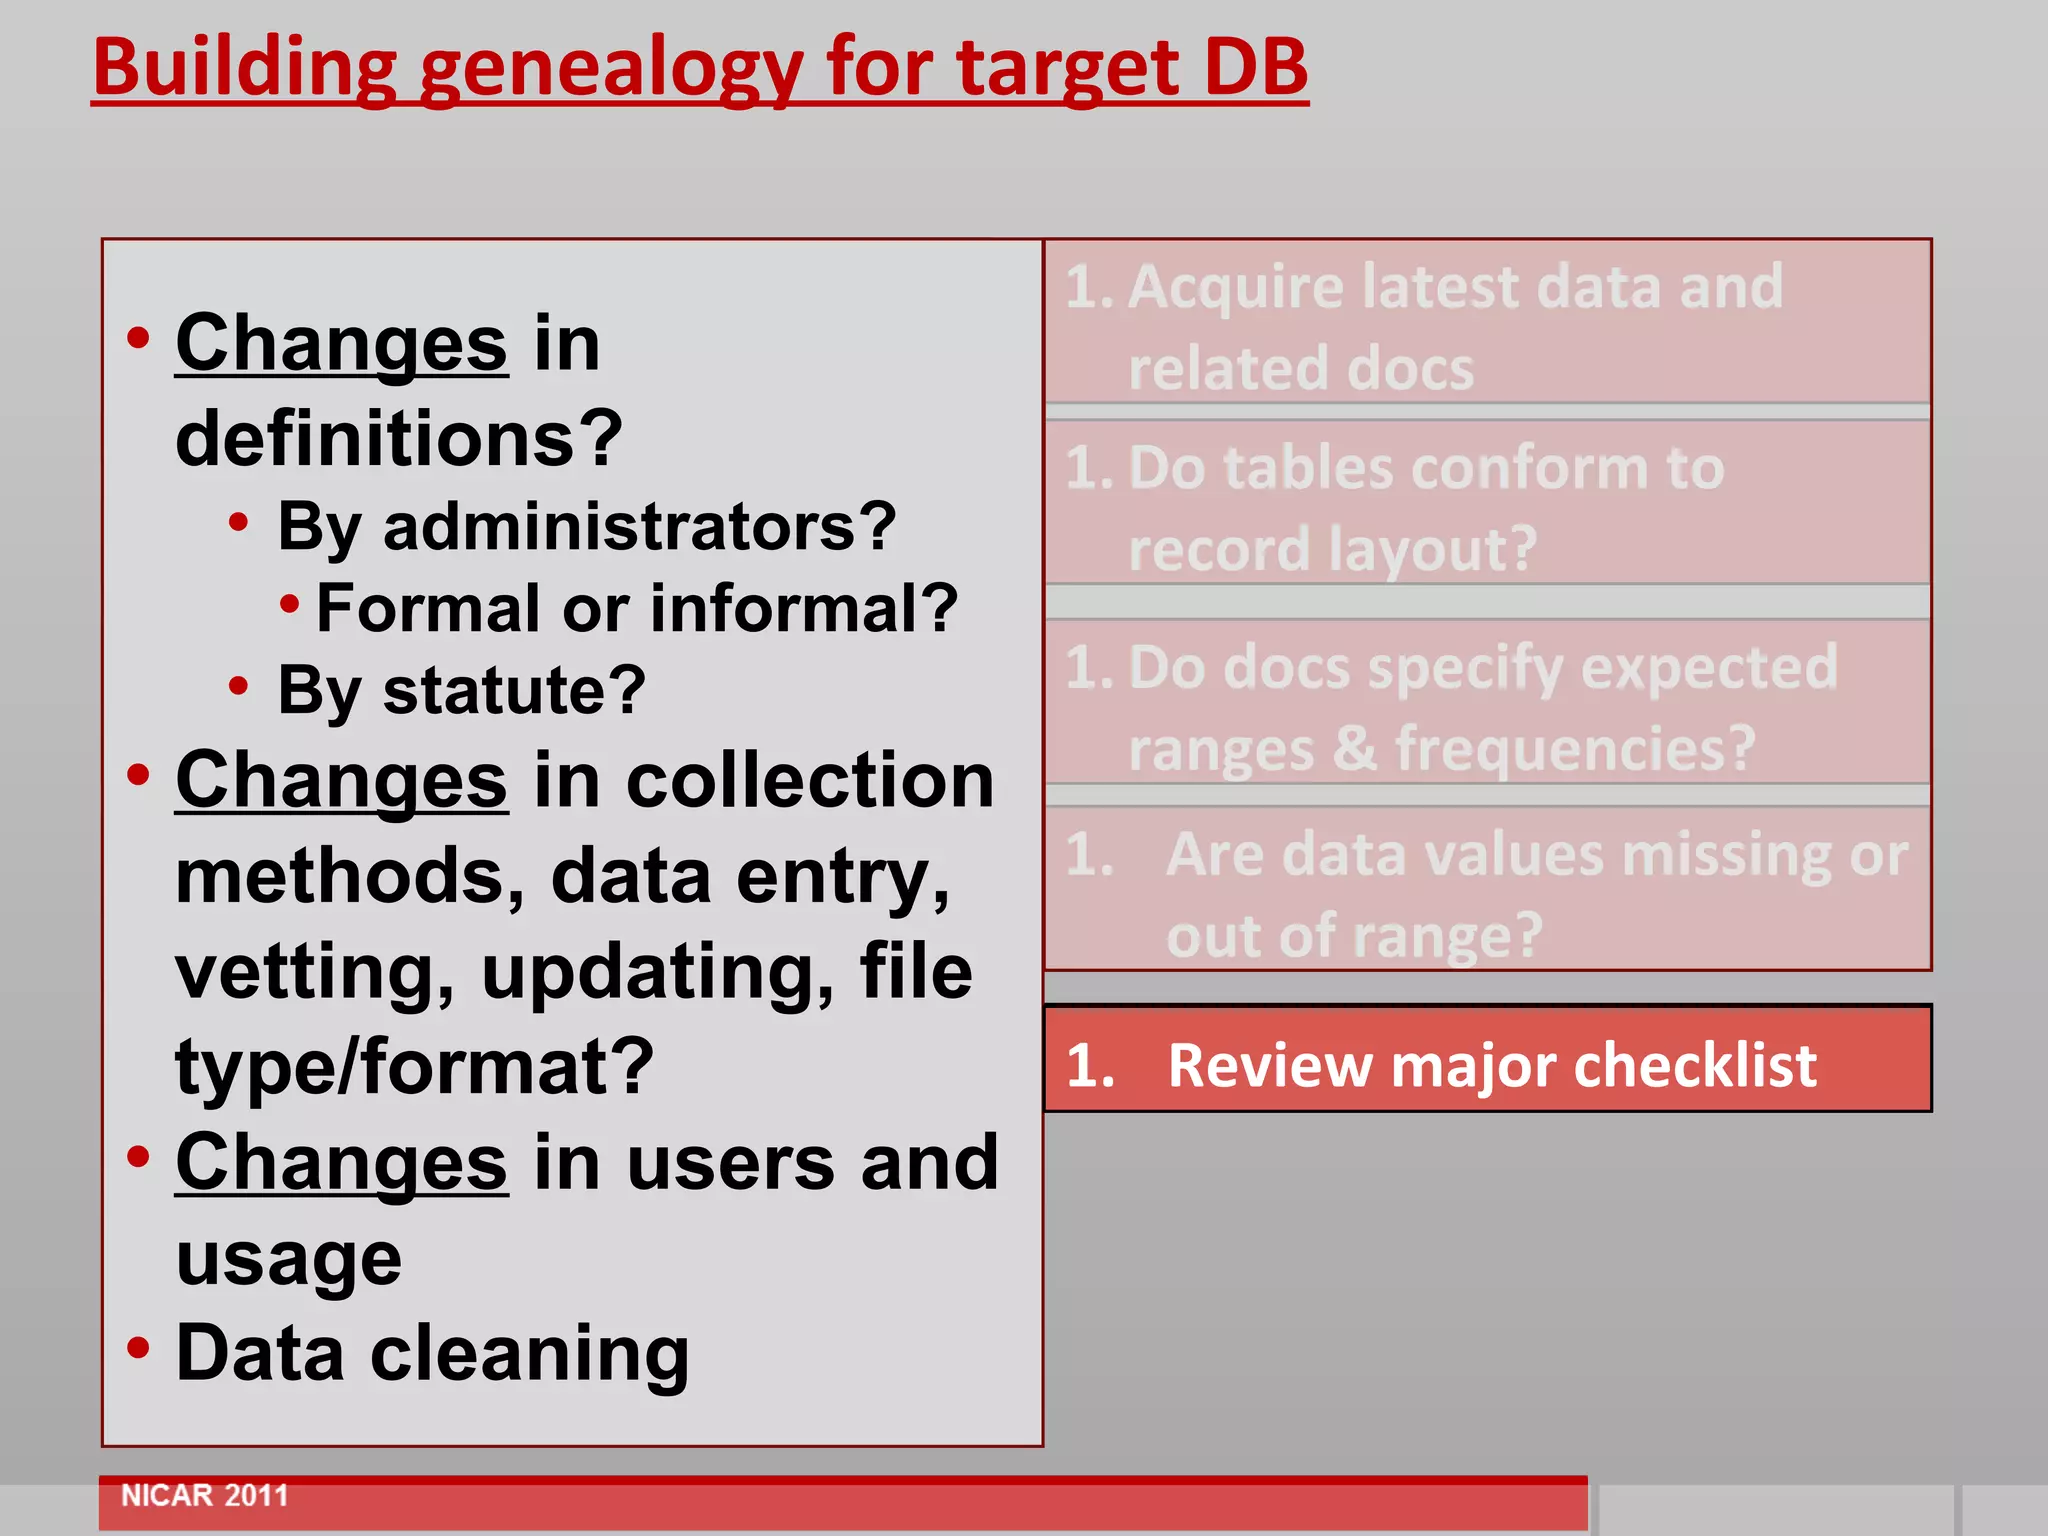
The document discusses the importance of validating data sources and understanding the methodology used to collect and analyze data. It emphasizes that data sets are dynamic and have a history or "genealogy" that is important to understand. Proper data validation includes checking for consistent definitions, completeness of records, precision of values, and outliers. The document provides examples of how invalid data can negatively impact stories and recommendations for journalists to evaluate data quality.
Data science remains a high-touch activity, especially in life, physical, and social sciences. Data management and manipulation tasks consume too much bandwidth: Specialized tools and technologies are difficult to use together, issues of scale persist despite the Cambrian explosion of big data systems, and public data sources (including the scientific literature itself) suffer curation and quality problems.
Together, these problems motivate a research agenda around “human-data interaction:” understanding and optimizing how people use and share quantitative information.
I’ll describe some of our ongoing work in this area at the University of Washington eScience Institute.
In the context of the Myria project, we're building a big data "polystore" system that can hide the idiosyncrasies of specialized systems behind a common interface without sacrificing performance. In scientific data curation, we are automatically correcting metadata errors in public data repositories with cooperative machine learning approaches. In the Viziometrics project, we are mining patterns of visual information in the scientific literature using machine vision, machine learning, and graph analytics. In the VizDeck and Voyager projects, we are developing automatic visualization recommendation techniques. In graph analytics, we are working on parallelizing best-of-breed graph clustering algorithms to handle multi-billion-edge graphs.
The common thread in these projects is the goal of democratizing data science techniques, especially in the sciences.
Data Landscapes: The Neuroscience Information FrameworkMaryann Martone
Overview of how to use the Neuroscience Information Framework for data discovery presented at the Genetics of Addiction Workshop, held at Jackson Lab Aug 28- Sept 1, 2014.
Turning Data into Infographics: An Interactive Workshop for Problem SolversUNCResearchHub
This workshop was given at the UNC Undergraduate Library on October 4, 2016. It steps through the process of finding data sources, exploring data, and ultimately creating a persuasive infographic using that data. A brief introduction to infographics and best practices are included.
SciDataCon 2014 Data Papers and their applications workshop - NPG Scientific ...Susanna-Assunta Sansone
Part of the SciDataCon14 workshop on "Data Papers and their applications" run by myself and Brian Hole to help attendees understand current data-publishing journals and trends and help them understand the editorial processes on NPG's Scientific Data and Ubiquity's Open Health Data.
Data Profiling: The First Step to Big Data QualityPrecisely
Big data offers the promise of a data-driven business model generating new revenue and competitive advantage fueled by new business insights, AI, and machine learning. Yet without high quality data that provides trust, confidence, and understanding, business leaders continue to rely on gut instinct to drive business decisions.
The critical foundation and first step to deliver high quality data in support of a data-driven view that truly leverages the value of big data is data profiling - a proven capability to analyze the actual data content and help you understand what's really there.
View this webinar on-demand to learn five core concepts to effectively apply data profiling to your big data, assess and communicate the quality issues, and take the first step to big data quality and a data-driven business.
Foundational Strategies for Trust in Big Data Part 2: Understanding Your DataPrecisely
Teams working on new initiatives whether for customer engagement, advanced analytics, or regulatory and compliance requirements need a broad range of data sources for the highest quality and most trusted results. Yet the sheer volume of data delivered coupled with the range of data sources including those from external 3rd parties increasingly precludes trust, confidence, and even understanding of the data and how or whether it can be used to make effective data-driven business decisions.
The second part of our webcast series on Foundation Strategies for Trust in Big Data provides insight into how Trillium Discovery for Big Data with its natively distributed execution for data profiling supports a foundation of data quality by enabling business analysts to gain rapid insight into data delivered to the data lake without technical expertise.
Opening/Framing Comments: John Behrens, Vice President, Center for Digital Data, Analytics, & Adaptive Learning Pearson
Discussion of how the field of educational measurement is changing; how long held assumptions may no longer be taken for granted and that new terminology and language are coming into the.
Panel 1: Beyond the Construct: New Forms of Measurement
This panel presents new views of what assessment can be and new species of big data that push our understanding for what can be used in evidentiary arguments.
Marcia Linn, Lydia Liu from UC Berkeley and ETS discuss continuous assessment of science and new kinds of constructs that relate to collaboration and student reasoning.
John Byrnes from SRI International discusses text and other semi-structured data sources and different methods of analysis.
Kristin Dicerbo from Pearson discusses hidden assessments and the different student interactions and events that can be used in inferential processes.
Panel 2: The Test is Just the Beginning: Assessments Meet Systems Context
This panel looks at how assessments are not the end game, but often the first step in larger big-data practices at districts/state/national levels.
Gerald Tindal from the University of Oregon discusses State data systems and special education, including curriculum-based measurement across geographic settings.
Jack Buckley Commissioner of the National Center for Educational Statistics discussing national datasets where tests and other data connect.
Lindsay Page, Will Marinell from the Strategic Data Project at Harvard discussing state and district datasets used for evaluating teachers, colleges of education, and student progress.
Panel 3: Connecting the Dots: Research Agendas to Integrate Different Worlds
This panel will look at how research organizations are viewing the connections between the perspectives presented in Panels 1 and 2; what is known, what is still yet to be discovered in order to achieve the promised of big connected data in education.
Andrea Conklin Bueschel Program Director at the Spencer Foundation
Ed Dieterle Senior Program Officer at the Bill and Melinda Gates Foundation
Edith Gummer Program Manager at National Science Foundation
Data Communities - reusable data in and outside your organization.Paul Groth
Description
Data is a critical both to facilitate an organization and as a product. How can you make that data more usable for both internal and external stakeholders? There are a myriad of recommendations, advice, and strictures about what data providers should do to facilitate data (re)use. It can be overwhelming. Based on recent empirical work (analyzing data reuse proxies at scale, understanding data sensemaking and looking at how researchers search for data), I talk about what practices are a good place to start for helping others to reuse your data. I put this in the context of the notion data communities that organizations can use to help foster the use of data both within your organization and externally.
This handout accompanies slides -- Developing a data mindset to improve stories every day -- taught by Brant Houston at Illinois NewsTrain on April 1, 2022. Houston is the Knight Chair in Investigative Reporting at the University of Illinois, where he oversees an online newsroom, CU-CitizenAccess.org. For more info on the News Leaders Association's NewsTrain, see https://www.newsleaders.org/newstrain.
A presentation prepared for KSFR, a public radio station in Santa Fe, New Mexico, USA. The main point is that the station should develop a "digital first" approach to all aspects pertaining to its Audience(s), Content and Technologies.
Lecture presented at Catedra Walter Lippmann, Universidad del Rosario, Bogota, Colombia, 23 Nov. 2012
See: http://issuu.com/consejo_de_redaccion/docs/ur_-_semana_-_seminario_walter_lippmann_2012_2
Presented at Esri Health GIS ConferenceS
cottsdale, AZ USA
|28 August 2012
Presentation slides at w w w . s l i d e s h a r e . N e t / j t j o h n s o n
Data Makes the Maps; Maps Make the Data by J. T Johnson is licensed under a Creative Commons Attribution-NonCommercial-NoDerivs 3.0 Unported License.
Economic development in New Mexico can be achieved if we integrate the scientific and cultural tools, traditions and resources of the Rio Grande valley.
01062024_First India Newspaper Jaipur.pdfFIRST INDIA
Find Latest India News and Breaking News these days from India on Politics, Business, Entertainment, Technology, Sports, Lifestyle and Coronavirus News in India and the world over that you can't miss. For real time update Visit our social media handle. Read First India NewsPaper in your morning replace. Visit First India.
CLICK:- https://firstindia.co.in/
#First_India_NewsPaper
Future Of Fintech In India | Evolution Of Fintech In IndiaTheUnitedIndian
Navigating the Future of Fintech in India: Insights into how AI, blockchain, and digital payments are driving unprecedented growth in India's fintech industry, redefining financial services and accessibility.
27052024_First India Newspaper Jaipur.pdfFIRST INDIA
Find Latest India News and Breaking News these days from India on Politics, Business, Entertainment, Technology, Sports, Lifestyle and Coronavirus News in India and the world over that you can't miss. For real time update Visit our social media handle. Read First India NewsPaper in your morning replace. Visit First India.
CLICK:- https://firstindia.co.in/
#First_India_NewsPaper
role of women and girls in various terror groupssadiakorobi2
Women have three distinct types of involvement: direct involvement in terrorist acts; enabling of others to commit such acts; and facilitating the disengagement of others from violent or extremist groups.
‘वोटर्स विल मस्ट प्रीवेल’ (मतदाताओं को जीतना होगा) अभियान द्वारा जारी हेल्पलाइन नंबर, 4 जून को सुबह 7 बजे से दोपहर 12 बजे तक मतगणना प्रक्रिया में कहीं भी किसी भी तरह के उल्लंघन की रिपोर्ट करने के लिए खुला रहेगा।
03062024_First India Newspaper Jaipur.pdfFIRST INDIA
Find Latest India News and Breaking News these days from India on Politics, Business, Entertainment, Technology, Sports, Lifestyle and Coronavirus News in India and the world over that you can't miss. For real time update Visit our social media handle. Read First India NewsPaper in your morning replace. Visit First India.
CLICK:- https://firstindia.co.in/
#First_India_NewsPaper
In a May 9, 2024 paper, Juri Opitz from the University of Zurich, along with Shira Wein and Nathan Schneider form Georgetown University, discussed the importance of linguistic expertise in natural language processing (NLP) in an era dominated by large language models (LLMs).
The authors explained that while machine translation (MT) previously relied heavily on linguists, the landscape has shifted. “Linguistics is no longer front and center in the way we build NLP systems,” they said. With the emergence of LLMs, which can generate fluent text without the need for specialized modules to handle grammar or semantic coherence, the need for linguistic expertise in NLP is being questioned.
ys jagan mohan reddy political career, Biography.pdfVoterMood
Yeduguri Sandinti Jagan Mohan Reddy, often referred to as Y.S. Jagan Mohan Reddy, is an Indian politician who currently serves as the Chief Minister of the state of Andhra Pradesh. He was born on December 21, 1972, in Pulivendula, Andhra Pradesh, to Yeduguri Sandinti Rajasekhara Reddy (popularly known as YSR), a former Chief Minister of Andhra Pradesh, and Y.S. Vijayamma.
31052024_First India Newspaper Jaipur.pdfFIRST INDIA
Find Latest India News and Breaking News these days from India on Politics, Business, Entertainment, Technology, Sports, Lifestyle and Coronavirus News in India and the world over that you can't miss. For real time update Visit our social media handle. Read First India NewsPaper in your morning replace. Visit First India.
CLICK:- https://firstindia.co.in/
#First_India_NewsPaper
हम आग्रह करते हैं कि जो भी सत्ता में आए, वह संविधान का पालन करे, उसकी रक्षा करे और उसे बनाए रखे।" प्रस्ताव में कुल तीन प्रमुख हस्तक्षेप और उनके तंत्र भी प्रस्तुत किए गए। पहला हस्तक्षेप स्वतंत्र मीडिया को प्रोत्साहित करके, वास्तविकता पर आधारित काउंटर नैरेटिव का निर्माण करके और सत्तारूढ़ सरकार द्वारा नियोजित मनोवैज्ञानिक हेरफेर की रणनीति का मुकाबला करके लोगों द्वारा निर्धारित कथा को बनाए रखना और उस पर कार्यकरना था।
Welcome to the new Mizzima Weekly !
Mizzima Media Group is pleased to announce the relaunch of Mizzima Weekly. Mizzima is dedicated to helping our readers and viewers keep up to date on the latest developments in Myanmar and related to Myanmar by offering analysis and insight into the subjects that matter. Our websites and our social media channels provide readers and viewers with up-to-the-minute and up-to-date news, which we don’t necessarily need to replicate in our Mizzima Weekly magazine. But where we see a gap is in providing more analysis, insight and in-depth coverage of Myanmar, that is of particular interest to a range of readers.
1. “OK, but where did that data come from?”
Data validation in the
Digital Age
Tom Johnson Cheryl Phillips
Managing Director Data Enterprise Editor
Inst. for Analytic Journalism Seattle Times
Santa Fe, New Mexico USA Seattle, Washington USA
tom@jtjohnson.com
cphillips@seattletImes.com
1
2. Data validation in the
Digital Age
Presentation by Cheryl Phillips and Tom Johnson at
National Institute of Computer-Assisted Reporting Conference
Date/Time: Friday, Feb. 24 at 11 a.m.
Location: Frisco/Burlington Room
St. Louis, Missouri USA
This PowerPoint deck and Tipsheets posted at:
http:// s d r v . m s / w N t i M 7
2
3. The methodology / = the value of the data set and your story
1
Important point
A data base (or
report) is only as
good as the
methodology used
to create it.
3
4. 2
Data sets are living things; they have pedigree and genealogy
Important points
•Most [all?] data sets are living
things.
•And they have a pedigree, a
genealogy.
•Data sets live in a dynamic
environment.
•Understand the DB ecology
4
5. How bad data can do you wrong
Illinois and Missouri sex-offender DB
•“St. Louis Post-Dispatch - 2 May 1999: A11 – “ABOUT 700 SEX
OFFENDERS DO NOT APPEAR TO LIVE AT THE ADDRESSES
LISTED ON A ST. LOUIS REGISTRY; MANY SEX OFFENDERS NEVER
MAKE THE LIST” By Reese Dunklin; Data Analysis By David Heath and Julie
Luca
•Sun, 3 Oct 2004 - THE DALLAS MORNING NEWS - PAGE-1A
“Criminal checks deficient; State's database of convictions is
hurt by lack of reporting, putting public safety at risk, law
officials say” By Diane Jennings and Darlean Spangenberger
•See stories here
6. How bad data can do you wrong
2011 - New Mexico Sec. of State’s “questionable
voters” data set – “The Big Bundle”
•~1.1m voters
•Previous SoS didn’t clean rolls
•Matched name, address, DoB and SS#
– SSA data base; NM driver’s licenses
– 2 variables “mismatch” = Questionable?
– Asked State Police (not AG’s office) to investigate
7. Problems with Sec. of State methodology
• What’s the error rate of original DB?
• Definition of “error”? (Gonzales or Gonzalez)
• Sample(s) by county and state total?
• Error rates of comparative DBs?
• Aggregation of error problem
• 2011 Help America Vote Verification Transaction
Totals, Year-to-Date, by State
https://www.socialsecurity.gov/open/havv/havv-year-
9. There be dragons!
A most
Data base
wonderful
rich with story!!!
potential
9
10. Building genealogy for target DB
1. Pre-plan 1. Acquire latest data and
•2nd monitor related docs
•“Logbook” apps 1. Do tables conform to
1. Lit. review/ interview peers record layout?
1. Do data fit theoretical 1. Do docs specify expected
models? ranges & frequencies?
1. Do a “critical biography” of 1. Are data values missing or
the data out of range?
1. Does biography raise 1. Review major checklist
critical warnings?
1. Have others run analysis of
this data?
Source: Palmer, Griff. “Flowchart/decision tree for data base analysis.” pgs. 136-146. Ver 1.0 Proceedings, IAJ Press (Santa Fe,
NM), April 2006. http://www.lulu.com/product/paperback/ver-10-workshop-proceedings/546459
11. Building genealogy for target DB
1. Pre-plan 1. Acquire latest data and
• Changes in
•2nd monitor related docs
definitions?
•“Logbook” apps 1. Do tables conform to
• review/ interview peers
1. Lit. By administrators? record layout?
• Formal or informal?
1. Do By statute?
• data fit theoretical 1. Do docs specify expected
models? ranges & frequencies?
• Changes in collection
1.methods, data entry,
Do a “critical biography” of 1. Are data values missing or
the data out of range?
vetting, updating, file
1.type/format?raise
Does biography 1. Review major checklist
critical warnings?
• Changes in users and
1.usage
Have others run analysis of
this data?
• Data cleaning
12. Data Quality checkpoints
• Constancy of definitions and coding categories?
• All at same time and location?
• Completeness: How many records have unfilled
cells? Are the tendencies of “nulls” consistent in
all records, variable types?
• Precision: Are the numbers rounded or?
• Hope for fine-grained, not summaries or aggregates
• Can be especially important with temporal and
geographic data, i.e. What is the range(s) of the time
scales?
14. Data Quality checkpoints
• Constancy of definitions and coding categories?
• All at same time and location?
• Completeness: How many records have unfilled
cells? Are the tendencies of “nulls” consistent in
all records, variable types?
• Precision: Are the numbers rounded or?
• Hope for fine-grained, not summaries or aggregates
• Can be especially important with temporal and
geographic data, i.e. What is the range(s) of the time
scales?
15. Newsroom methods for
measuring data quality
• Test frequencies on key fields
Bicycle accidents in Seattle included a time field. But
it was almost always noon when accidents occurred.
Caveat: Don’t over-reach with your conclusions or
analysis
16. Don’t over-reach with your
analysis
– Rates are good – IF you have the data to calculate
them.
17. Outliers are important
Explore the reasons behind anomalies or unexpected
trends in the data.
From the state of WA: After
going back and forth with our
analyst on this, we decided it
would be easiest for her to
just pull the data. You would
have been able to get most of
the way there through that
fiscal.wa.gov site, but there
was some stimulus money
you wouldn’t have captured
and we included the changes
so far to the current
biennium (based on the
supplemental the legislature
approved in December).
18. Other Key Data Checks
– When you update
the data, make sure
nothing has changed.
Check definitions for
expansion or
reduction and talk to
the creator of the
data.
– Be ready to nix a
story.
19. Other Key Data Checks
– Do the math: run sums, percent change, other
calculations. Test that math against the results in
the database – do they match?
– Look for unexpected nulls
– Run a group by query and sort alphabetically by
major fields to test for misspellings or other
categorization errors.
– If your data should include every city, or every
county in the state, does it? Are you missing data?
20. Other Key Data Checks
– Check with experts and have them test your
analysis. Research the methodology used with the
kind of data you are working with.
– There is version control for Web frameworks – use
some kind of version control for your database,
even if it’s in an Excel spreadsheet. Any time you
change it, log what you did and when and why.
21. Other Key Data Checks
– Test the data against source documents.
23. Building genealogy for target DB
• Pre-plan • Acquire latest data and
2nd monitor related docs
NOW you are ready to
“Logbook” apps
• Do tables conform to record
• Lit. review/ interview peers layout?
write a story•Do docs&specifyon
• Do data fit theoretical
models?
based expected
ranges frequencies?
a data base!values missing or
• Do a “critical biography” of
the data
• Are data
out of range?
• Does biography raise critical • Review major checklist
warnings?
• Have others run analysis of Analysis
this data?
24. Summing Up
• Databases are constantly dynamic, “living” things.
Look for and measure their energy and change.
• Beware of rounding error
– Always try to get the most fine-grained data possible in its
ORIGINAL data form or application, i.e. avoid PDFs with
SUMMARY data
• Beware of changing definitions
• Beware of changing data collectors, data entry
personnel, changing norms of editing and usage.
25. “OK, but where did that data come from?”
Many Thanks
Data validation in the
This PowerPoint deck and Tipsheets posted at:
http:// s d r v . m s / w N t i M 7
Tom Johnson Cheryl Phillips
Managing Director Data Enterprise Editor
Inst. for Analytic Journalism Seattle Times
Santa Fe, New Mexico USA Seattle, Washington USA
tom@jtjohnson.com
cphillips@seattletImes.com
25
Editor's Notes
“ The devil is in the data” “ How pure/faulty/legit are the “genes” in your data? =================================================== Opener: They don’t believe us (perhaps with good reason). Get some stats on public’s trust of journalism and journalists. Way to save and perhaps improve our reputation is to make sure of the truthfulness – the validity – of what we are reporting. As we do more and more analysis of data as part of our stories, make sure we are analyzing correct and valid pure–quality data becomes crucial. (We should also be sharing out methods and data with the public, but that’s a topic for another session.)
Finding the headwaters of your data Tracing the process of DB creation Type of agency? Gov’t, NGO, non-profit, profit Who’s responsible for the DB conception? Mandated by legislation, federal or state regulations, executive order? Some administrator For what purpose? Who’s responsible for designing and defining… Variables Collection methods Quantitative or qualitative data? Degree of precision in classification, geography, dates, time-factor Self-reported? Census or sampling? Training for data collectors? Training and verification of classification assignment?
The methodology determines the value of the data set and your story I’m suspicious of -- and reluctant to use – sweeping generalities and Adjectives, but in this case…. Appropriateness of method ALWAYS determines the validity of the analysis, though the method(s) (i.e. analytic tools) may vary depending on your objectives. Methods used to create a data set ALWAYS determine the validity and functionality of the data set Ergo, before we start crunching data and data mining, we need to recognize and know…. The methods used to create the data set determine: The reliability of the data set The functionality (for multiple audiences) of the data set (e.g. who called for the creation of this data set, when and why? Who is to use it for what ends? What is its “measured” value for original users and for our readers? Knowning and understanding those “methods of creation” determines the value of your analysis and, hence, your story.
Most [all?] data sets are living things . A data base, may look to be just a static matrix of text or numbers, but there are living, breathing dynamic forces at work in and around any data set that can provide an interesting context of understanding for journalists. And they have a pedigree, a genealogy. If we don’t understand that genealogy, we can’t evaluate – or properly use – that DB Data sets live in a dynamic environment. All data sets “live” in a context, in an environment in the datasphere that is constantly changing in terms of the validity of the data, who is collecting/updating/editing the data, who is using the data for what purposes and how often? How is Data Set A (or parts of it) related to DS B and C and G. And how do the administrators/analysts of the secondary data measure the quality of the data they are getting from DS A, if they do it at all? Understand the DB ecology See how the data set relates to other sets of data, agencies and users.
Tom will had hyperlinks to these stories, though we might include them in handouts Get bibliography on SSA publications
Get bibliography on SSA publications “ The biggest problem with E-Verify is that it’s based on SSA’s inaccurate records. SSA estimates that 17.8 million (or 4.1 percent) of its records contain discrepancies related to name, date of birth, or citizenship status, with 12.7 million of those records pertaining to U.S. citizens. That means E-Verify will erroneously tell you that 1 in 26 of your legal workforce is not actually legal.” http://www.laborcounselors.com/index.php?option=com_content&view=article&id=715:social-security-mismatch-and-immigration-2011-where-do-we-go-from-here&catid=44&Itemid=300008 “ The error rate for US citizens in the SSA data base is estimated to be 11 percent, meaning that 12.7 million of the 17.8 million "bad" SSNs in 2006 are believed to belong to US citizens, according to SSA's inspector general. “http://migration.ucdavis.edu/mn/more.php?id=3315_0_2_0 2011 Help America Vote Verification Transaction Totals, Year-to-Date, by State https://www.socialsecurity.gov/open/havv/havv-year-to-date-2011.html Tom: I think the answer depends on how many records are in each db. If db1 is very large in comparison to db2, then the error rate should be close to 4.5%. And vice versa. There's probably a formula for this, but I sure don't know it. I'd do the match and then check a sample of the results to estimate the combined error rate. Steve Doig ======================= Let's say each db holds similar data and is the same size, 1000 records. Let's also assume that there are no records duplicated in the two databases, either internally or from one data set to the other. Then you have 45 bad records in one set, and 137 in the other. Combining, you have (45+137) = 182 bad records, in 2000 total records, or an error rate of 9.1%. Same process can be used to calculate error rate combining data from any number of sets, of any size as long as no records are duplicated. Error LIMITS/confidence intervals would be quite a different matter. Steve Ross Ah, but what if one DB has an error rate of 73% and the other has an error rate of 82%. How could you have an error rate >100%? Ergo, the question becomes: What is the lowest “acceptable” error rate for meaningful analysis. (Whatever “meaningful” means.)
Always a VERY complex problem for analysis bcs of “definitions,” changes over time and then statistical evaluation methods Assume you can determine, from sampling, that Data Base “A” has 8.5% records with errors. Assume DB “B” has 11.3% of records with errors (how to define “error”?). If you compare one to the other, your probability of errors will be 8.5+11.3 or 19.8%. Ah, but what if one DB has an error rate of 73% and the other has an error rate of 82%. How could you have an error rate >100%? Ergo, the question becomes: What is the lowest “acceptable” error rate for meaningful analysis. (Whatever “meaningful” means.) Help America Vote Transactions? Note that New Mexico has not sought any clarifications. Social Security Makes Help America Vote Act Data Available http://www.socialsecurity.gov/pressoffice/pr/HAVA-pr.html ( Printer friendly version ) Michael J. Astrue, Commissioner of Social Security, today announced the agency is publishing data on its Open Government website www.socialsecurity.gov/open about verifications the agency conducts for States under the Help America Vote Act (HAVA) of 2002. Under HAVA, most States are required to verify the last four digits of the Social Security number of people newly registering to vote who do not possess a valid State driver's license. “ I strongly support President Obama’s commitment to creating an open and transparent government,” Commissioner Astrue said. “As we approach another federal election year, it remains absolutely critical that Americans are able to register to vote without undue obstacles. Making this data publicly available will allow the media and the public on a timely basis to raise questions about unexpected patterns with the appropriate State officials.” The data available at www.socialsecurity.gov/open/havv represents the summary results for each State of the four-digit match performed by Social Security under HAVA. # # # http://www.socialsecurity.gov/pressoffice/pr/HAVA-pr.html
DYNAMIC DATA & DATA BASE OR SET https://www.socialsecurity.gov/open/havv/havv-year-to-date-2011.html What do these terms mean? The following list describes the types of data in the HAVV dataset. Total Transactions: The total number of verification requests made during the time period. Unprocessed Transactions: The total number of verification requests that could not be processed because the data sent to us was invalid, (e.g., missing, not formatted correctly). Total Matches: The total number of verification requests where there is at least one match in our records on the name, last four digits of the SSN and date of birth. Total Non Matches: The total number of verification requests where there is no match in our records on the name, last four digits of the SSN or date of birth. Multiple Matches Found – At least one alive and at least one deceased : The total number of verification requests where there are multiple matches on name, date of birth, and the last four digits of the SSN, and at least one of the number holders is alive and at least one of the number holders is deceased. Single Match Found – Alive: The total number of verification requests where there is only one match in our records on name, last four digits of the SSN and date of birth, and the number holder is alive. Single Match Found – Deceased: The total number of verification requests where there is only one match in our records on name, date of birth, and last four digits of the SSN, and the number holder is deceased. Multiple Matches Found – All Alive: The total number of verification requests where there are multiple matches on name, date of birth, and last four digits of the SSN, and each match indicates the number holder is alive. Multiple Match Found – All Deceased: The total number of verification requests where there are multiple matches on name, date of birth, and the last four digits of the SSN, and each match indicates the number holder is deceased.
Source: Palmer, Griff. “Flowchart/decision tree for data base analysis.” pgs. 136-146 Ver 1.0 Proceedings, IAJ Press (Santa Fe, NM), April 2006. http://www.lulu.com/product/paperback/ver-10-workshop-proceedings/546459 1. Pre-plan 1a. 2 nd monitor 2a. “logbook” applications 2. Lit. review/ interview peers 3. Do data fit theoretical models? 4. Do a “critical biography” of the data 5. Does biography raise critical warnings? 6. Have others run analysis of this data? 7. Acquire latest data and related docs 8. Do tables conform to record layout? 9. Do docs specify expected ranges & frequencies? 10. Are data values missing or out of range? 11. Review major checklist
Source: http://nsu.aphis.usda.gov/outlook/issue5/data_quality_part2.pdf Constancy of definitions and coding categories ? All at same time and location? Completeness: How many records have unfilled cells? Are the tendencies of “nulls” consistent in all records, variable types? Precision: Are the numbers rounded or? Hope for fine-grained, not summaries or aggregates Can be especially important with temporal and geographic data, i.e. What is the range(s) of the time scales? Can be a lot of difference in traffic counts, for example, if the data is hourly vs. 15-minute intervals. Or in range of ages.
Important to note not to jump to conclusions, or try to do more analysis than makes sense. For example, rates would have been misleading because we don’t have good bicycle counts by street or intersection, much less car-traffic counts. But we could use this anecdotally in the story: In the city's annual mid-September count, there were 3,251 cyclists commuting into downtown in 2010, up from 2,273 in 2007. So, accidents are holding steady while the number of commuters is increasing.
Last year, editors at The Seattle Times noticed more food trucks around. There must be a story about the safety record of these trucks, they thought. So, of course, we checked it out. What we found? Food trucks were just as clean, met inspection rules, just as much as all other types of restaurants. In part, this was because their food came from prep sites most of the time and was not cooked in a mobile unit. And, just to be sure, we checked the prep sites. They got good grades too.
“ The devil is in the data” “ How pure/faulty/legit are the “genes” in your data? =================================================== Opener: They don’t believe us (perhaps with good reason). Get some stats on public’s trust of journalism and journalists. Way to save and perhaps improve our reputation is to make sure of the truthfulness – the validity – of what we are reporting. As we do more and more analysis of data as part of our stories, make sure we are analyzing correct and valid pure–quality data becomes crucial. (We should also be sharing out methods and data with the public, but that’s a topic for another session.)