Download as PDF, PPTX


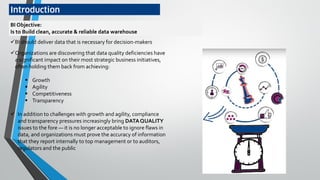
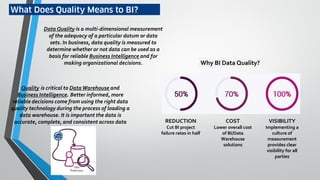
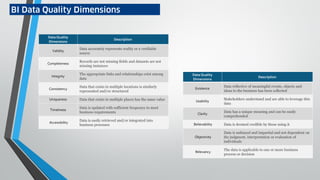


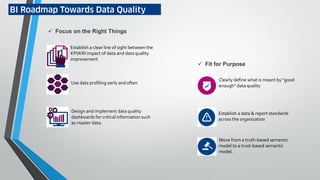


This document discusses quality and data quality in the context of business intelligence (BI). It defines what data quality means for BI, noting that better decisions come from using quality data quality technology when loading a data warehouse to ensure data is accurate, complete, and consistent. It also outlines common data quality dimensions and issues organizations face with data quality. The document advocates establishing a clear line of sight between data quality KPIs and improvements. It proposes a roadmap for BI that focuses on the right priorities for data quality and establishing fit-for-purpose standards.


