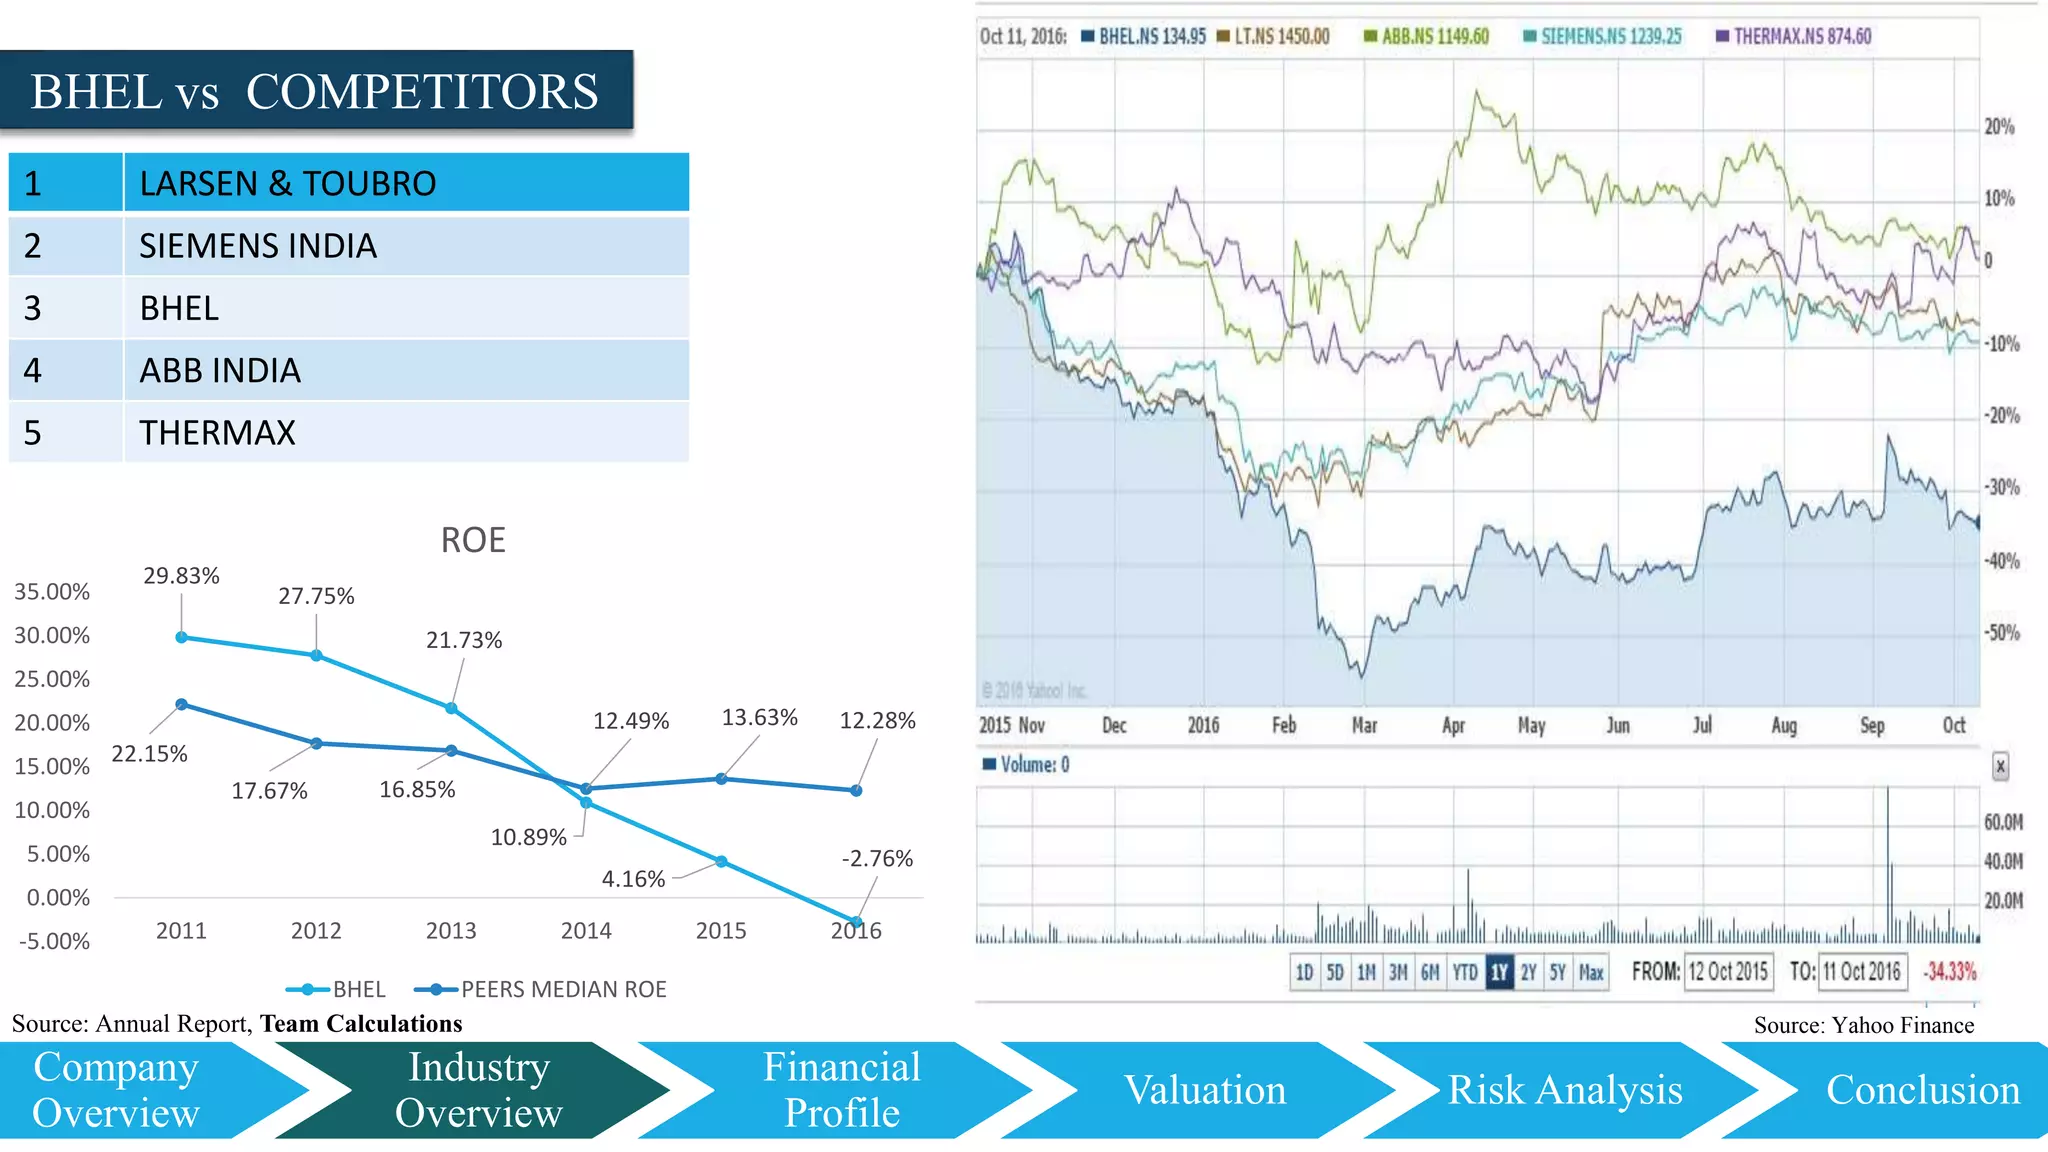
Omkar, Akash, Akshay,
Mohd. Safwan, Mayank, Vikas
Company
Overview
Industry
Overview
63.06%
2.25%
5.26%
10.43%
14.18%
4.82% Promoter &
Promoter Group
Mutual fund / UTI
FI/ Banks
Insurance company
FPI
Indivuidual
Introduction
Main Features
• One of the Largest Engineering & Manufacturing Company
• 10,000 MW+ Power Project Commissioned/Synchronized
• Hydropower Project Commissioned 100% By BHEL
• Consistent Dividend Paying Company
Shareholder’s Structure
Financial
Profile
Valuation Risk Analysis Conclusion
Market Profile as on 10/10/2016
Share Price Rs.135.95
52 Week Low - High (Rs.) 90.40 - 219.70
Market Capitalization
(Rs.in crore)
33275.12
P/B Ratio (2016) 1.01
Face value (Rs.) 2
Source: Annual Report, Team Calculations
43337
49509.78 50156.48
40337.92
30947.04
26586.51
0
10000
20000
30000
40000
50000
60000
2011 2012 2013 2014 2015 2016
Turnover (Rs. in crore)
Source: Annual report 2015-16
Industry
Overview
Financial
Profile
Company
Overview
Valuation Risk Analysis Conclusion
60507
22096
31650
28007
30814
43727
164100
135300
115100
101500
101000
110730
0
20000
40000
60000
80000
100000
120000
140000
160000
180000
2010-11 2011-12 2012-13 2013-14 2014-15 2015-16
Orders Received and Orders Outstanding
(Rs. in crore)
Orders Recieved Order Outstanding
Source: Annual Report, Team Calculations
8138 9298 8563 8230
13061
272
30
2703
2000
1180
0
2000
4000
6000
8000
10000
12000
14000
16000
11-12 11-12 13-14 14-15 15-16
Contribution to India's Utility Power
Generation Capacity ( in MW)
Capacity Addition Synchronization
BHEL 55%
Non-BHEL
45%
Installed Capacity- Utility*
2,65,598 MW (31.03.16)
BHEL
58%
Non-BHEL
42%
Generation – Utility*
896 BU (2015-16)
Recommendation
Reasons
• Backlog of order book
• EBITDA Margin (Y-o-Y)
• Execution of JDU project and
intense competition
Recommendation
Company
Overview
Industry
Overview
Financial
Profile
Valuation Risk Analysis Conclusion
80%
11%
9%
Sector wise Order Book Outstanding
Power Sector Indusry Sector International Operation
SELL
Businesses Description
Company
Overview
Industry
Overview
Financial
Profile
Valuation Risk Analysis Conclusion
201520142013201220112001 - 101991 - 001981 - 901971 - 801964 -70
Incorporated as ‘Bharat
Heavy Electricals
Limited’ with 100%
ownership of “GOI”
Added plants to
manufacture Ceramic
Insulators, Boiler
Auxiliaries, Industrial
Valves and NCES
products
Crossed Market Cap. of over
INR 1 trillion (US$16.7 bn)
Manufacturing Capacity
augmented to 10,000 MW per
annum
Cumulative installed capacity
of worldwide projects crossed
1,00,000 MW
Commissioned India’s
first Ultra High Voltage
AC 1200 kV
Transformer
Realized the capability
to deliver 20,000 MW
p.a. of power
equipment
Cumulative power projects
installed worldwide crossed
1,50,000 MW
First indigenously
manufactured 800 MW
Boiler synchronised for
APPDCL at Krishnapatnam
Bagged its first export order for
boilers (2x60 MW) for Thermal
Power
Station in Malaysia
Setup of Corporate R&D division
The company has been earning
profits continuously since 1971-
72 and paying dividends
uninterruptedly since 1976-77
Converted into a
public limited
company
Entered into a gas
turbine JV with GE
Listed on NSE and
BSE
Ranked as the 9th Most
Innovative Company in the
World by Forbes
Becomes the first company in
India to develop and
manufacture 1200 kV, 333
MVA Transformers
Commissioned new rating 525
MW thermal sets first time in
India
Crossed INR 500 bn
(US$ 8.3 bn) Turnover
mark
First BHEL made 660
MW Supercritical unit
commissioned
First indigenously
manufactured
Supercritical set of
rating 660 MW
commissioned by BHEL
at NTPC Barh-5
Developed
breakthrough Fuel
Flexible Boiler design
Industry Overview
1
2
3
4
5
Competiton
Buyer
SupplierNew Entrants
Substitute
The capital goods & engineering turnover in India is expected to
reach US$ 125.4 billion by FY17
Mechanical and Engineering industries during April 2000 to
March 2016 stood at around US$ 3,068.1 million, as per data
released by the Department of Industries Policy and Promotion
(DIPP)
Reduced the basic customs duty from 10 per cent to 5 per cent
on forged steel rings used in the manufacture of bearings of
wind operated electricity generators
Spending on engineering services is projected to
increase to US$ 1.1 trillion by 2020
Source: http://www.ibef.org/industry/engineering-india.aspx
Industry
Overview
Company
Overview
Industry Overview
Financial
Profile
Valuation Risk Analysis Conclusion
Source: Team Calculations
PORTER’S FIVE FORCES
BHEL vs COMPETITORS
29.83%
27.75%
21.73%
10.89%
4.16%
-2.76%
22.15%
17.67% 16.85%
12.49% 13.63% 12.28%
-5.00%
0.00%
5.00%
10.00%
15.00%
20.00%
25.00%
30.00%
35.00%
2011 2012 2013 2014 2015 2016
ROE
BHEL PEERS MEDIAN ROE
1 LARSEN & TOUBRO
2 SIEMENS INDIA
3 BHEL
4 ABB INDIA
5 THERMAX
Source: YAHOO FINANCE
Industry
Overview
Company
Overview
Financial
Profile
Valuation Risk Analysis Conclusion
Source: Yahoo FinanceSource: Annual Report, Team Calculations
Financial Profile
9604.29
11153.5
10511.1
6129.85
3308.98
-514.25
-2000
0
2000
4000
6000
8000
10000
12000
14000
2011 2012 2013 2014 2015 2016
EBITDA (Rs. in crore)
& EBITDA Margin (%)
23.11%
23.62%
22.07%
15.97%
11.20%
-2.05%
Financial Profile
Industry
Overview
Company
Overview
Financial
Profile
9060.17
10353.54
9557.71
5146.93
2231.66
-1449.89
-4000
-2000
0
2000
4000
6000
8000
10000
12000
14000
2011 2012 2013 2014 2015 2016
EBIT
(Rs. in crore)
26.40% 27.21%
22.59%
10.89%
4.82%
-3.17%
-5.00%
0.00%
5.00%
10.00%
15.00%
20.00%
25.00%
30.00%
35.00%
2011 2012 2013 2014 2015 2016
ROCE (%)
29.83%
27.75%
21.73%
10.47%
4.16%
-2.76%
-5.00%
0.00%
5.00%
10.00%
15.00%
20.00%
25.00%
30.00%
35.00%
2011 2012 2013 2014 2015 2016
Return On Equity (%)
Valuation Risk Analysis Conclusion
Source: Annual Report, Team Calculations
Return On Equity (ROE, Five components)
Company
overview
Financial
Profile
Industry
Overview
Valuation
DuPont Analysis
66.75%
68.33%
70.13%
69.02%
66.32%
61.86%
56.00%
58.00%
60.00%
62.00%
64.00%
66.00%
68.00%
70.00%
72.00%
2011 2012 2013 2014 2015 2016
Tax Burden
99.40% 99.50%
98.69%
97.42%
95.89%
101.85%
92.00%
94.00%
96.00%
98.00%
100.00%
102.00%
104.00%
2011 2012 2013 2014 2015 2016
Interest Burden
21.80% 21.92%
20.07%
13.41%
7.55%
-5.77%-10.00%
-5.00%
0.00%
5.00%
10.00%
15.00%
20.00%
25.00%
30.00%
2011 2012 2013 2014 2015 2016
Operating Profit Margin
(EBIT/NET REVENUE)
70.14% 70.73% 67.90%
52.74%
43.15%
37.69%
0.00%
10.00%
20.00%
30.00%
40.00%
50.00%
60.00%
70.00%
80.00%
2011 2012 2013 2014 2015 2016
Total Assets Turnover
294.04%
263.18%
230.35% 220.27%
200.87% 201.77%
0.00%
50.00%
100.00%
150.00%
200.00%
250.00%
300.00%
350.00%
2011 2012 2013 2014 2015 2016
Equity Multiplier (Financial Leverage)
Risk Analysis Conclusion
Source: Annual Report, Team Calculations
Company
overview
Financial
Profile
Industry
Overview
3.35
3.14 3.10
3.21
2.82 2.80
2.40
2.60
2.80
3.00
3.20
3.40
2011 2012 2013 2014 2015 2016
Inventory Turnover Ratio
109
116 118
114
129 131
95
100
105
110
115
120
125
130
135
2011 2012 2013 2014 2015 2016
Inventory (Days)
Activity Ratio
Valuation Risk Analysis Conclusion
2.04 2.03
1.71
1.34
1.09 0.99
0.00
0.50
1.00
1.50
2.00
2.50
2011 2012 2013 2014 2015 2016
Receivables Turnover Ratio
179 179
213
272
335
368
0
50
100
150
200
250
300
350
400
2011 2012 2013 2014 2015 2016
Days of Receivables Outstanding
2.88
2.46
2.21
1.55
1.12
0.97
0.00
0.50
1.00
1.50
2.00
2.50
3.00
3.50
2011 2012 2013 2014 2015 2016
Working Capital Turnover
165
129 133
234
285
207
0
50
100
150
200
250
300
2011 2012 2013 2014 2015 2016
Cash Conversion Cycle (Days)
Source: Annual Report, Team Calculations
Other Ratios
2.61
0.76
1.13
1.27
1.74
2.67
0.00
0.50
1.00
1.50
2.00
2.50
3.00
2011 2012 2013 2014 2015 2016
Order Received /Raw Material
Company
overview
Financial
Profile
Industry
Overview
Valuation Risk Analysis Conclusion
1.40
0.45
0.63 0.69
1.00
1.64
0.00
0.20
0.40
0.60
0.80
1.00
1.20
1.40
1.60
1.80
2011 2012 2013 2014 2015 2016
Order Received/ Sales
41.94% 42.87%
34.82%
16.17%
7.36%
-4.93%
-10.00%
0.00%
10.00%
20.00%
30.00%
40.00%
50.00%
60.00%
2011 2012 2013 2014 2015 2016
Return On Capital
38.86%
44.41%
40.99%
22.08%
9.57%
-6.22%
-10.00%
0.00%
10.00%
20.00%
30.00%
40.00%
50.00%
60.00%
2011 2012 2013 2014 2015 2016
Earnings Yield
Source: Annual Report, Team Calculations
Company
overview
Financial
Profile
Industry
Overview
Valuation Risk Analysis Conclusion
1.74 1.70
1.83
2.04
2.19 2.22
0.00
0.50
1.00
1.50
2.00
2.50
2011 2012 2013 2014 2015 2016
CURRENT RATIO
1.30 1.23
1.41
1.65 1.73 1.76
0.00
0.20
0.40
0.60
0.80
1.00
1.20
1.40
1.60
1.80
2.00
2011 2012 2013 2014 2015 2016
QUICK RATIO
0.39
0.23
0.28
0.46 0.44
0.48
0.00
0.10
0.20
0.30
0.40
0.50
0.60
2011 2012 2013 2014 2015 2016
CASH RATIO
Solvency Ratios
Source: Annual Report, Team Calculations
Valuation
FORWARD MULTIPLES
Industry
overview
Valuation Risk Analysis Conclusion
Company
overview
Financial
Profile
Relative Valuation
1.32 1.24
2.84 2.65
2.26 1.96
3.82 3.47
2.39 2.10
PEER GROUP SELECTION CRITERIA
• Companies major business is in power sector
• Capital goods producer and engineering
BHEL
ABB INDIA
LARSEN & TURBO
SIEMENS INDIA
THERMAX
Price/Book value
1.01
8.10
3.32
8.61
4.19
5.04
P/REVENUE
2016 2017(E)
EV/REVENUE
2016 2017(E)
0.93
2.84
2.44
3.64
2.38
2.45
0.87
2.65
2.12
3.31
2.09
2.21 2.52 2.28INDUSTRY AVERAGE
2016
Source: Annual Report, Team Calculations
Industry
overview
Valuation Risk Analysis Conclusion
Company
overview
Financial
Profile
FCFF Analysis
Tax Rate 38.14%
After Tax
Kd 17.94%
Ke 8.17%
Debt
Weightage 0.36%
Equity
Weightage 99.64%
WACC 8.21%
Assumption: FCFF Growth Rate -4.50% CAGR (NET SALES)
2017E 2018E 2019E 2020E
1 2 3 4
FCFF 3335.67 3255.79 3177.88 3133.68
Terminal Value 30692.28
Present Value of Free Cash Flow 3082.59 2780.49 2508.04 2285.52
PV of Terminal Value 22385.13
Total Present Value of Cash Flow 33041.79
Less: Net Debt 9959.7
Value of Equity 23082.09
No of Shares Outstanding 244.76
EQUITY VALUE PER SHARE (Rs.) 94.30
Source: Team Calculations
-6%
-4%
-2%
0%
2%
4%
6%
8%
10%
12%
14%
ROCE
Capital Employed
CapexCost of Capital
Margin Of Safety
WEALTH CREATION
Motilal Oswal’s Five Forces of Wealth Creation ©
Industry
overview
Valuation Risk Analysis Conclusion
Company
overview
Financial
Profile
Source: www.marketsmojo.com
BHEL vs NIFTY 50
5 YEARS RETURN 1 YEAR RETURN
Industry
overview
Valuation Risk Analysis Conclusion
Company
overview
Financial
Profile
Risk Analysis
33.40% 25.00% 41.70%
0% 10% 20% 30% 40% 50% 60% 70% 80% 90% 100%
Sector-wise Contribution To Installed Generation Capacity,
FY 2016
State Sector Central Sector Private Sector
Source :www.pwc.in/assets/pdfs/publications/2016/round-the-clock-power-supply.pdf
BHEL vs POWER SECTOR
CONTRIBUTION
 UDAY scheme (Ujwal DISCOM Assurance Yojana) as of march 2015, the
aggregated accumulated losses of discoms are, Rs 3.8 lakh crore and their
outstanding debt is Rs 4.3 lakh crore.
 IPDS (Integrated Power Development Scheme) is basically a new avatar of
R-APDRP scheme in which funds are provided for reduction of AT&C losses,
up gradation of infrastructure, it based billing and auditing system and
collection efficiency.
 DDUGJY (Deendayal Upadhyaya Gram Jyoti Yojana) focuses on feeder
separation for rural households and agricultural.
Industry
overview
Valuation Risk Analysis Conclusion
Company
overview
Financial
Profile
Source: Power for All, MoP
Industry
overview
Valuation Risk Analysis Conclusion
Company
overview
Financial
Profile
59.0%
7.0%
4.0%
10.0%
ESTIMATED SECTOR- WISE COAL CONSUMPTION IN INDIA(2016-
2017)
ELECTRICITY IRON & STEEL CEMENT OTHERS NON- ELECTRICITY
BHEL vs POWER SECTOR
 The Coal Sector is Burdened with Taxes such as payment for
District Mineral Foundation (DMF), payment of National Mineral
Exploration (NMET), both as a percentage of Royalty, and Clean
Energy Cess that has been Increased to INR 400 per tonne for
2016-17
 State-owned CIL's 66 projects are facing delays due to reasons
including land acquisition problem as well as rehabilitation and
resettlement issues
 Loss of Rs. 1.85 Lakh cr. Estimated by CAG (Comptroller and
Auditor General) in coal allocation
Source :www.dnaindia.com/money/report-coal-india-s-66-coal-mine-projects-facing-delays
Source: .pwc.in/icc-coal-report
Order Back Log
Unsound Financial
Position
Decreasing Operational
Efficiency
SELL
CONCLUSION
Industry
overview
Valuation Risk Analysis Conclusion
Company
overview
Financial
Profile

bharat heavy electrical limited

  • 1.
    Omkar, Akash, Akshay, Mohd.Safwan, Mayank, Vikas
  • 2.
    Company Overview Industry Overview 63.06% 2.25% 5.26% 10.43% 14.18% 4.82% Promoter & PromoterGroup Mutual fund / UTI FI/ Banks Insurance company FPI Indivuidual Introduction Main Features • One of the Largest Engineering & Manufacturing Company • 10,000 MW+ Power Project Commissioned/Synchronized • Hydropower Project Commissioned 100% By BHEL • Consistent Dividend Paying Company Shareholder’s Structure Financial Profile Valuation Risk Analysis Conclusion Market Profile as on 10/10/2016 Share Price Rs.135.95 52 Week Low - High (Rs.) 90.40 - 219.70 Market Capitalization (Rs.in crore) 33275.12 P/B Ratio (2016) 1.01 Face value (Rs.) 2 Source: Annual Report, Team Calculations
  • 3.
    43337 49509.78 50156.48 40337.92 30947.04 26586.51 0 10000 20000 30000 40000 50000 60000 2011 20122013 2014 2015 2016 Turnover (Rs. in crore) Source: Annual report 2015-16 Industry Overview Financial Profile Company Overview Valuation Risk Analysis Conclusion 60507 22096 31650 28007 30814 43727 164100 135300 115100 101500 101000 110730 0 20000 40000 60000 80000 100000 120000 140000 160000 180000 2010-11 2011-12 2012-13 2013-14 2014-15 2015-16 Orders Received and Orders Outstanding (Rs. in crore) Orders Recieved Order Outstanding Source: Annual Report, Team Calculations 8138 9298 8563 8230 13061 272 30 2703 2000 1180 0 2000 4000 6000 8000 10000 12000 14000 16000 11-12 11-12 13-14 14-15 15-16 Contribution to India's Utility Power Generation Capacity ( in MW) Capacity Addition Synchronization BHEL 55% Non-BHEL 45% Installed Capacity- Utility* 2,65,598 MW (31.03.16) BHEL 58% Non-BHEL 42% Generation – Utility* 896 BU (2015-16)
  • 4.
  • 5.
    Reasons • Backlog oforder book • EBITDA Margin (Y-o-Y) • Execution of JDU project and intense competition Recommendation Company Overview Industry Overview Financial Profile Valuation Risk Analysis Conclusion 80% 11% 9% Sector wise Order Book Outstanding Power Sector Indusry Sector International Operation SELL
  • 6.
  • 7.
    Company Overview Industry Overview Financial Profile Valuation Risk AnalysisConclusion 201520142013201220112001 - 101991 - 001981 - 901971 - 801964 -70 Incorporated as ‘Bharat Heavy Electricals Limited’ with 100% ownership of “GOI” Added plants to manufacture Ceramic Insulators, Boiler Auxiliaries, Industrial Valves and NCES products Crossed Market Cap. of over INR 1 trillion (US$16.7 bn) Manufacturing Capacity augmented to 10,000 MW per annum Cumulative installed capacity of worldwide projects crossed 1,00,000 MW Commissioned India’s first Ultra High Voltage AC 1200 kV Transformer Realized the capability to deliver 20,000 MW p.a. of power equipment Cumulative power projects installed worldwide crossed 1,50,000 MW First indigenously manufactured 800 MW Boiler synchronised for APPDCL at Krishnapatnam Bagged its first export order for boilers (2x60 MW) for Thermal Power Station in Malaysia Setup of Corporate R&D division The company has been earning profits continuously since 1971- 72 and paying dividends uninterruptedly since 1976-77 Converted into a public limited company Entered into a gas turbine JV with GE Listed on NSE and BSE Ranked as the 9th Most Innovative Company in the World by Forbes Becomes the first company in India to develop and manufacture 1200 kV, 333 MVA Transformers Commissioned new rating 525 MW thermal sets first time in India Crossed INR 500 bn (US$ 8.3 bn) Turnover mark First BHEL made 660 MW Supercritical unit commissioned First indigenously manufactured Supercritical set of rating 660 MW commissioned by BHEL at NTPC Barh-5 Developed breakthrough Fuel Flexible Boiler design
  • 8.
  • 9.
    1 2 3 4 5 Competiton Buyer SupplierNew Entrants Substitute The capitalgoods & engineering turnover in India is expected to reach US$ 125.4 billion by FY17 Mechanical and Engineering industries during April 2000 to March 2016 stood at around US$ 3,068.1 million, as per data released by the Department of Industries Policy and Promotion (DIPP) Reduced the basic customs duty from 10 per cent to 5 per cent on forged steel rings used in the manufacture of bearings of wind operated electricity generators Spending on engineering services is projected to increase to US$ 1.1 trillion by 2020 Source: http://www.ibef.org/industry/engineering-india.aspx Industry Overview Company Overview Industry Overview Financial Profile Valuation Risk Analysis Conclusion Source: Team Calculations PORTER’S FIVE FORCES
  • 10.
    BHEL vs COMPETITORS 29.83% 27.75% 21.73% 10.89% 4.16% -2.76% 22.15% 17.67%16.85% 12.49% 13.63% 12.28% -5.00% 0.00% 5.00% 10.00% 15.00% 20.00% 25.00% 30.00% 35.00% 2011 2012 2013 2014 2015 2016 ROE BHEL PEERS MEDIAN ROE 1 LARSEN & TOUBRO 2 SIEMENS INDIA 3 BHEL 4 ABB INDIA 5 THERMAX Source: YAHOO FINANCE Industry Overview Company Overview Financial Profile Valuation Risk Analysis Conclusion Source: Yahoo FinanceSource: Annual Report, Team Calculations
  • 11.
  • 12.
    9604.29 11153.5 10511.1 6129.85 3308.98 -514.25 -2000 0 2000 4000 6000 8000 10000 12000 14000 2011 2012 20132014 2015 2016 EBITDA (Rs. in crore) & EBITDA Margin (%) 23.11% 23.62% 22.07% 15.97% 11.20% -2.05% Financial Profile Industry Overview Company Overview Financial Profile 9060.17 10353.54 9557.71 5146.93 2231.66 -1449.89 -4000 -2000 0 2000 4000 6000 8000 10000 12000 14000 2011 2012 2013 2014 2015 2016 EBIT (Rs. in crore) 26.40% 27.21% 22.59% 10.89% 4.82% -3.17% -5.00% 0.00% 5.00% 10.00% 15.00% 20.00% 25.00% 30.00% 35.00% 2011 2012 2013 2014 2015 2016 ROCE (%) 29.83% 27.75% 21.73% 10.47% 4.16% -2.76% -5.00% 0.00% 5.00% 10.00% 15.00% 20.00% 25.00% 30.00% 35.00% 2011 2012 2013 2014 2015 2016 Return On Equity (%) Valuation Risk Analysis Conclusion Source: Annual Report, Team Calculations
  • 13.
    Return On Equity(ROE, Five components) Company overview Financial Profile Industry Overview Valuation DuPont Analysis 66.75% 68.33% 70.13% 69.02% 66.32% 61.86% 56.00% 58.00% 60.00% 62.00% 64.00% 66.00% 68.00% 70.00% 72.00% 2011 2012 2013 2014 2015 2016 Tax Burden 99.40% 99.50% 98.69% 97.42% 95.89% 101.85% 92.00% 94.00% 96.00% 98.00% 100.00% 102.00% 104.00% 2011 2012 2013 2014 2015 2016 Interest Burden 21.80% 21.92% 20.07% 13.41% 7.55% -5.77%-10.00% -5.00% 0.00% 5.00% 10.00% 15.00% 20.00% 25.00% 30.00% 2011 2012 2013 2014 2015 2016 Operating Profit Margin (EBIT/NET REVENUE) 70.14% 70.73% 67.90% 52.74% 43.15% 37.69% 0.00% 10.00% 20.00% 30.00% 40.00% 50.00% 60.00% 70.00% 80.00% 2011 2012 2013 2014 2015 2016 Total Assets Turnover 294.04% 263.18% 230.35% 220.27% 200.87% 201.77% 0.00% 50.00% 100.00% 150.00% 200.00% 250.00% 300.00% 350.00% 2011 2012 2013 2014 2015 2016 Equity Multiplier (Financial Leverage) Risk Analysis Conclusion Source: Annual Report, Team Calculations
  • 14.
    Company overview Financial Profile Industry Overview 3.35 3.14 3.10 3.21 2.82 2.80 2.40 2.60 2.80 3.00 3.20 3.40 20112012 2013 2014 2015 2016 Inventory Turnover Ratio 109 116 118 114 129 131 95 100 105 110 115 120 125 130 135 2011 2012 2013 2014 2015 2016 Inventory (Days) Activity Ratio Valuation Risk Analysis Conclusion 2.04 2.03 1.71 1.34 1.09 0.99 0.00 0.50 1.00 1.50 2.00 2.50 2011 2012 2013 2014 2015 2016 Receivables Turnover Ratio 179 179 213 272 335 368 0 50 100 150 200 250 300 350 400 2011 2012 2013 2014 2015 2016 Days of Receivables Outstanding 2.88 2.46 2.21 1.55 1.12 0.97 0.00 0.50 1.00 1.50 2.00 2.50 3.00 3.50 2011 2012 2013 2014 2015 2016 Working Capital Turnover 165 129 133 234 285 207 0 50 100 150 200 250 300 2011 2012 2013 2014 2015 2016 Cash Conversion Cycle (Days) Source: Annual Report, Team Calculations
  • 15.
    Other Ratios 2.61 0.76 1.13 1.27 1.74 2.67 0.00 0.50 1.00 1.50 2.00 2.50 3.00 2011 20122013 2014 2015 2016 Order Received /Raw Material Company overview Financial Profile Industry Overview Valuation Risk Analysis Conclusion 1.40 0.45 0.63 0.69 1.00 1.64 0.00 0.20 0.40 0.60 0.80 1.00 1.20 1.40 1.60 1.80 2011 2012 2013 2014 2015 2016 Order Received/ Sales 41.94% 42.87% 34.82% 16.17% 7.36% -4.93% -10.00% 0.00% 10.00% 20.00% 30.00% 40.00% 50.00% 60.00% 2011 2012 2013 2014 2015 2016 Return On Capital 38.86% 44.41% 40.99% 22.08% 9.57% -6.22% -10.00% 0.00% 10.00% 20.00% 30.00% 40.00% 50.00% 60.00% 2011 2012 2013 2014 2015 2016 Earnings Yield Source: Annual Report, Team Calculations
  • 16.
    Company overview Financial Profile Industry Overview Valuation Risk AnalysisConclusion 1.74 1.70 1.83 2.04 2.19 2.22 0.00 0.50 1.00 1.50 2.00 2.50 2011 2012 2013 2014 2015 2016 CURRENT RATIO 1.30 1.23 1.41 1.65 1.73 1.76 0.00 0.20 0.40 0.60 0.80 1.00 1.20 1.40 1.60 1.80 2.00 2011 2012 2013 2014 2015 2016 QUICK RATIO 0.39 0.23 0.28 0.46 0.44 0.48 0.00 0.10 0.20 0.30 0.40 0.50 0.60 2011 2012 2013 2014 2015 2016 CASH RATIO Solvency Ratios Source: Annual Report, Team Calculations
  • 17.
  • 18.
    FORWARD MULTIPLES Industry overview Valuation RiskAnalysis Conclusion Company overview Financial Profile Relative Valuation 1.32 1.24 2.84 2.65 2.26 1.96 3.82 3.47 2.39 2.10 PEER GROUP SELECTION CRITERIA • Companies major business is in power sector • Capital goods producer and engineering BHEL ABB INDIA LARSEN & TURBO SIEMENS INDIA THERMAX Price/Book value 1.01 8.10 3.32 8.61 4.19 5.04 P/REVENUE 2016 2017(E) EV/REVENUE 2016 2017(E) 0.93 2.84 2.44 3.64 2.38 2.45 0.87 2.65 2.12 3.31 2.09 2.21 2.52 2.28INDUSTRY AVERAGE 2016 Source: Annual Report, Team Calculations
  • 19.
    Industry overview Valuation Risk AnalysisConclusion Company overview Financial Profile FCFF Analysis Tax Rate 38.14% After Tax Kd 17.94% Ke 8.17% Debt Weightage 0.36% Equity Weightage 99.64% WACC 8.21% Assumption: FCFF Growth Rate -4.50% CAGR (NET SALES) 2017E 2018E 2019E 2020E 1 2 3 4 FCFF 3335.67 3255.79 3177.88 3133.68 Terminal Value 30692.28 Present Value of Free Cash Flow 3082.59 2780.49 2508.04 2285.52 PV of Terminal Value 22385.13 Total Present Value of Cash Flow 33041.79 Less: Net Debt 9959.7 Value of Equity 23082.09 No of Shares Outstanding 244.76 EQUITY VALUE PER SHARE (Rs.) 94.30 Source: Team Calculations
  • 20.
    -6% -4% -2% 0% 2% 4% 6% 8% 10% 12% 14% ROCE Capital Employed CapexCost ofCapital Margin Of Safety WEALTH CREATION Motilal Oswal’s Five Forces of Wealth Creation © Industry overview Valuation Risk Analysis Conclusion Company overview Financial Profile
  • 21.
    Source: www.marketsmojo.com BHEL vsNIFTY 50 5 YEARS RETURN 1 YEAR RETURN Industry overview Valuation Risk Analysis Conclusion Company overview Financial Profile
  • 22.
  • 23.
    33.40% 25.00% 41.70% 0%10% 20% 30% 40% 50% 60% 70% 80% 90% 100% Sector-wise Contribution To Installed Generation Capacity, FY 2016 State Sector Central Sector Private Sector Source :www.pwc.in/assets/pdfs/publications/2016/round-the-clock-power-supply.pdf BHEL vs POWER SECTOR CONTRIBUTION  UDAY scheme (Ujwal DISCOM Assurance Yojana) as of march 2015, the aggregated accumulated losses of discoms are, Rs 3.8 lakh crore and their outstanding debt is Rs 4.3 lakh crore.  IPDS (Integrated Power Development Scheme) is basically a new avatar of R-APDRP scheme in which funds are provided for reduction of AT&C losses, up gradation of infrastructure, it based billing and auditing system and collection efficiency.  DDUGJY (Deendayal Upadhyaya Gram Jyoti Yojana) focuses on feeder separation for rural households and agricultural. Industry overview Valuation Risk Analysis Conclusion Company overview Financial Profile Source: Power for All, MoP
  • 24.
    Industry overview Valuation Risk AnalysisConclusion Company overview Financial Profile 59.0% 7.0% 4.0% 10.0% ESTIMATED SECTOR- WISE COAL CONSUMPTION IN INDIA(2016- 2017) ELECTRICITY IRON & STEEL CEMENT OTHERS NON- ELECTRICITY BHEL vs POWER SECTOR  The Coal Sector is Burdened with Taxes such as payment for District Mineral Foundation (DMF), payment of National Mineral Exploration (NMET), both as a percentage of Royalty, and Clean Energy Cess that has been Increased to INR 400 per tonne for 2016-17  State-owned CIL's 66 projects are facing delays due to reasons including land acquisition problem as well as rehabilitation and resettlement issues  Loss of Rs. 1.85 Lakh cr. Estimated by CAG (Comptroller and Auditor General) in coal allocation Source :www.dnaindia.com/money/report-coal-india-s-66-coal-mine-projects-facing-delays Source: .pwc.in/icc-coal-report
  • 25.
    Order Back Log UnsoundFinancial Position Decreasing Operational Efficiency SELL CONCLUSION Industry overview Valuation Risk Analysis Conclusion Company overview Financial Profile

Editor's Notes

  • #4 Generation – Utility** 896 BU (2015-16) *Coal & Lignite Gas & CCP, Diesel, Nuclear & Hydro
  • #16 ROC: Denominator = tangible capital employed. Objective is to find out how much capital is actually needed for the company to conducts it's business.Numerator = EBIT allows to view and compare operating earnings of different companies without the distortions arising from differences in Tax rates and debt levels. Earnings Yield : 1) to find out how much a business earns relative to the purchase price of the business. Unlike P/E (or E/P) ,EBIT/EV is not greatly influenced by the debt levels and tax rates.