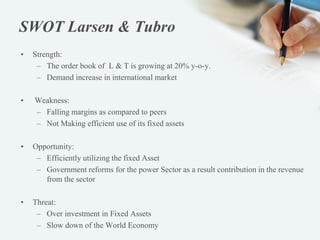
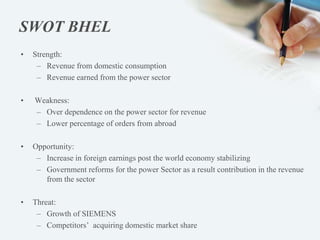
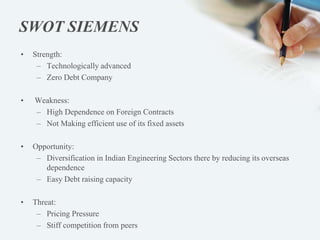
Sector Analysis
Capital Goods Sector: Larsen & Tubro, BHEL, Siemens
Global Economic Condition
• World economy continues to face challenges
• Advanced economies have lost steam
• The growth momentum was impacted
• Shift of economic powers
• Global growth may continue to be low in 2012
Indian Economic Condition
• After a rebound in growth, the Indian economy slowed down to 6.5%
• Indian economy impacted with global uncertainties along with domestic
challenges
• The slowdown in 2011-12 was seen in all major sectors
– Service Sector : 8.9% 9.3% in 2010-11
– Industrial Sector: 3.4% 7.2% in 2010-11
– Agricultural Sector: 2.8% 7% in 2010-11
• Slow down in capital addition which reduced to 5.5% as compared to 7.5%
achieved in 2010-11
Business Scenario
• Core sectors of the country which are of key importance to the Capital
Goods Industry face multiple challenges
• Product business of the sector recorded moderate sales during 2011-12.
• 2012-13 holds prospects of gradual build up in the growth momentum of the
Indian economy
• Infrastructure development assumes prominence in government budget
proposal for the year 2012-13
• Infrastructure development and capacity expansion in oil and gas sector is
expected to attract fresh investments in the Middle East
Larsen & Tubro
• Larsen & Tubro, or L&T, is an Indian Multinational conglomerate
• Business Interests:
– Engineering
– Construction
– Manufacturing
– Information technology
– Financial services
• India’s Largest Engineering and Construction company
• International projects contributed 9% of its overall order book for the
2010-11
Bharat Heavy Electricals Limited
• Largest Engineering and Manufacturing enterprise in India in the energy
related/Infrastructure sector
• Business Interests:
– Power Generation & Transmission
– Transportation
– Telecommunication
– Renewable Energy
• 59% in India's total installed power generating capacity
• BHEL have been exporting their power and industry segment products and
services for approximately 40 years
Siemens
• Siemens in India has emerged as a leading inventor, innovator and
implementer of leading-edge technology
• Business Interests:
– Building Technologies (BT)
– Drive Technologies (DT)
– Industry Automation (IA)
• Siemens plays a key role in India’s quest for developing modern
infrastructure
Company Analysis: L&T
3,789.46
5,452.09
4,463.66
59.5 73.77
65.33
0
10
20
30
40
50
60
70
80
0.00
1,000.00
2,000.00
3,000.00
4,000.00
5,000.00
6,000.00
2008-09 2009-10 2010-11
PAT and Basic EPS
Profit After Tax EPS
7017.5
8963.5
10641
4.85
4.13
4.09
3.60
3.80
4.00
4.20
4.40
4.60
4.80
5.00
0
2000
4000
6000
8000
10000
12000
2008-09 2009-10 2010-11
Fixed Asset Turnover Ratio
Avg Net Fixed Asset Fixed Asset Turnover Ratio
35077
39381
45738
35.63
12.27 16.14
0.00
5.00
10.00
15.00
20.00
25.00
30.00
35.00
40.00
0
10000
20000
30000
40000
50000
2008-09 2009-10 2010-11
Gross Revenue From
Operations
Operating Profit Percentage growth
Company Analysis: BHEL
3,115.17
4,326.92
6,053.36
63.64
88.39
123.66
0
20
40
60
80
100
120
140
0.00
1,000.00
2,000.00
3,000.00
4,000.00
5,000.00
6,000.00
7,000.00
Mar/09 Mar/10 Mar/11
PAT and BASIC EPS
Pat EpS (Rs)
1,706.03
2,623.03
3,609.88
5.23
5.09
5.11
5
5.05
5.1
5.15
5.2
5.25
0.00
500.00
1,000.00
1,500.00
2,000.00
2,500.00
3,000.00
3,500.00
4,000.00
Mar/09 Mar/10 Mar/11
Fixed Asset Turnover Ratio
Net FA FA Turnover
9,668.43
7,117.70
5,216.03
35.84
36.46
9.51
0.00
10.00
20.00
30.00
40.00
0.00
2,000.00
4,000.00
6,000.00
8,000.00
10,000.00
12,000.00
Mar 10
Gross Revenue from
Operations
Operating Profit Percentage Growth
Mar 11 Mar 09
Company Analysis: Siemens
1044.85
827.21 845.42
30.14
23.7
23.87
0
5
10
15
20
25
30
35
0
200
400
600
800
1000
1200
2008-2009 2009-2010 2010-2011
PAT and BASIC EPS
PAT Basic EPS
1525.29
1379.09
1453.6
157.84
90.41
105.40
0.00
50.00
100.00
150.00
200.00
1300
1350
1400
1450
1500
1550
2008-2009 2009-2010 2010-2011
Gross Revenue From
Operations
Operating Profit Percentage growth
629.5
733.99
1169.4114.14
13.66
12.55
11.50
12.00
12.50
13.00
13.50
14.00
14.50
0
200
400
600
800
1000
1200
1400
2008-2009 2009-2010 2010-2011
Fixed Asset Turnover Ratio
Net Fixed Assets Fixed Asset Turnover Ratio
Peer Comparison
10641
3116.46
951.74.09
13.56
12.55
0.00
2.00
4.00
6.00
8.00
10.00
12.00
14.00
16.00
0
2000
4000
6000
8000
10000
12000
L&T BHEL SIEMENS
Fixed Asset Turnover Ratio
Avg Net Fixed Asset Fixed Asset Turnover Ratio
20.10
33.30
22.40
0.00
5.00
10.00
15.00
20.00
25.00
30.00
35.00
Larsen & Turbo BHEL Siemens
GrowthPercentage
Return On Net Worth
4.4 4.09
15
0
2
4
6
8
10
12
14
16
18
Larsen & Turbo BHEL Siemens
Rs.InCrore
Inventory Turnover Ratio
4,463.66
6,053.36
845.42
65.33
118.5
23.87
0
20
40
60
80
100
120
140
0.00
1,000.00
2,000.00
3,000.00
4,000.00
5,000.00
6,000.00
7,000.00
L&T BHEL SIEMENS
PAT and Basic EPS for
2010-11
PAT EPS
Peer Comparison
24.60
49.80
31.26
0.00
10.00
20.00
30.00
40.00
50.00
60.00
Larsen & Turbo BHEL Siemens
Percentage
Return On Capital Employed
53,699.16
43,382.37
12279.1
82%
78%
88%
72%
74%
76%
78%
80%
82%
84%
86%
88%
90%
0.00
10,000.00
20,000.00
30,000.00
40,000.00
50,000.00
60,000.00
L&T BHEL SIEMENS
Net Operations Margin
Operating Revenue Operating expenses ratio(%)
SWOT Larsen & Tubro
• Strength:
– The order book of L & T is growing at 20% y-o-y.
– Demand increase in international market
• Weakness:
– Falling margins as compared to peers
– Not Making efficient use of its fixed assets
• Opportunity:
– Efficiently utilizing the fixed Asset
– Government reforms for the power Sector as a result contribution in the revenue
from the sector
• Threat:
– Over investment in Fixed Assets
– Slow down of the World Economy
SWOT BHEL
• Strength:
– Revenue from domestic consumption
– Revenue earned from the power sector
• Weakness:
– Over dependence on the power sector for revenue
– Lower percentage of orders from abroad
• Opportunity:
– Increase in foreign earnings post the world economy stabilizing
– Government reforms for the power Sector as a result contribution in the revenue
from the sector
• Threat:
– Growth of SIEMENS
– Competitors’ acquiring domestic market share
SWOT SIEMENS
• Strength:
– Technologically advanced
– Zero Debt Company
• Weakness:
– High Dependence on Foreign Contracts
– Not Making efficient use of its fixed assets
• Opportunity:
– Diversification in Indian Engineering Sectors there by reducing its overseas
dependence
– Easy Debt raising capacity
• Threat:
– Pricing Pressure
– Stiff competition from peers
Thank You!

Sector Analysis - Capital Goods Sector

  • 1.
    Sector Analysis Capital GoodsSector: Larsen & Tubro, BHEL, Siemens
  • 2.
    Global Economic Condition •World economy continues to face challenges • Advanced economies have lost steam • The growth momentum was impacted • Shift of economic powers • Global growth may continue to be low in 2012
  • 3.
    Indian Economic Condition •After a rebound in growth, the Indian economy slowed down to 6.5% • Indian economy impacted with global uncertainties along with domestic challenges • The slowdown in 2011-12 was seen in all major sectors – Service Sector : 8.9% 9.3% in 2010-11 – Industrial Sector: 3.4% 7.2% in 2010-11 – Agricultural Sector: 2.8% 7% in 2010-11 • Slow down in capital addition which reduced to 5.5% as compared to 7.5% achieved in 2010-11
  • 4.
    Business Scenario • Coresectors of the country which are of key importance to the Capital Goods Industry face multiple challenges • Product business of the sector recorded moderate sales during 2011-12. • 2012-13 holds prospects of gradual build up in the growth momentum of the Indian economy • Infrastructure development assumes prominence in government budget proposal for the year 2012-13 • Infrastructure development and capacity expansion in oil and gas sector is expected to attract fresh investments in the Middle East
  • 5.
    Larsen & Tubro •Larsen & Tubro, or L&T, is an Indian Multinational conglomerate • Business Interests: – Engineering – Construction – Manufacturing – Information technology – Financial services • India’s Largest Engineering and Construction company • International projects contributed 9% of its overall order book for the 2010-11
  • 6.
    Bharat Heavy ElectricalsLimited • Largest Engineering and Manufacturing enterprise in India in the energy related/Infrastructure sector • Business Interests: – Power Generation & Transmission – Transportation – Telecommunication – Renewable Energy • 59% in India's total installed power generating capacity • BHEL have been exporting their power and industry segment products and services for approximately 40 years
  • 7.
    Siemens • Siemens inIndia has emerged as a leading inventor, innovator and implementer of leading-edge technology • Business Interests: – Building Technologies (BT) – Drive Technologies (DT) – Industry Automation (IA) • Siemens plays a key role in India’s quest for developing modern infrastructure
  • 8.
    Company Analysis: L&T 3,789.46 5,452.09 4,463.66 59.573.77 65.33 0 10 20 30 40 50 60 70 80 0.00 1,000.00 2,000.00 3,000.00 4,000.00 5,000.00 6,000.00 2008-09 2009-10 2010-11 PAT and Basic EPS Profit After Tax EPS 7017.5 8963.5 10641 4.85 4.13 4.09 3.60 3.80 4.00 4.20 4.40 4.60 4.80 5.00 0 2000 4000 6000 8000 10000 12000 2008-09 2009-10 2010-11 Fixed Asset Turnover Ratio Avg Net Fixed Asset Fixed Asset Turnover Ratio 35077 39381 45738 35.63 12.27 16.14 0.00 5.00 10.00 15.00 20.00 25.00 30.00 35.00 40.00 0 10000 20000 30000 40000 50000 2008-09 2009-10 2010-11 Gross Revenue From Operations Operating Profit Percentage growth
  • 9.
    Company Analysis: BHEL 3,115.17 4,326.92 6,053.36 63.64 88.39 123.66 0 20 40 60 80 100 120 140 0.00 1,000.00 2,000.00 3,000.00 4,000.00 5,000.00 6,000.00 7,000.00 Mar/09Mar/10 Mar/11 PAT and BASIC EPS Pat EpS (Rs) 1,706.03 2,623.03 3,609.88 5.23 5.09 5.11 5 5.05 5.1 5.15 5.2 5.25 0.00 500.00 1,000.00 1,500.00 2,000.00 2,500.00 3,000.00 3,500.00 4,000.00 Mar/09 Mar/10 Mar/11 Fixed Asset Turnover Ratio Net FA FA Turnover 9,668.43 7,117.70 5,216.03 35.84 36.46 9.51 0.00 10.00 20.00 30.00 40.00 0.00 2,000.00 4,000.00 6,000.00 8,000.00 10,000.00 12,000.00 Mar 10 Gross Revenue from Operations Operating Profit Percentage Growth Mar 11 Mar 09
  • 10.
    Company Analysis: Siemens 1044.85 827.21845.42 30.14 23.7 23.87 0 5 10 15 20 25 30 35 0 200 400 600 800 1000 1200 2008-2009 2009-2010 2010-2011 PAT and BASIC EPS PAT Basic EPS 1525.29 1379.09 1453.6 157.84 90.41 105.40 0.00 50.00 100.00 150.00 200.00 1300 1350 1400 1450 1500 1550 2008-2009 2009-2010 2010-2011 Gross Revenue From Operations Operating Profit Percentage growth 629.5 733.99 1169.4114.14 13.66 12.55 11.50 12.00 12.50 13.00 13.50 14.00 14.50 0 200 400 600 800 1000 1200 1400 2008-2009 2009-2010 2010-2011 Fixed Asset Turnover Ratio Net Fixed Assets Fixed Asset Turnover Ratio
  • 11.
    Peer Comparison 10641 3116.46 951.74.09 13.56 12.55 0.00 2.00 4.00 6.00 8.00 10.00 12.00 14.00 16.00 0 2000 4000 6000 8000 10000 12000 L&T BHELSIEMENS Fixed Asset Turnover Ratio Avg Net Fixed Asset Fixed Asset Turnover Ratio 20.10 33.30 22.40 0.00 5.00 10.00 15.00 20.00 25.00 30.00 35.00 Larsen & Turbo BHEL Siemens GrowthPercentage Return On Net Worth 4.4 4.09 15 0 2 4 6 8 10 12 14 16 18 Larsen & Turbo BHEL Siemens Rs.InCrore Inventory Turnover Ratio 4,463.66 6,053.36 845.42 65.33 118.5 23.87 0 20 40 60 80 100 120 140 0.00 1,000.00 2,000.00 3,000.00 4,000.00 5,000.00 6,000.00 7,000.00 L&T BHEL SIEMENS PAT and Basic EPS for 2010-11 PAT EPS
  • 12.
    Peer Comparison 24.60 49.80 31.26 0.00 10.00 20.00 30.00 40.00 50.00 60.00 Larsen &Turbo BHEL Siemens Percentage Return On Capital Employed 53,699.16 43,382.37 12279.1 82% 78% 88% 72% 74% 76% 78% 80% 82% 84% 86% 88% 90% 0.00 10,000.00 20,000.00 30,000.00 40,000.00 50,000.00 60,000.00 L&T BHEL SIEMENS Net Operations Margin Operating Revenue Operating expenses ratio(%)
  • 13.
    SWOT Larsen &Tubro • Strength: – The order book of L & T is growing at 20% y-o-y. – Demand increase in international market • Weakness: – Falling margins as compared to peers – Not Making efficient use of its fixed assets • Opportunity: – Efficiently utilizing the fixed Asset – Government reforms for the power Sector as a result contribution in the revenue from the sector • Threat: – Over investment in Fixed Assets – Slow down of the World Economy
  • 14.
    SWOT BHEL • Strength: –Revenue from domestic consumption – Revenue earned from the power sector • Weakness: – Over dependence on the power sector for revenue – Lower percentage of orders from abroad • Opportunity: – Increase in foreign earnings post the world economy stabilizing – Government reforms for the power Sector as a result contribution in the revenue from the sector • Threat: – Growth of SIEMENS – Competitors’ acquiring domestic market share
  • 15.
    SWOT SIEMENS • Strength: –Technologically advanced – Zero Debt Company • Weakness: – High Dependence on Foreign Contracts – Not Making efficient use of its fixed assets • Opportunity: – Diversification in Indian Engineering Sectors there by reducing its overseas dependence – Easy Debt raising capacity • Threat: – Pricing Pressure – Stiff competition from peers
  • 16.