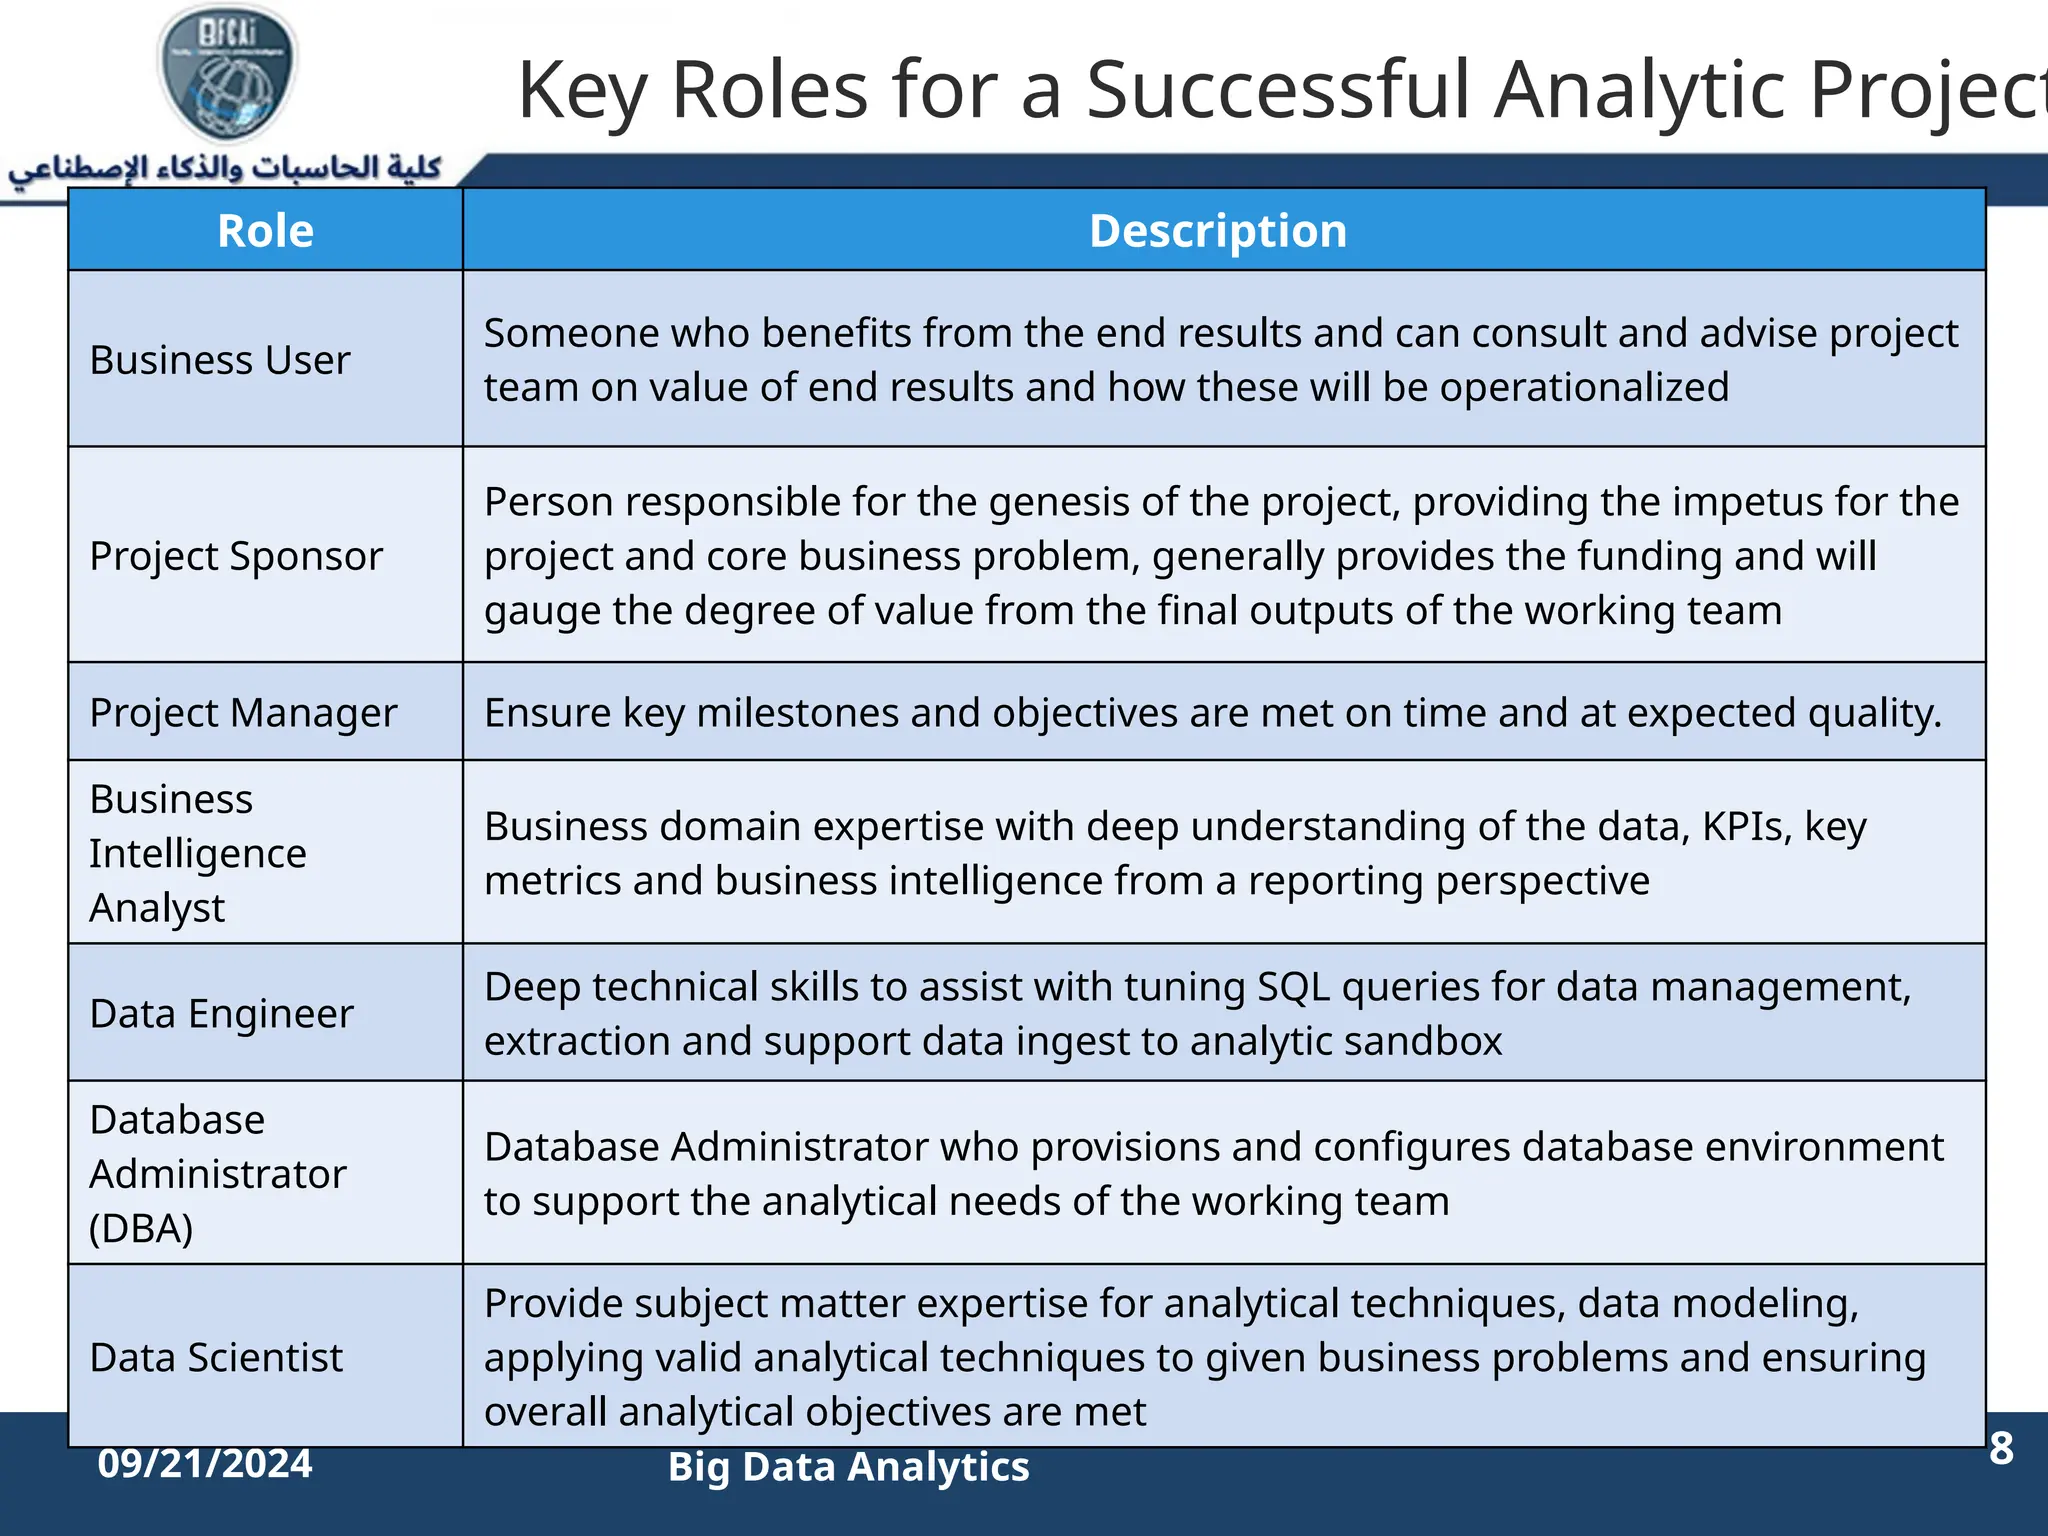
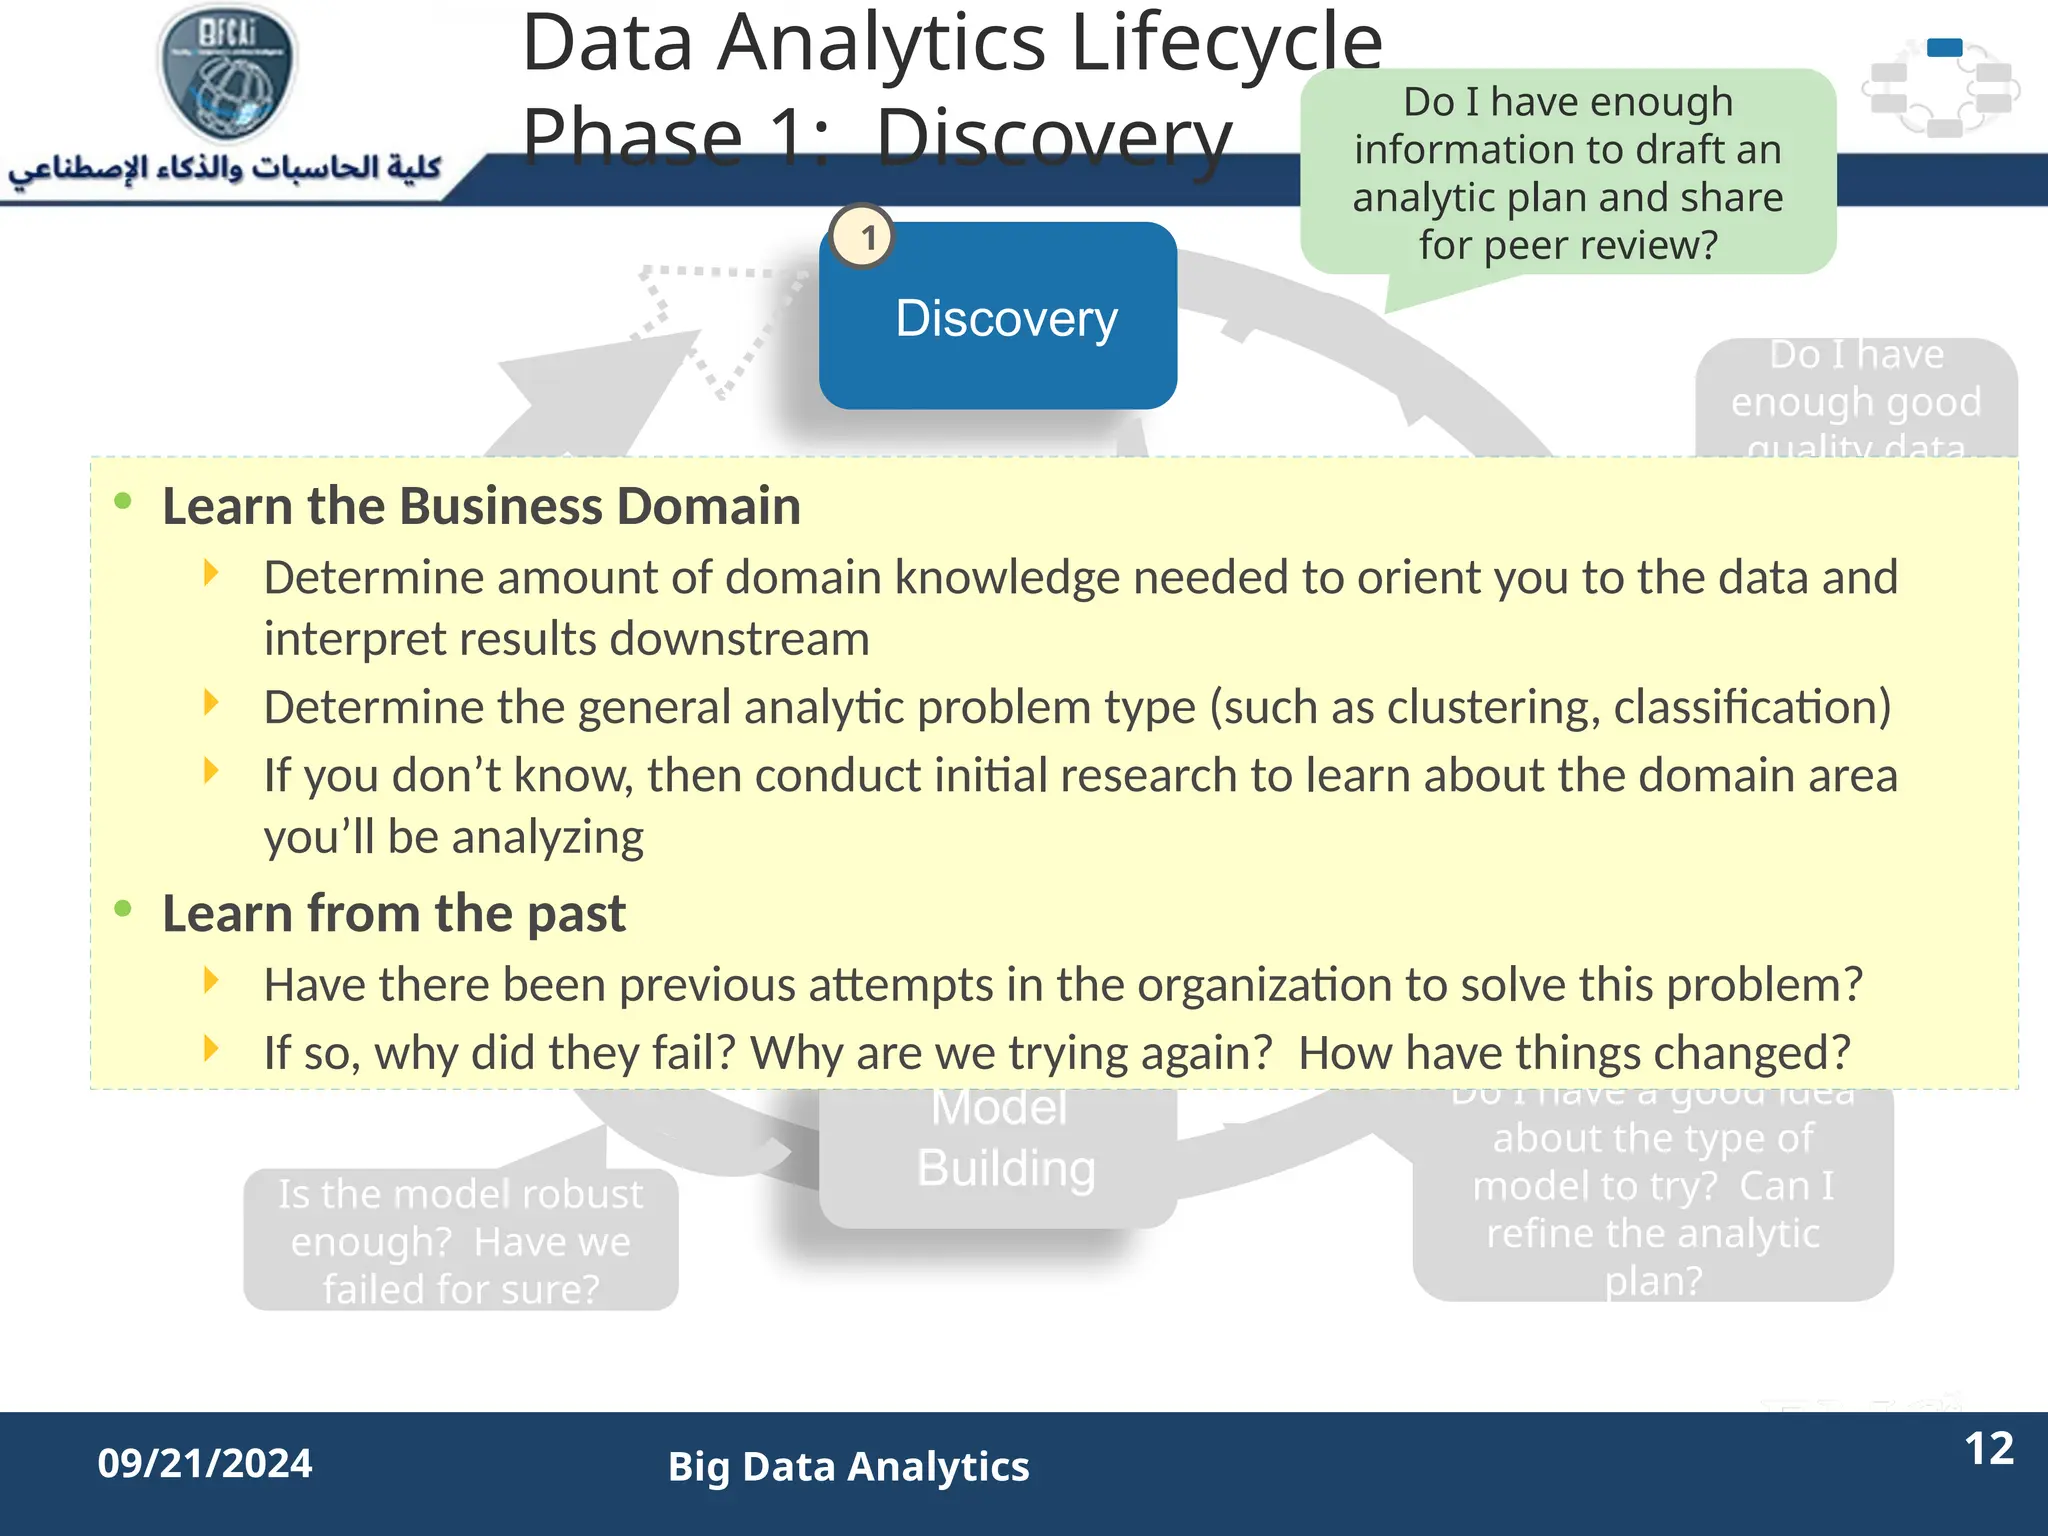
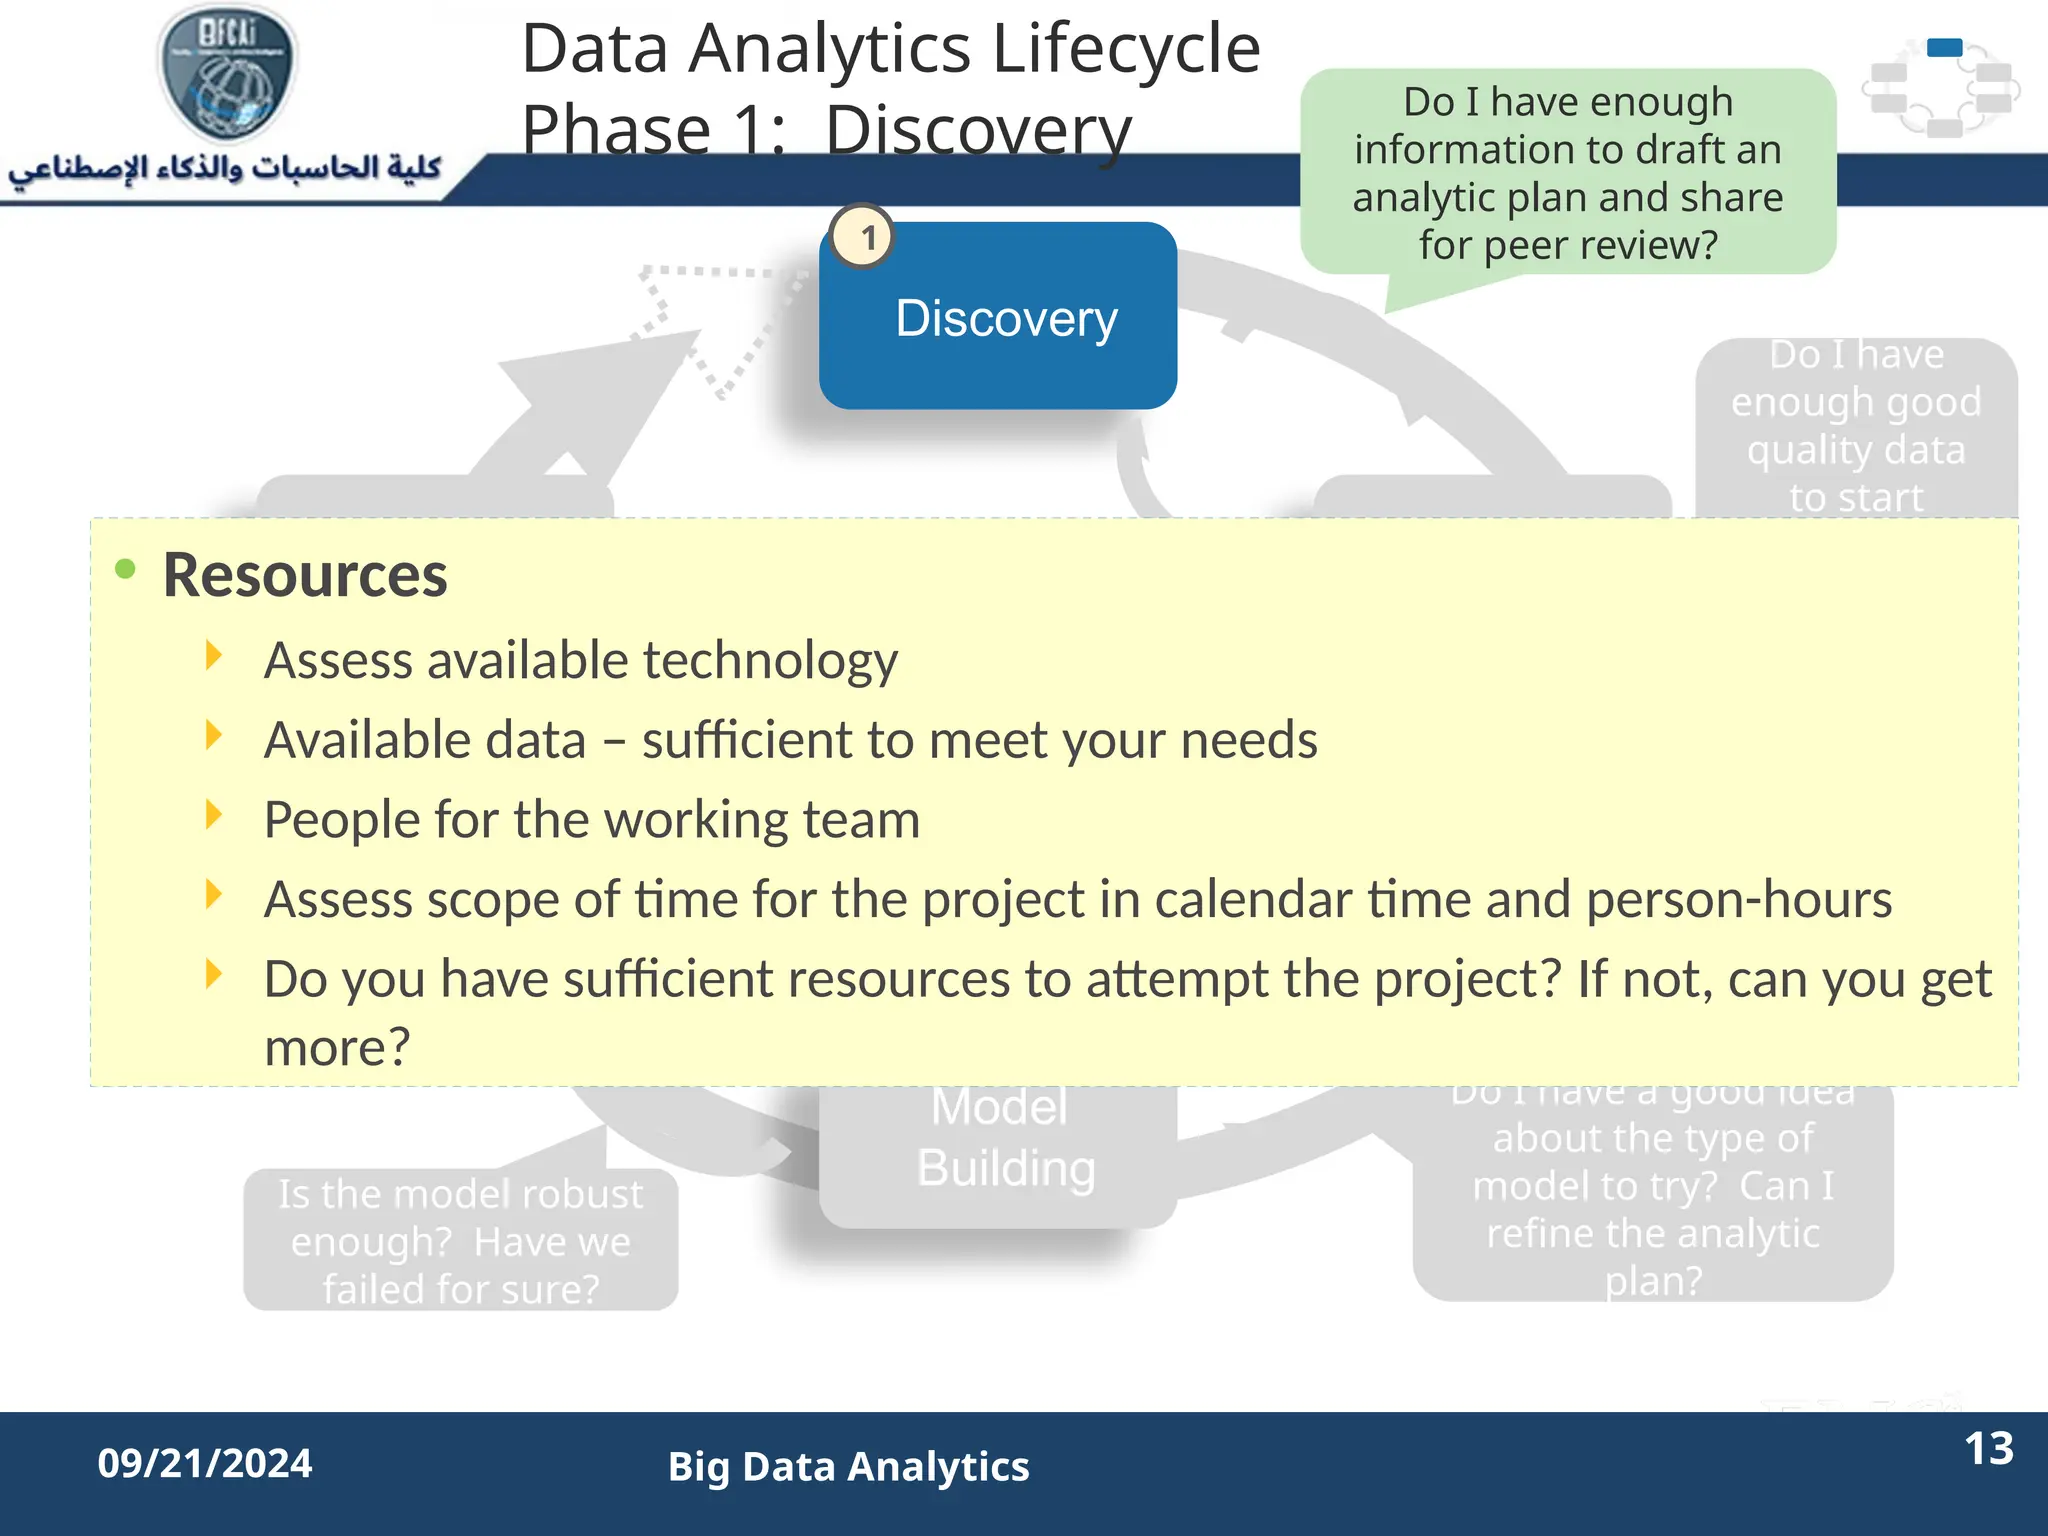
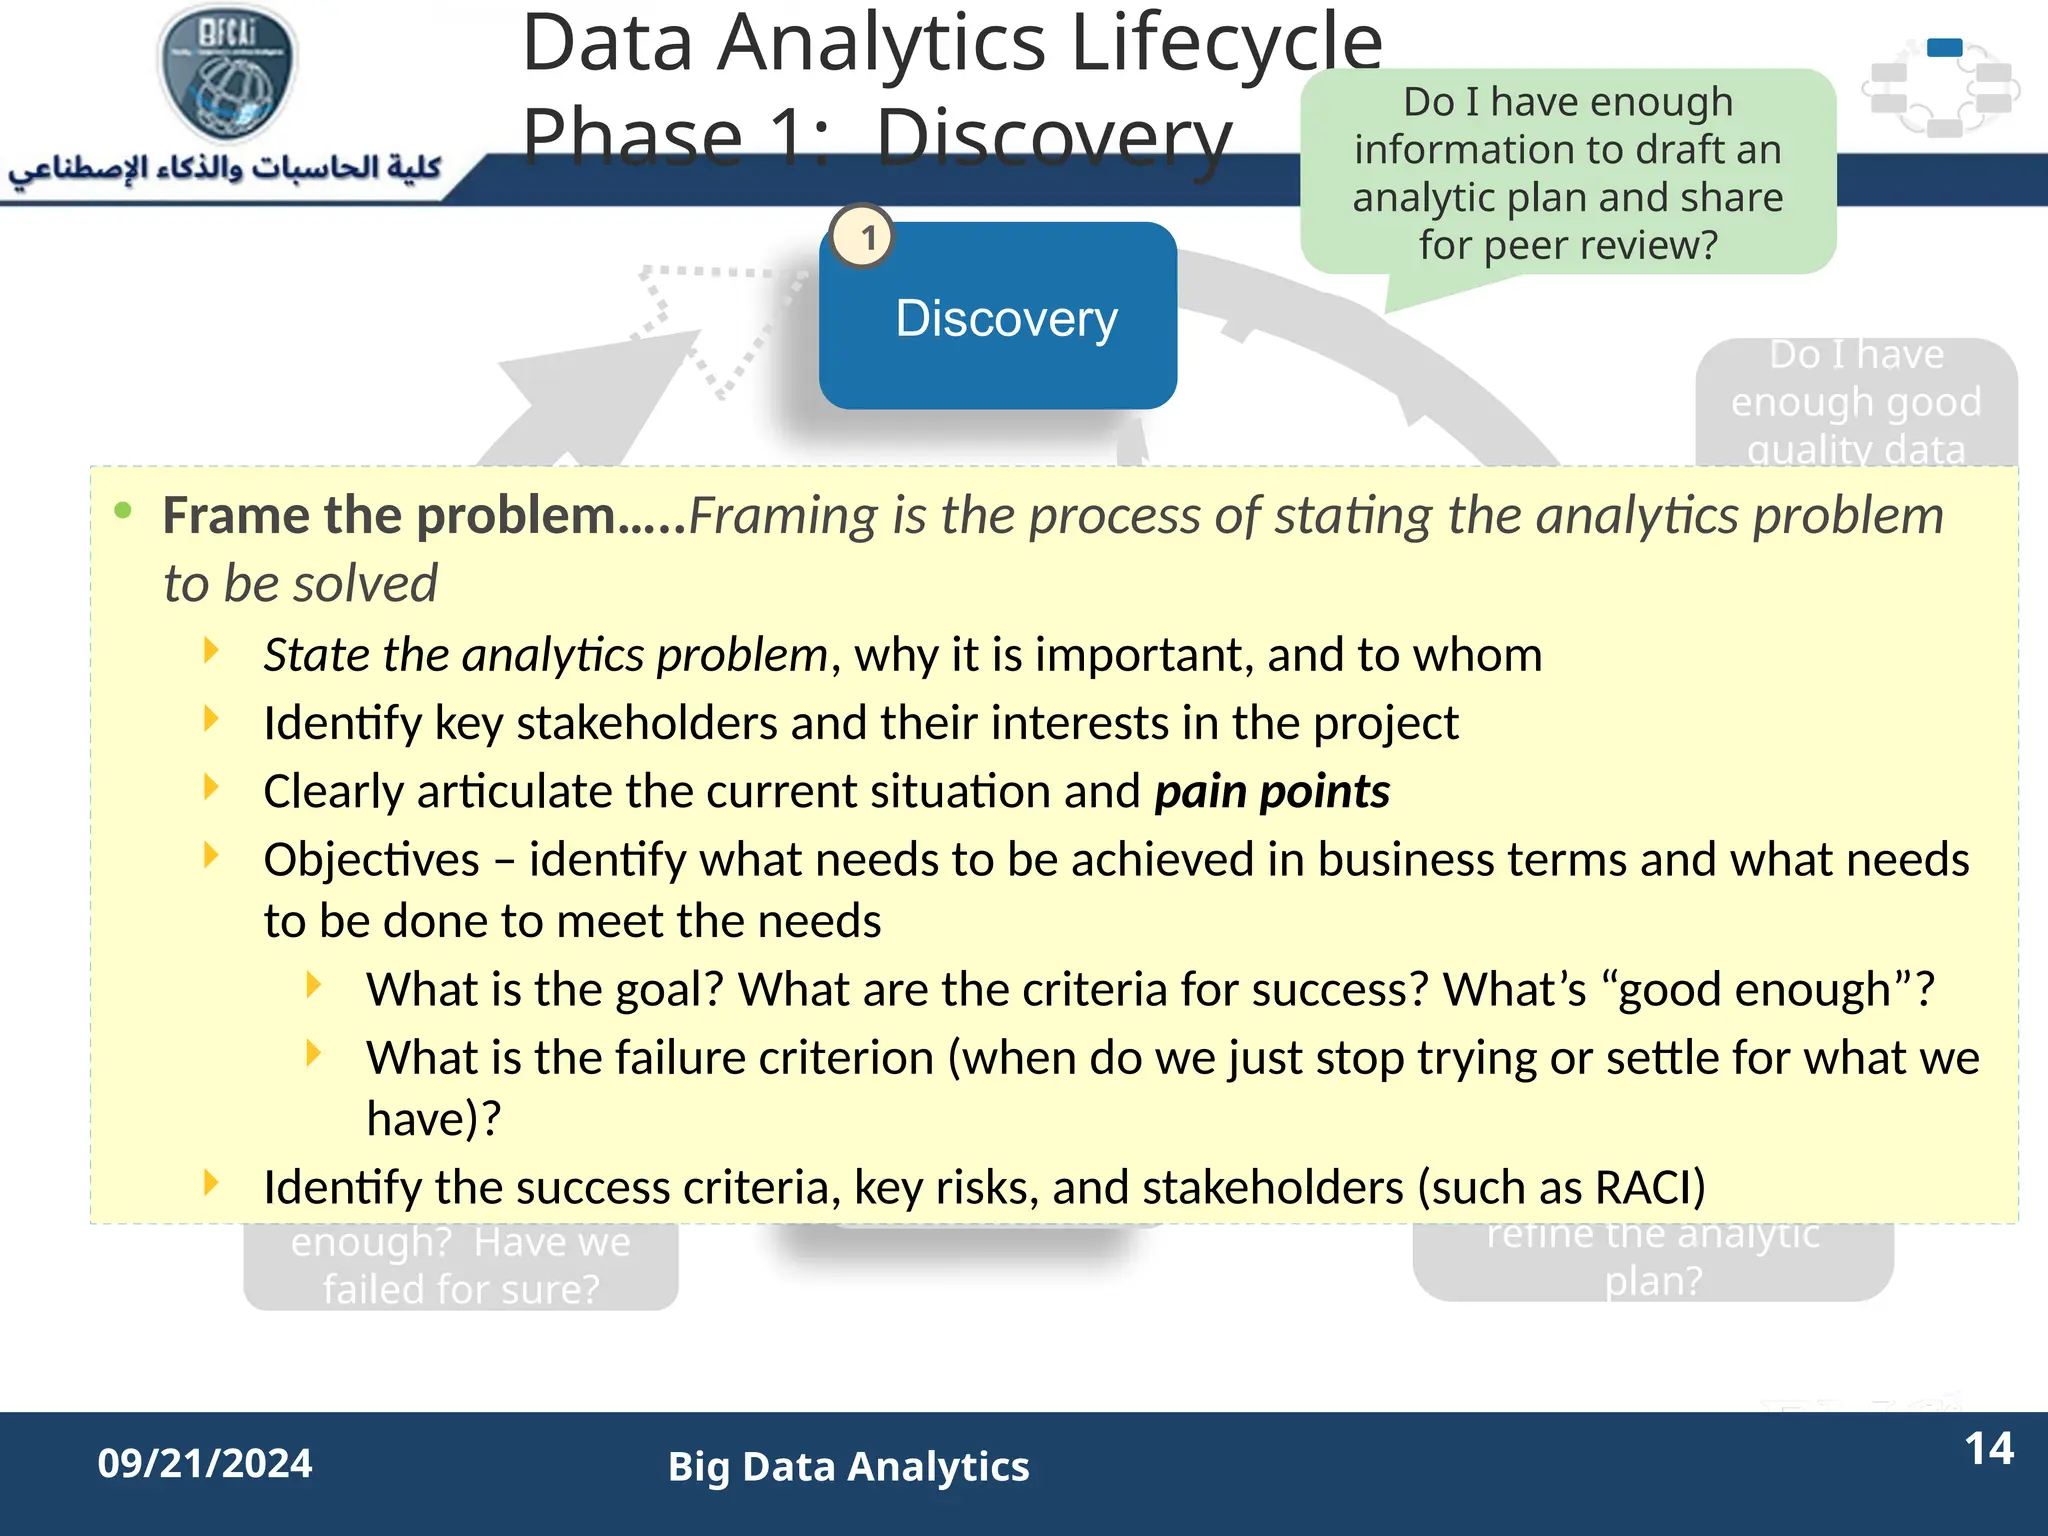
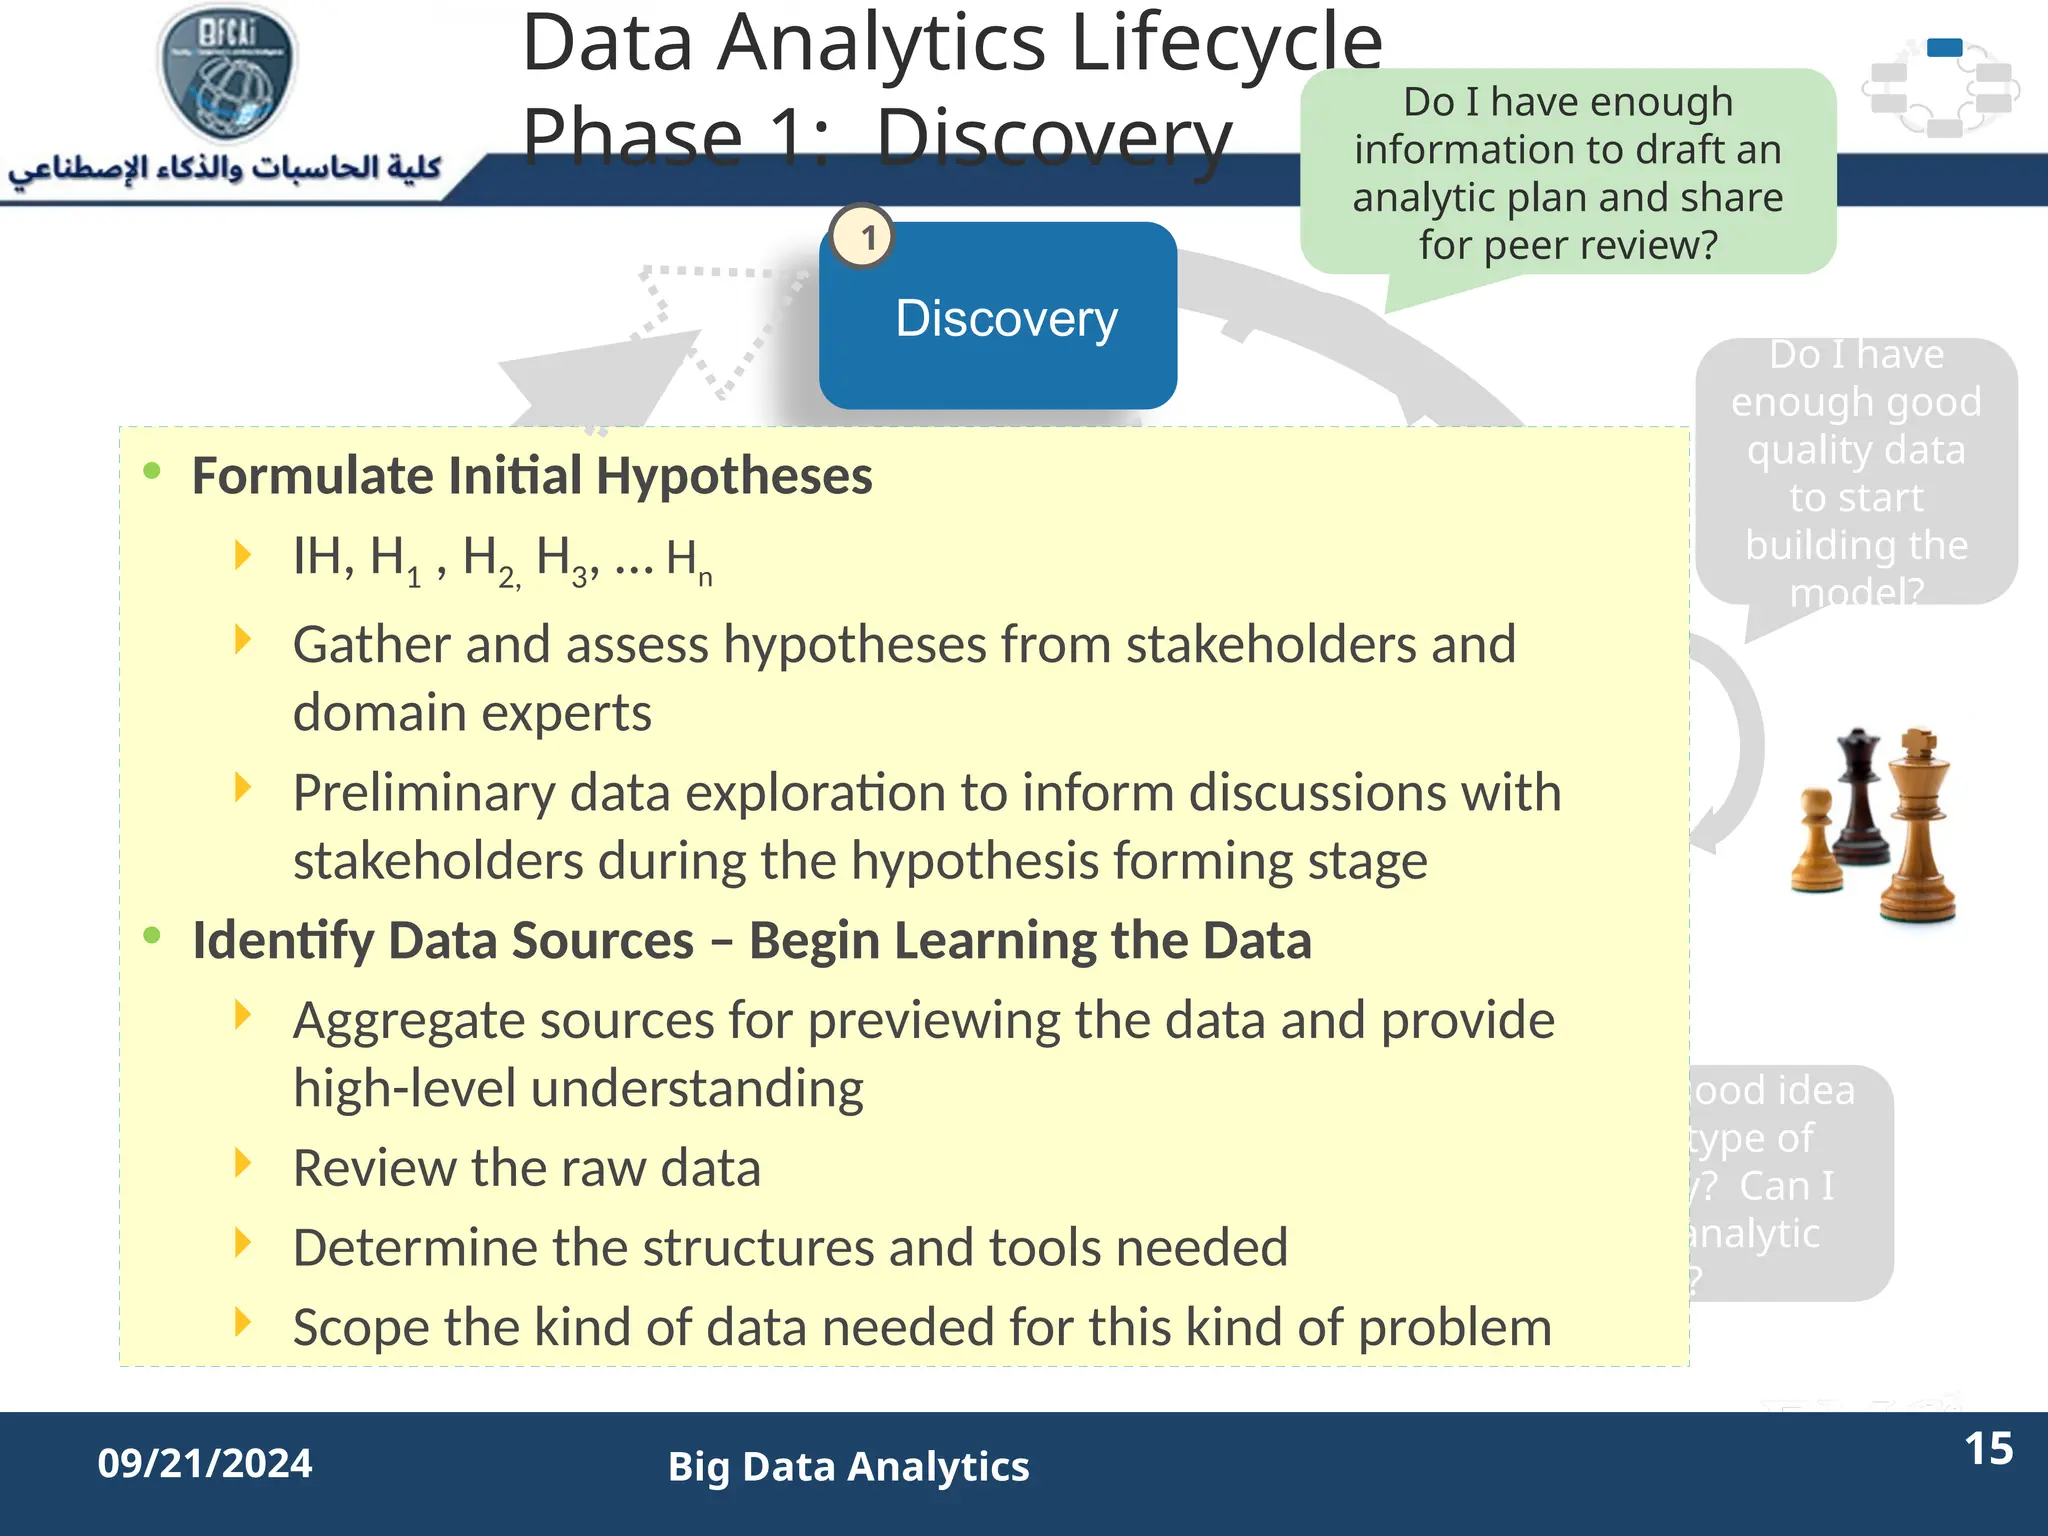
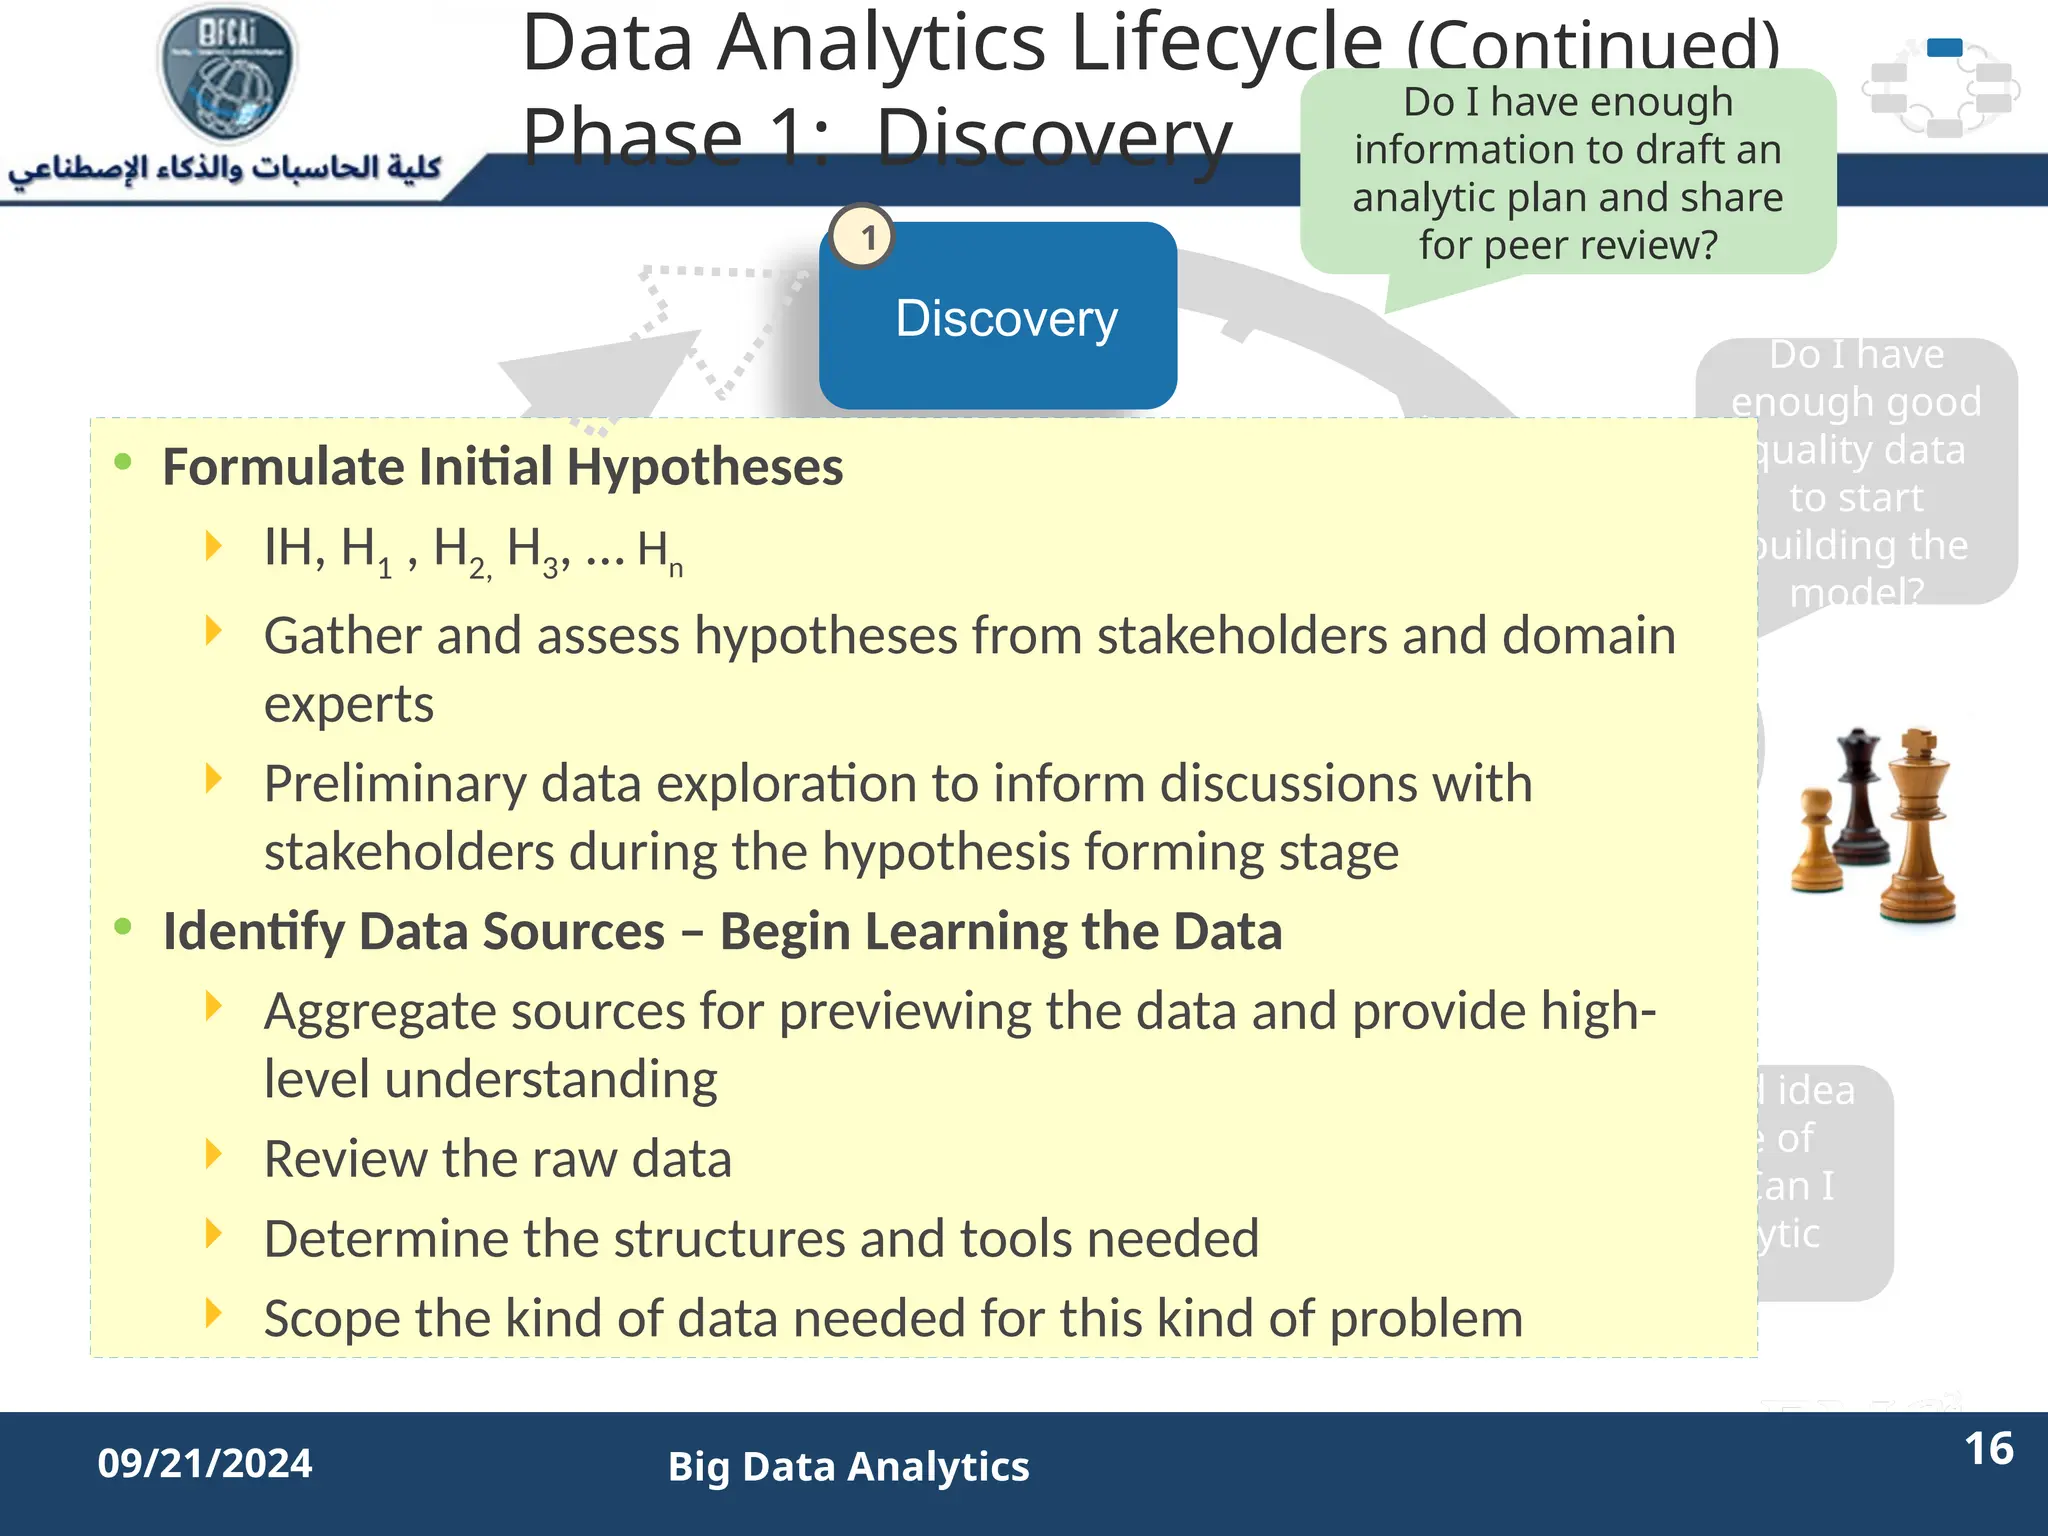
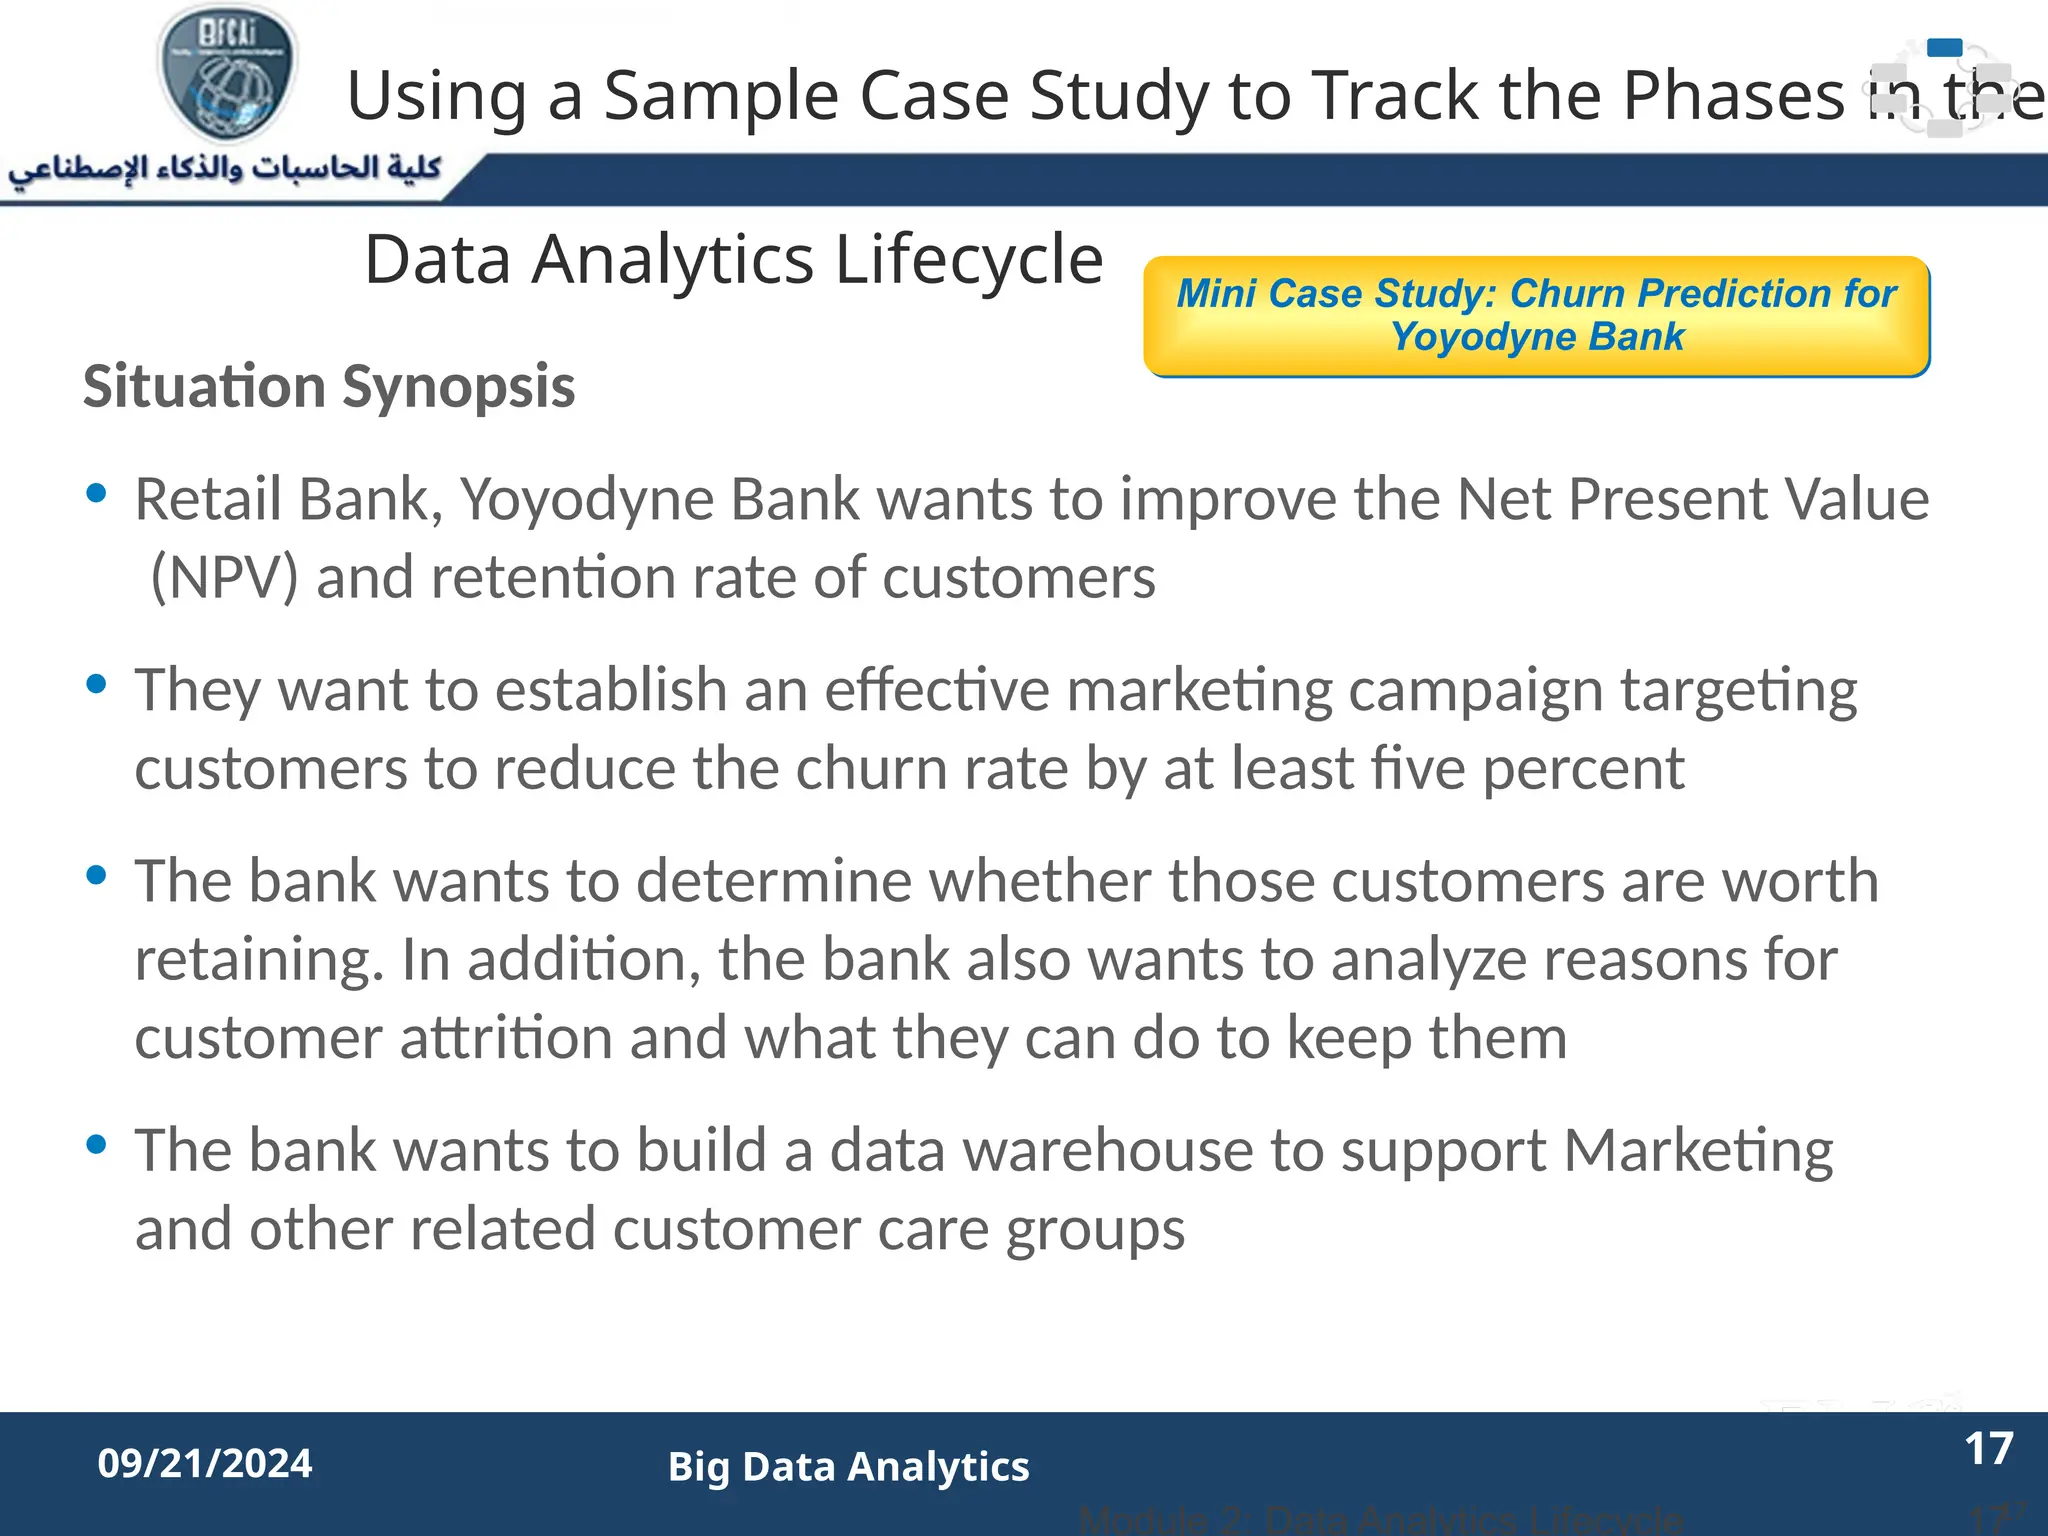
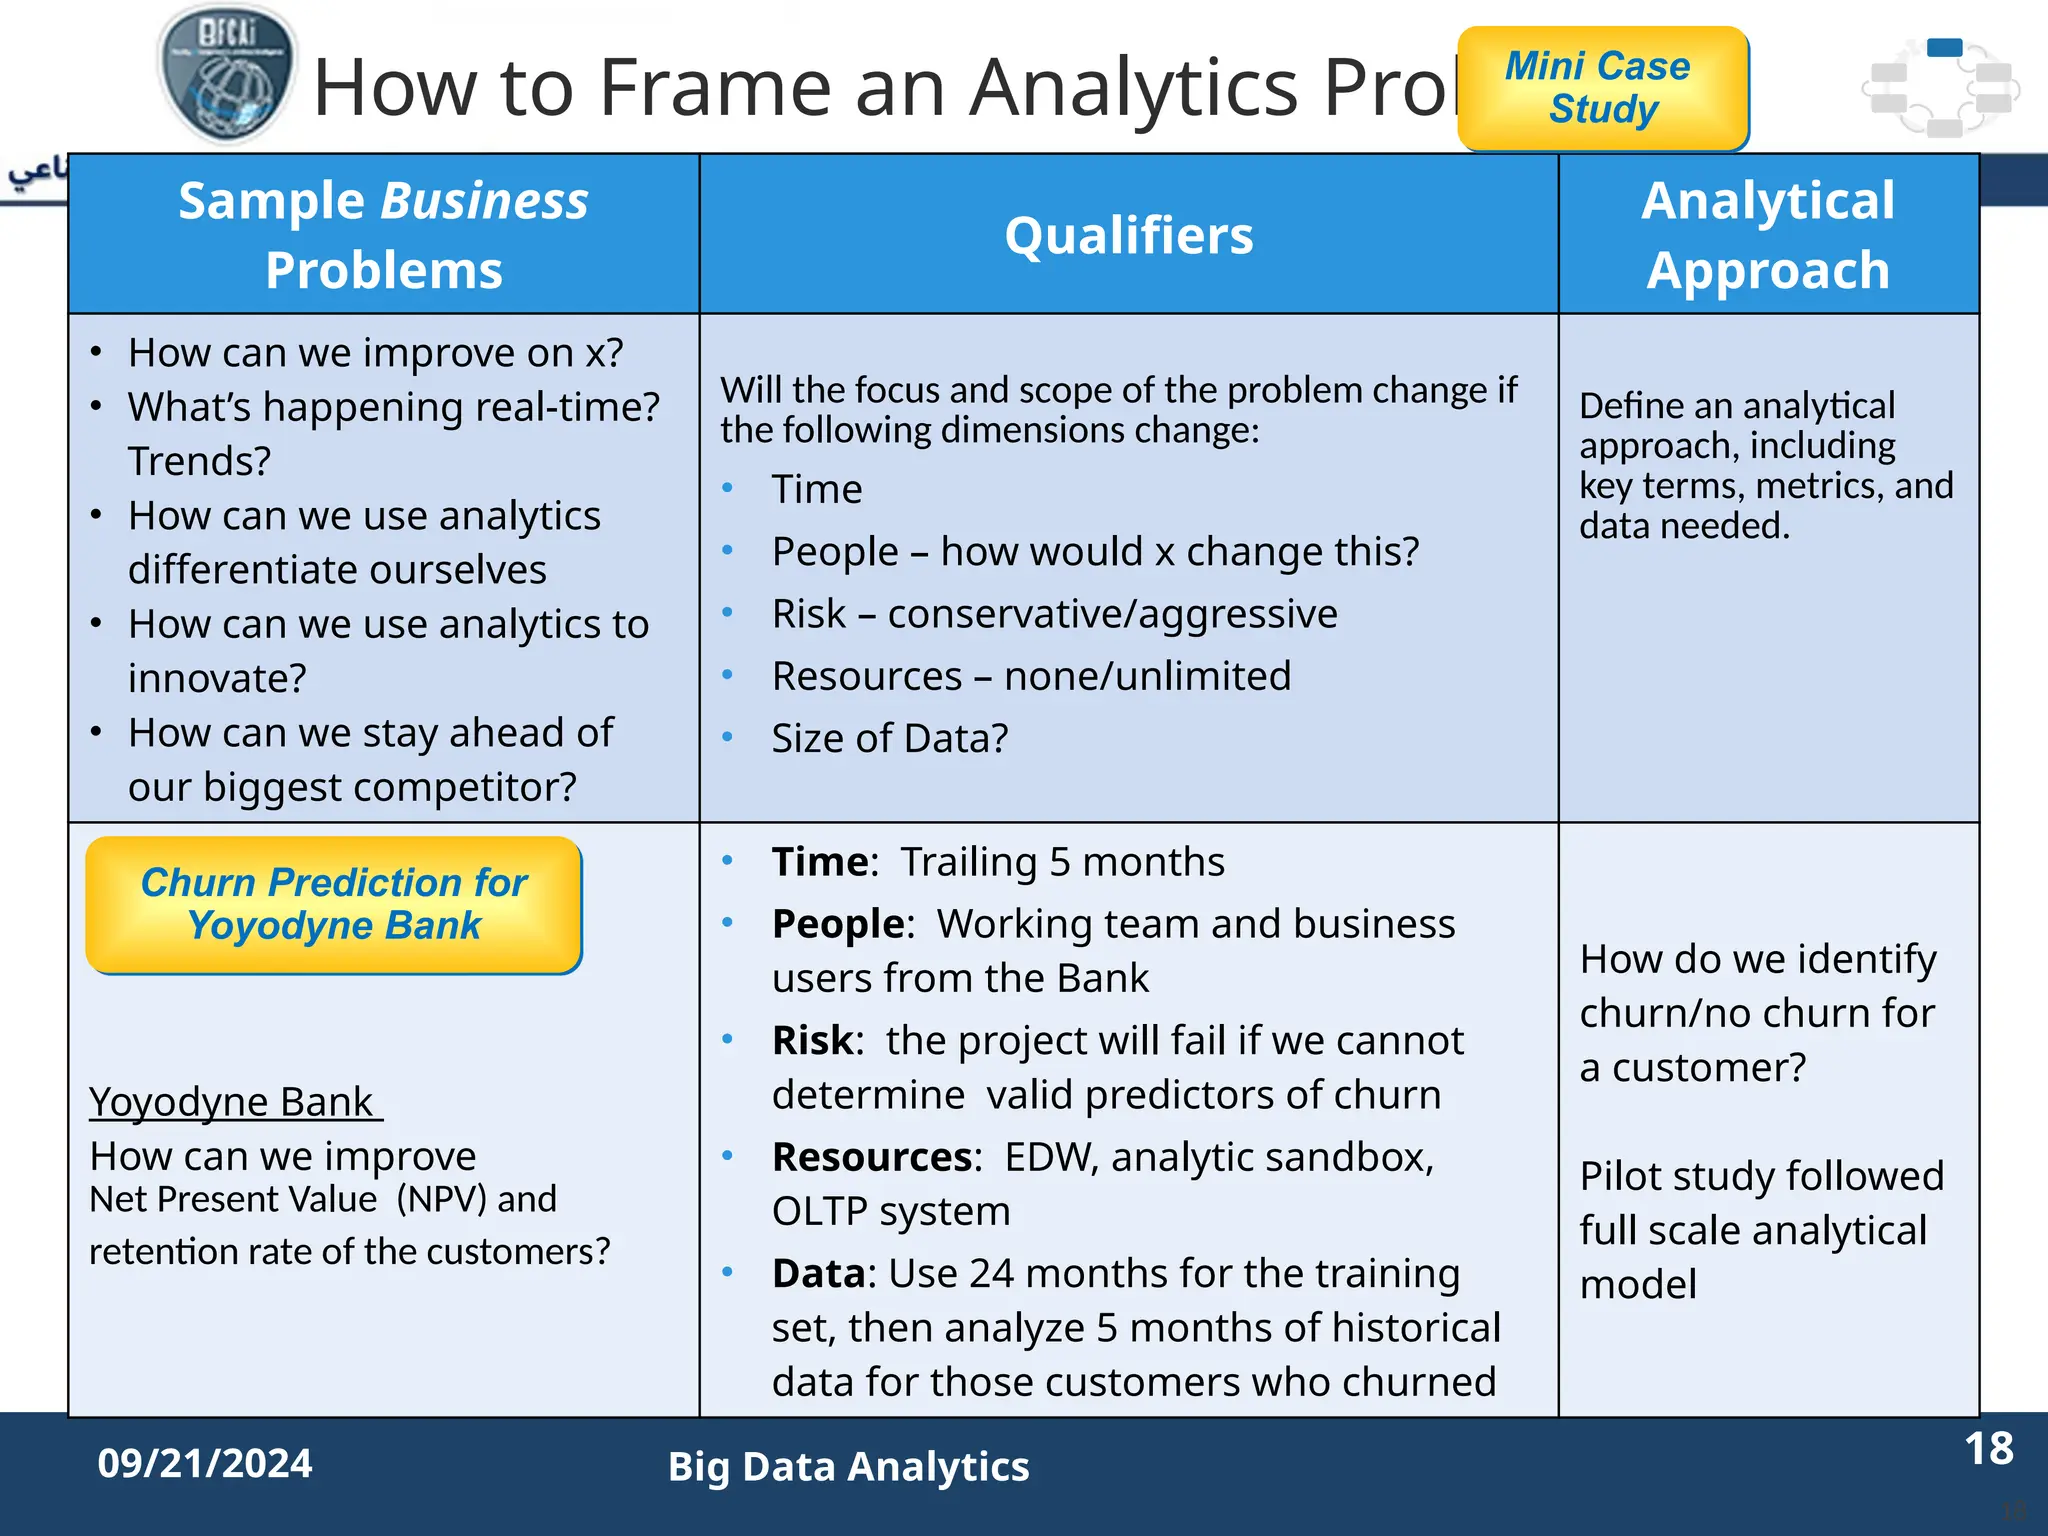
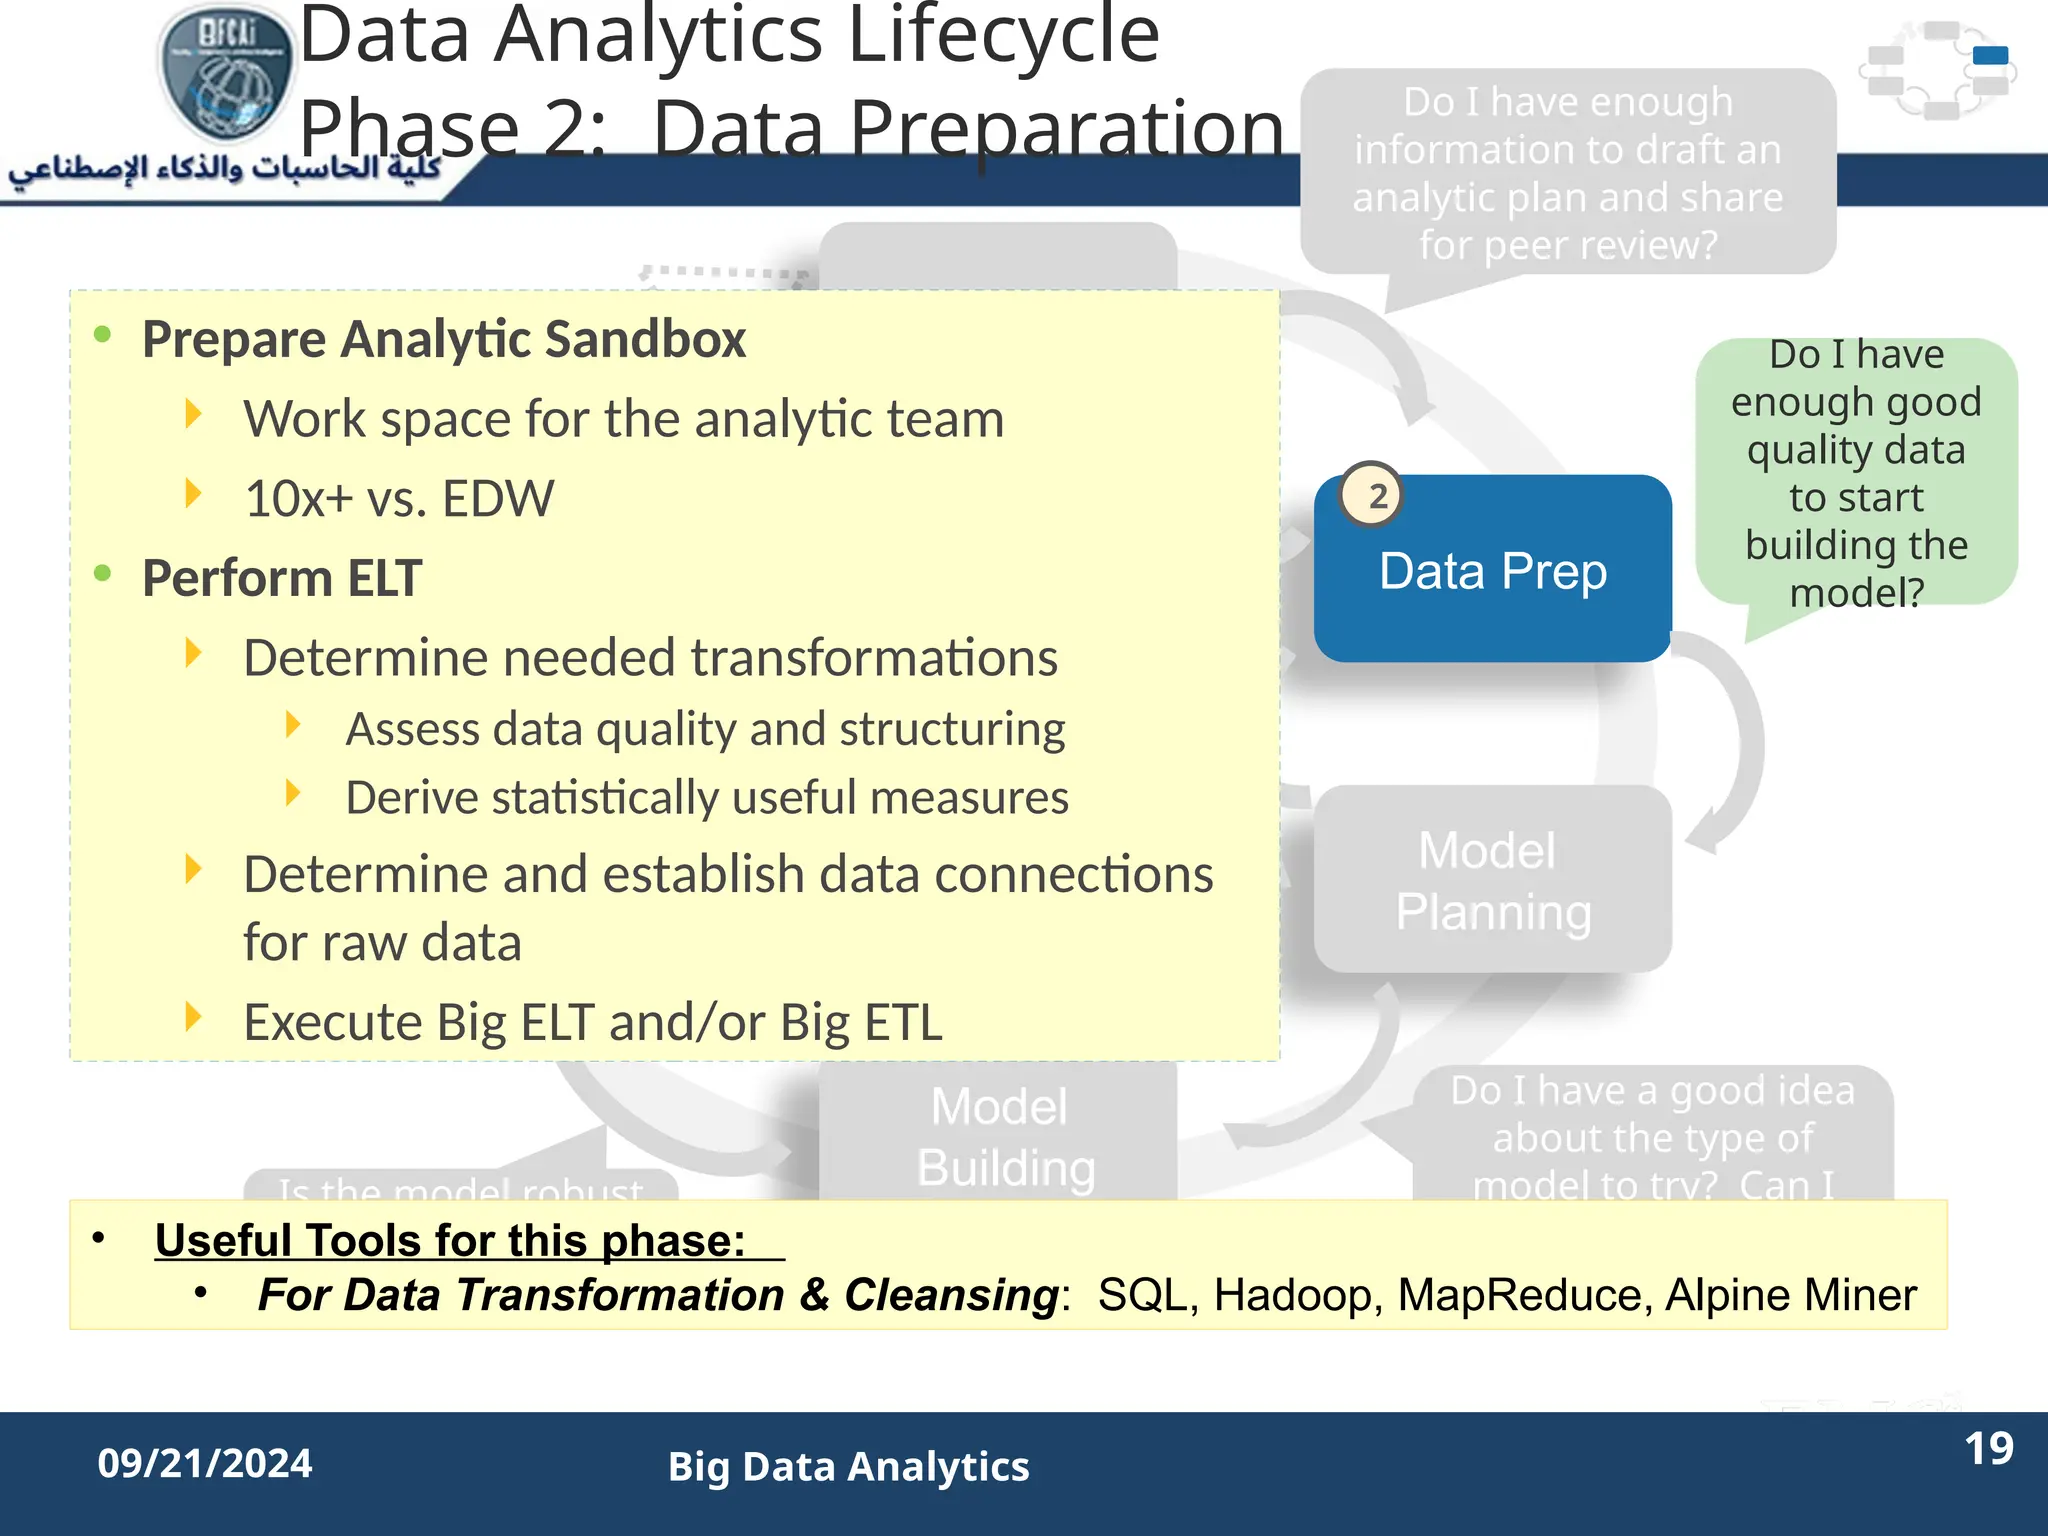
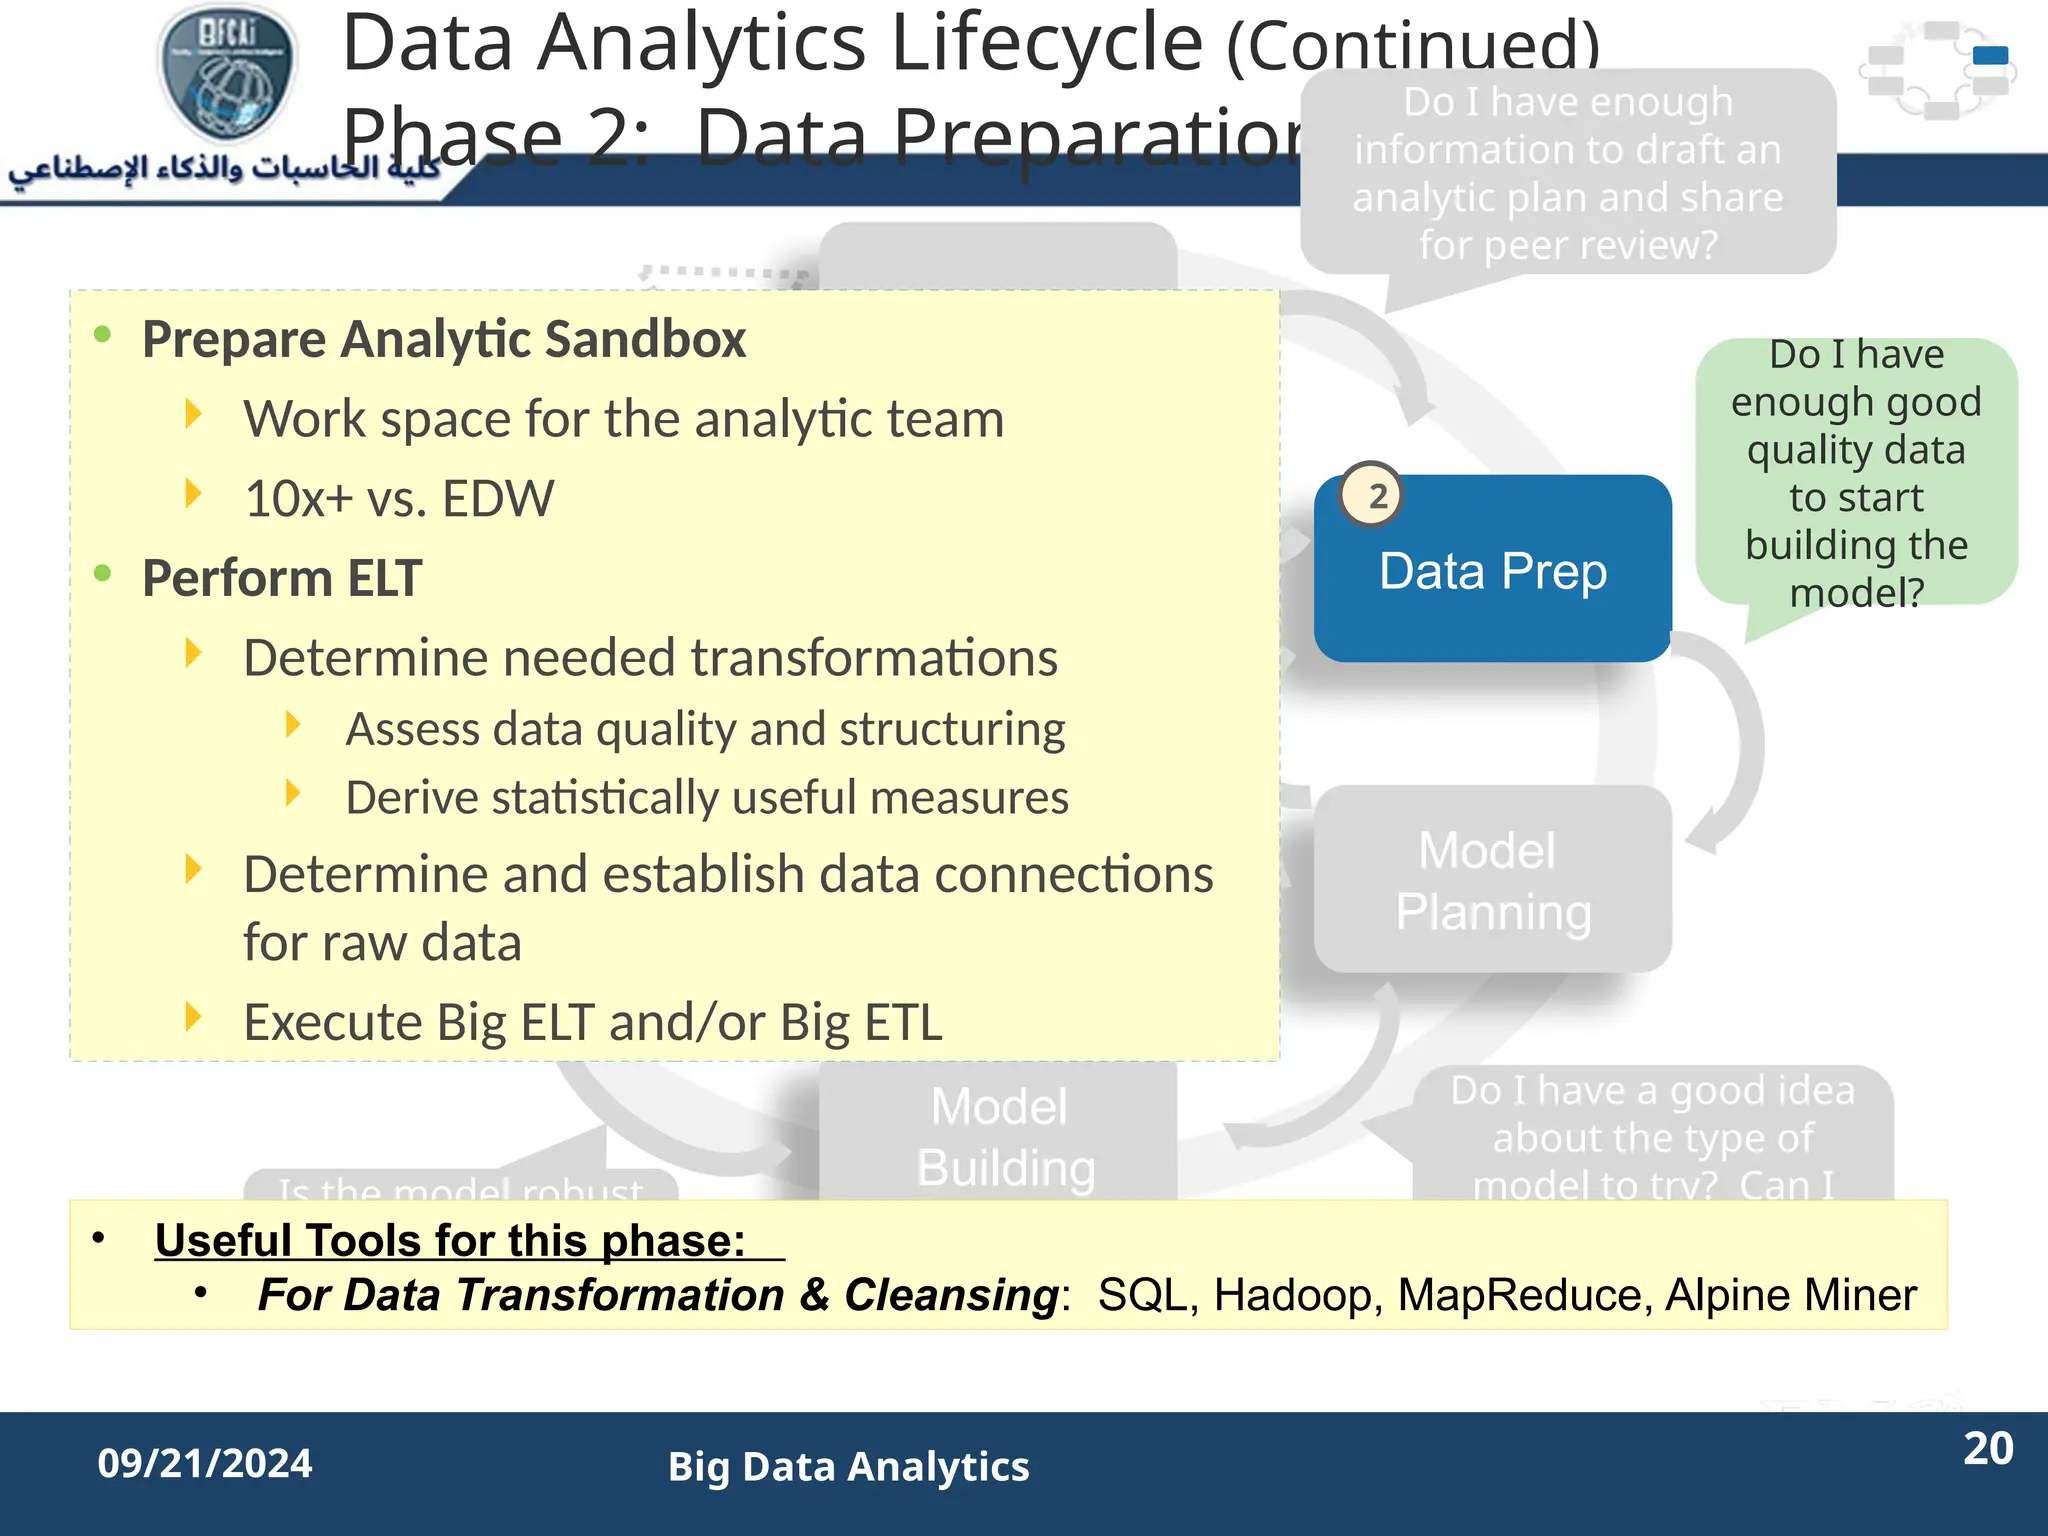
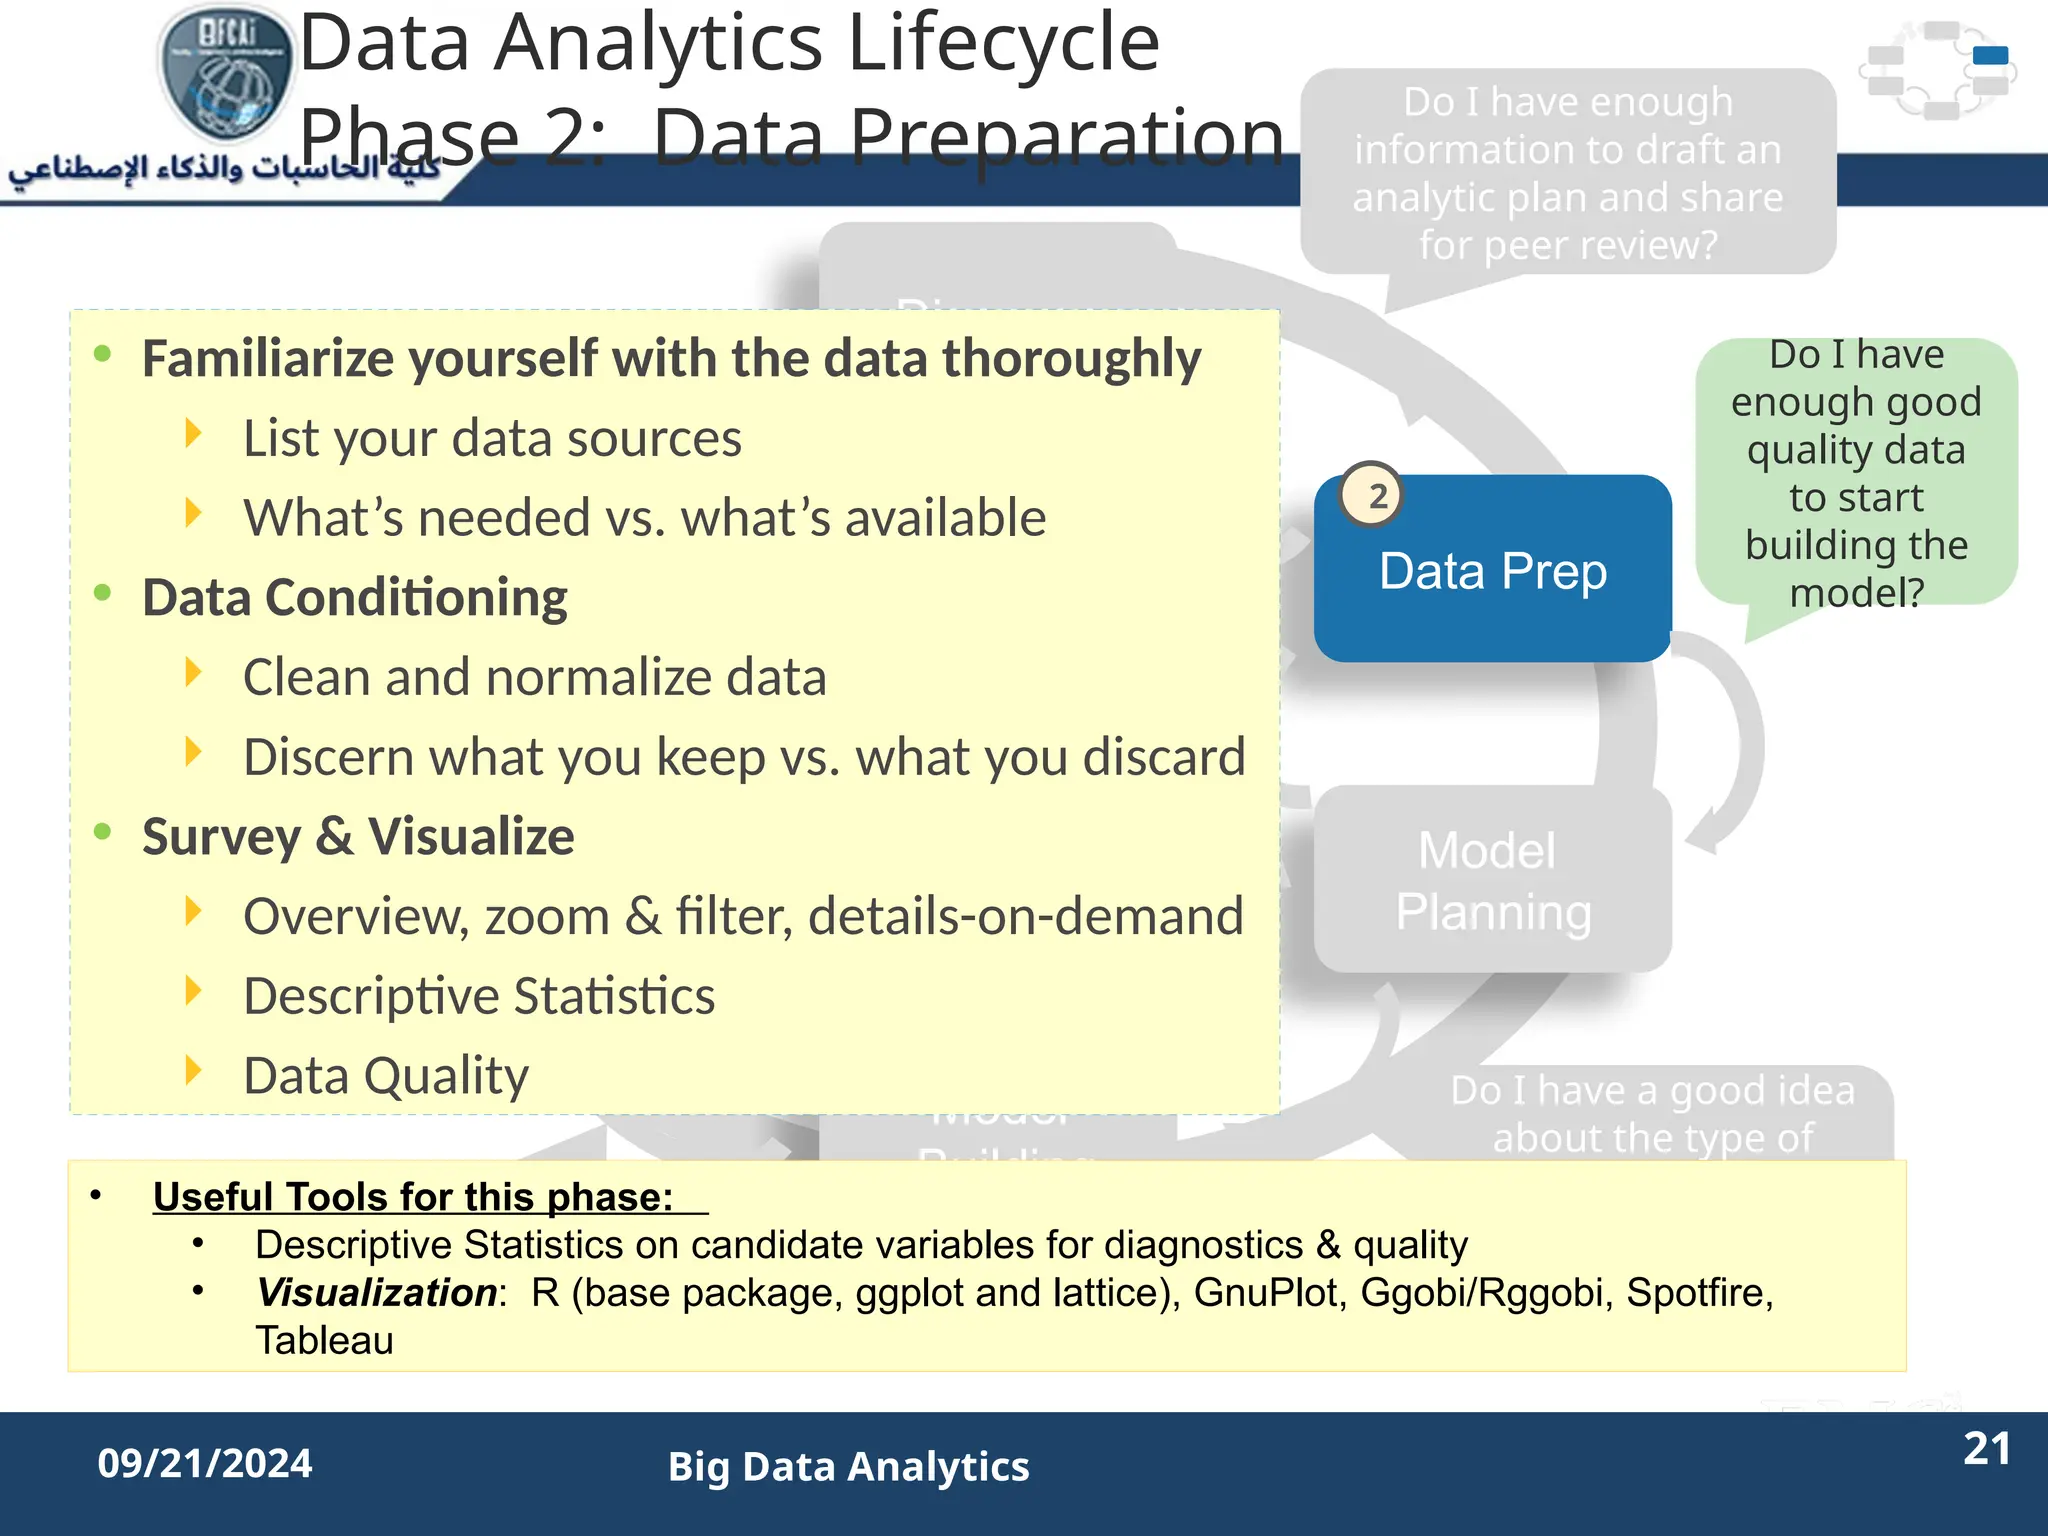
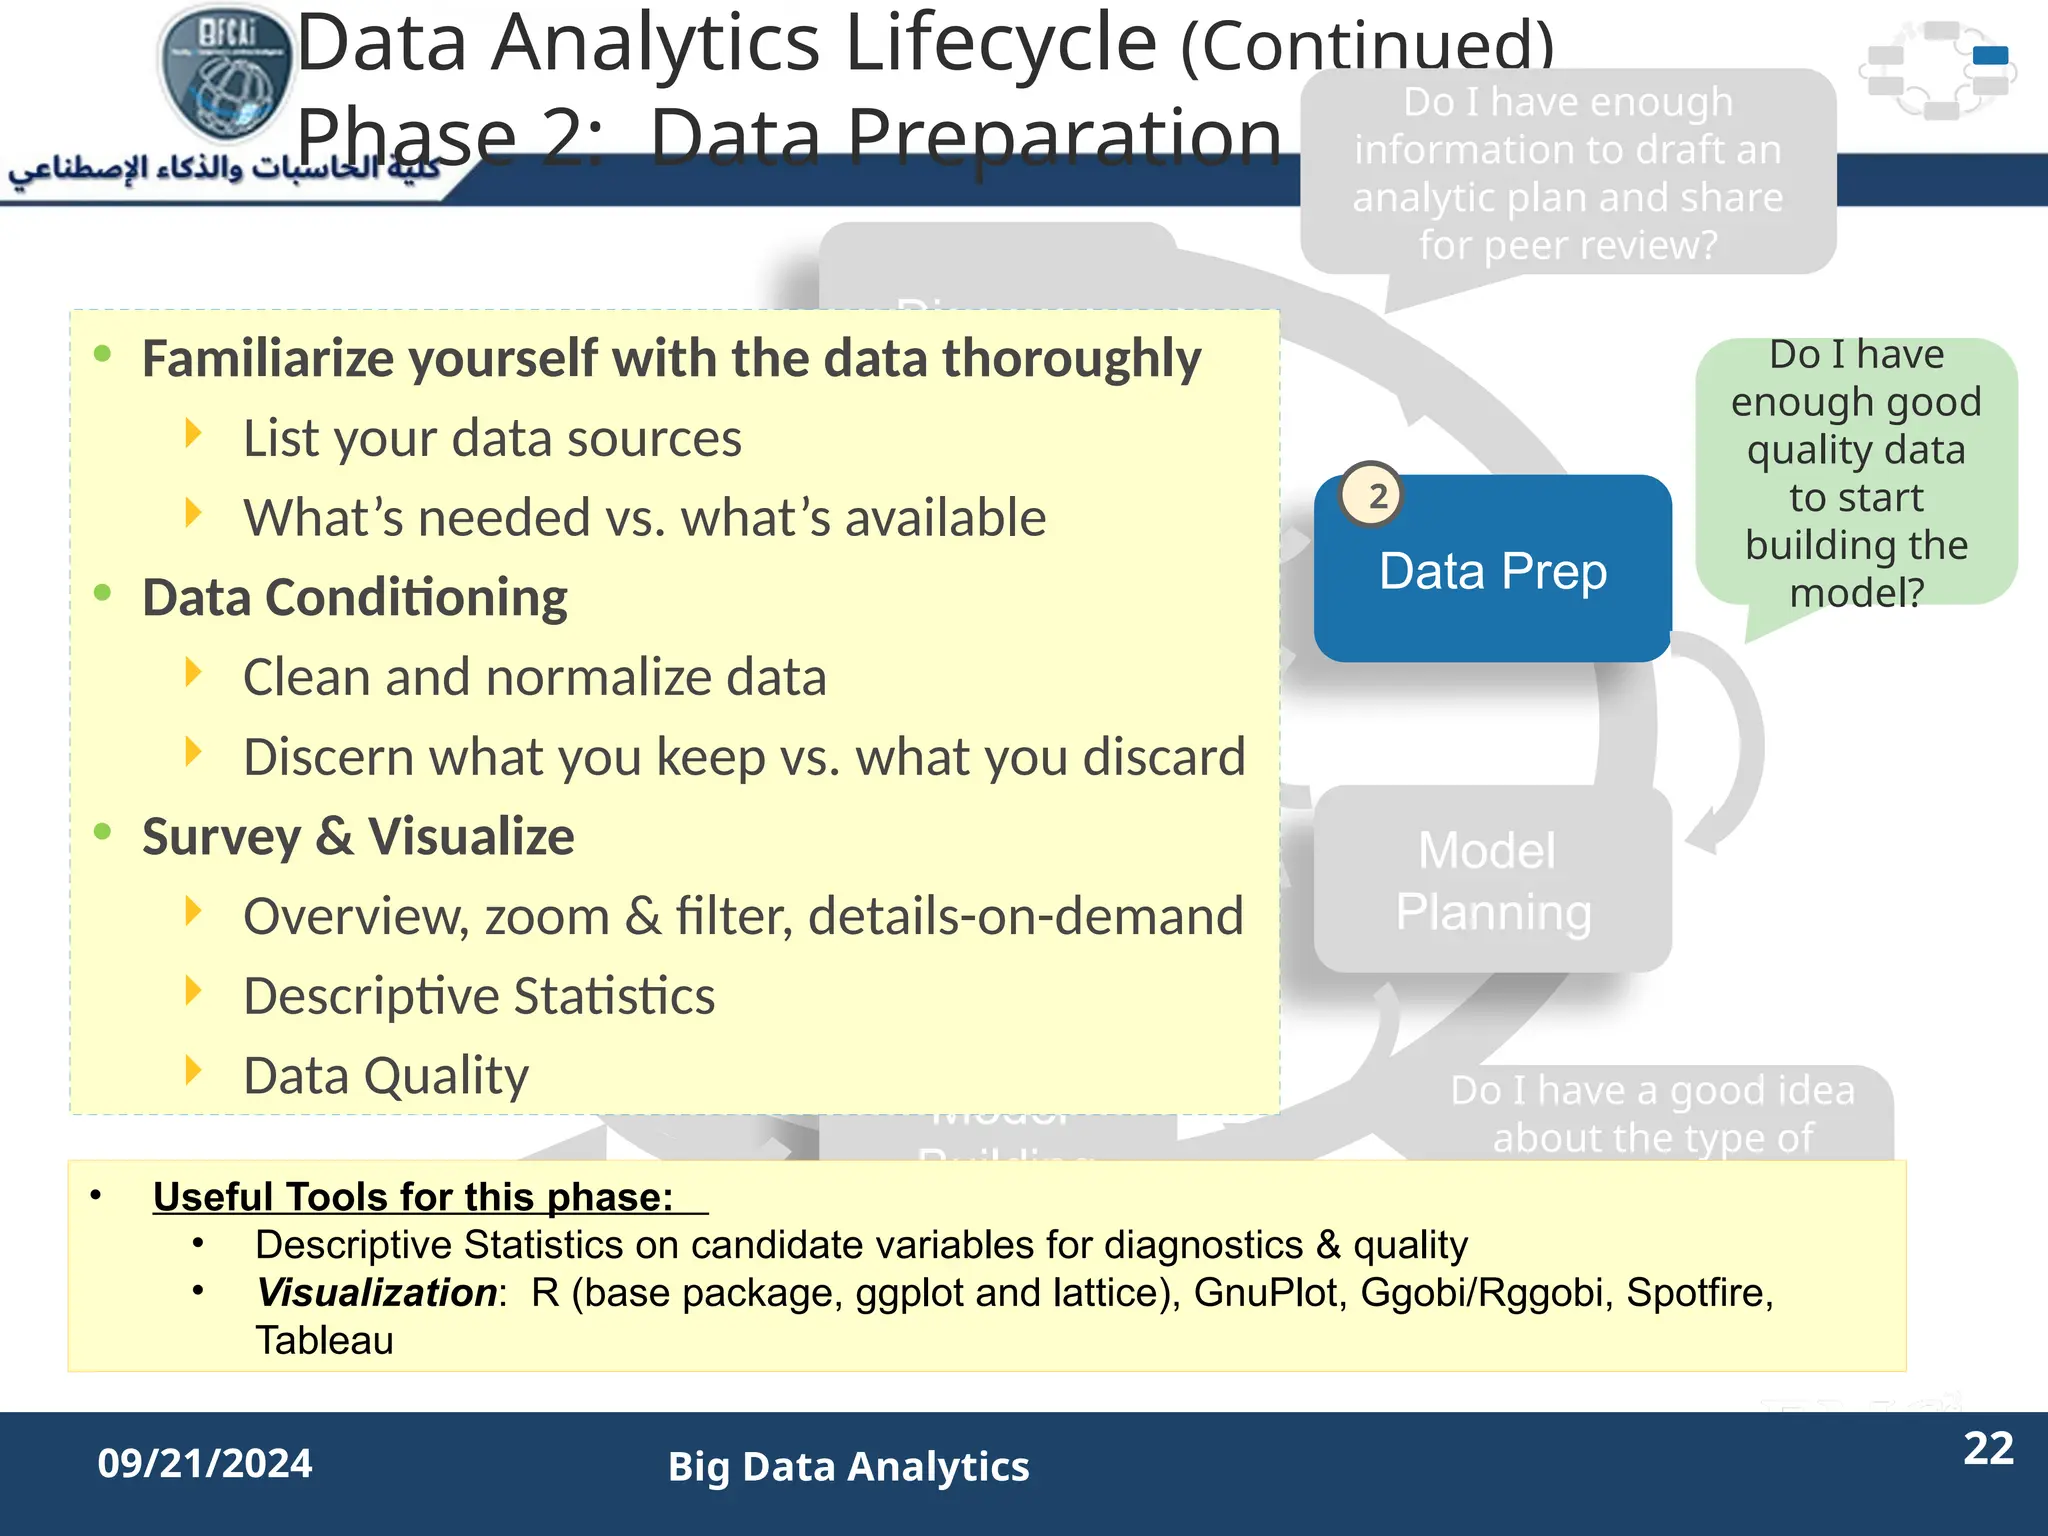
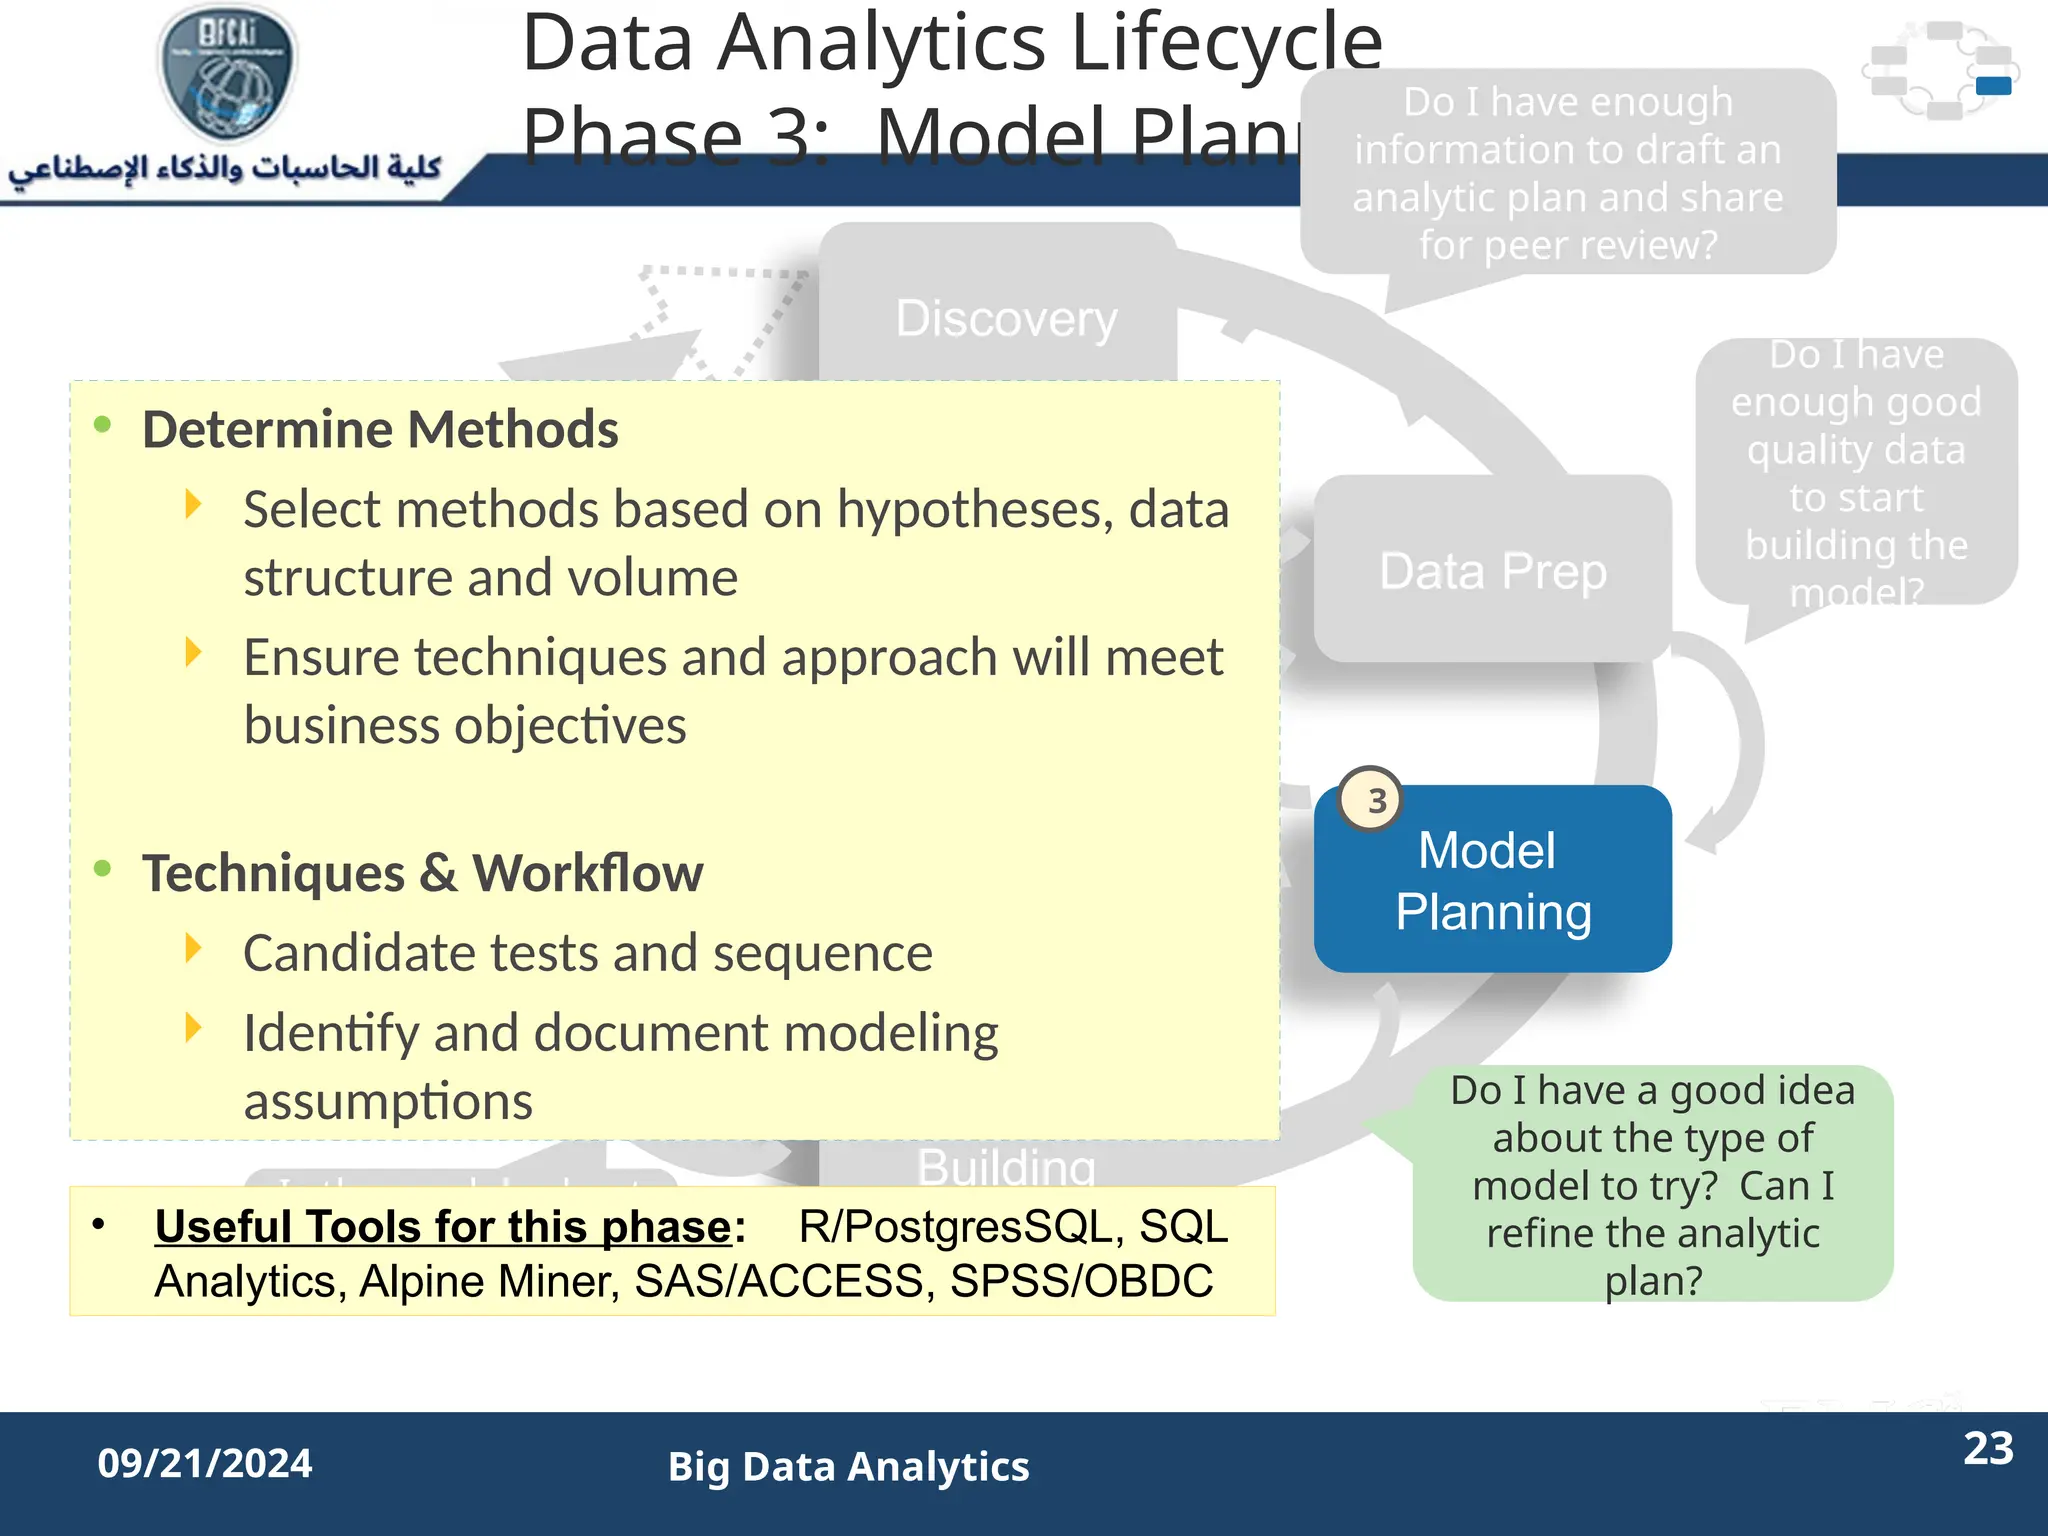
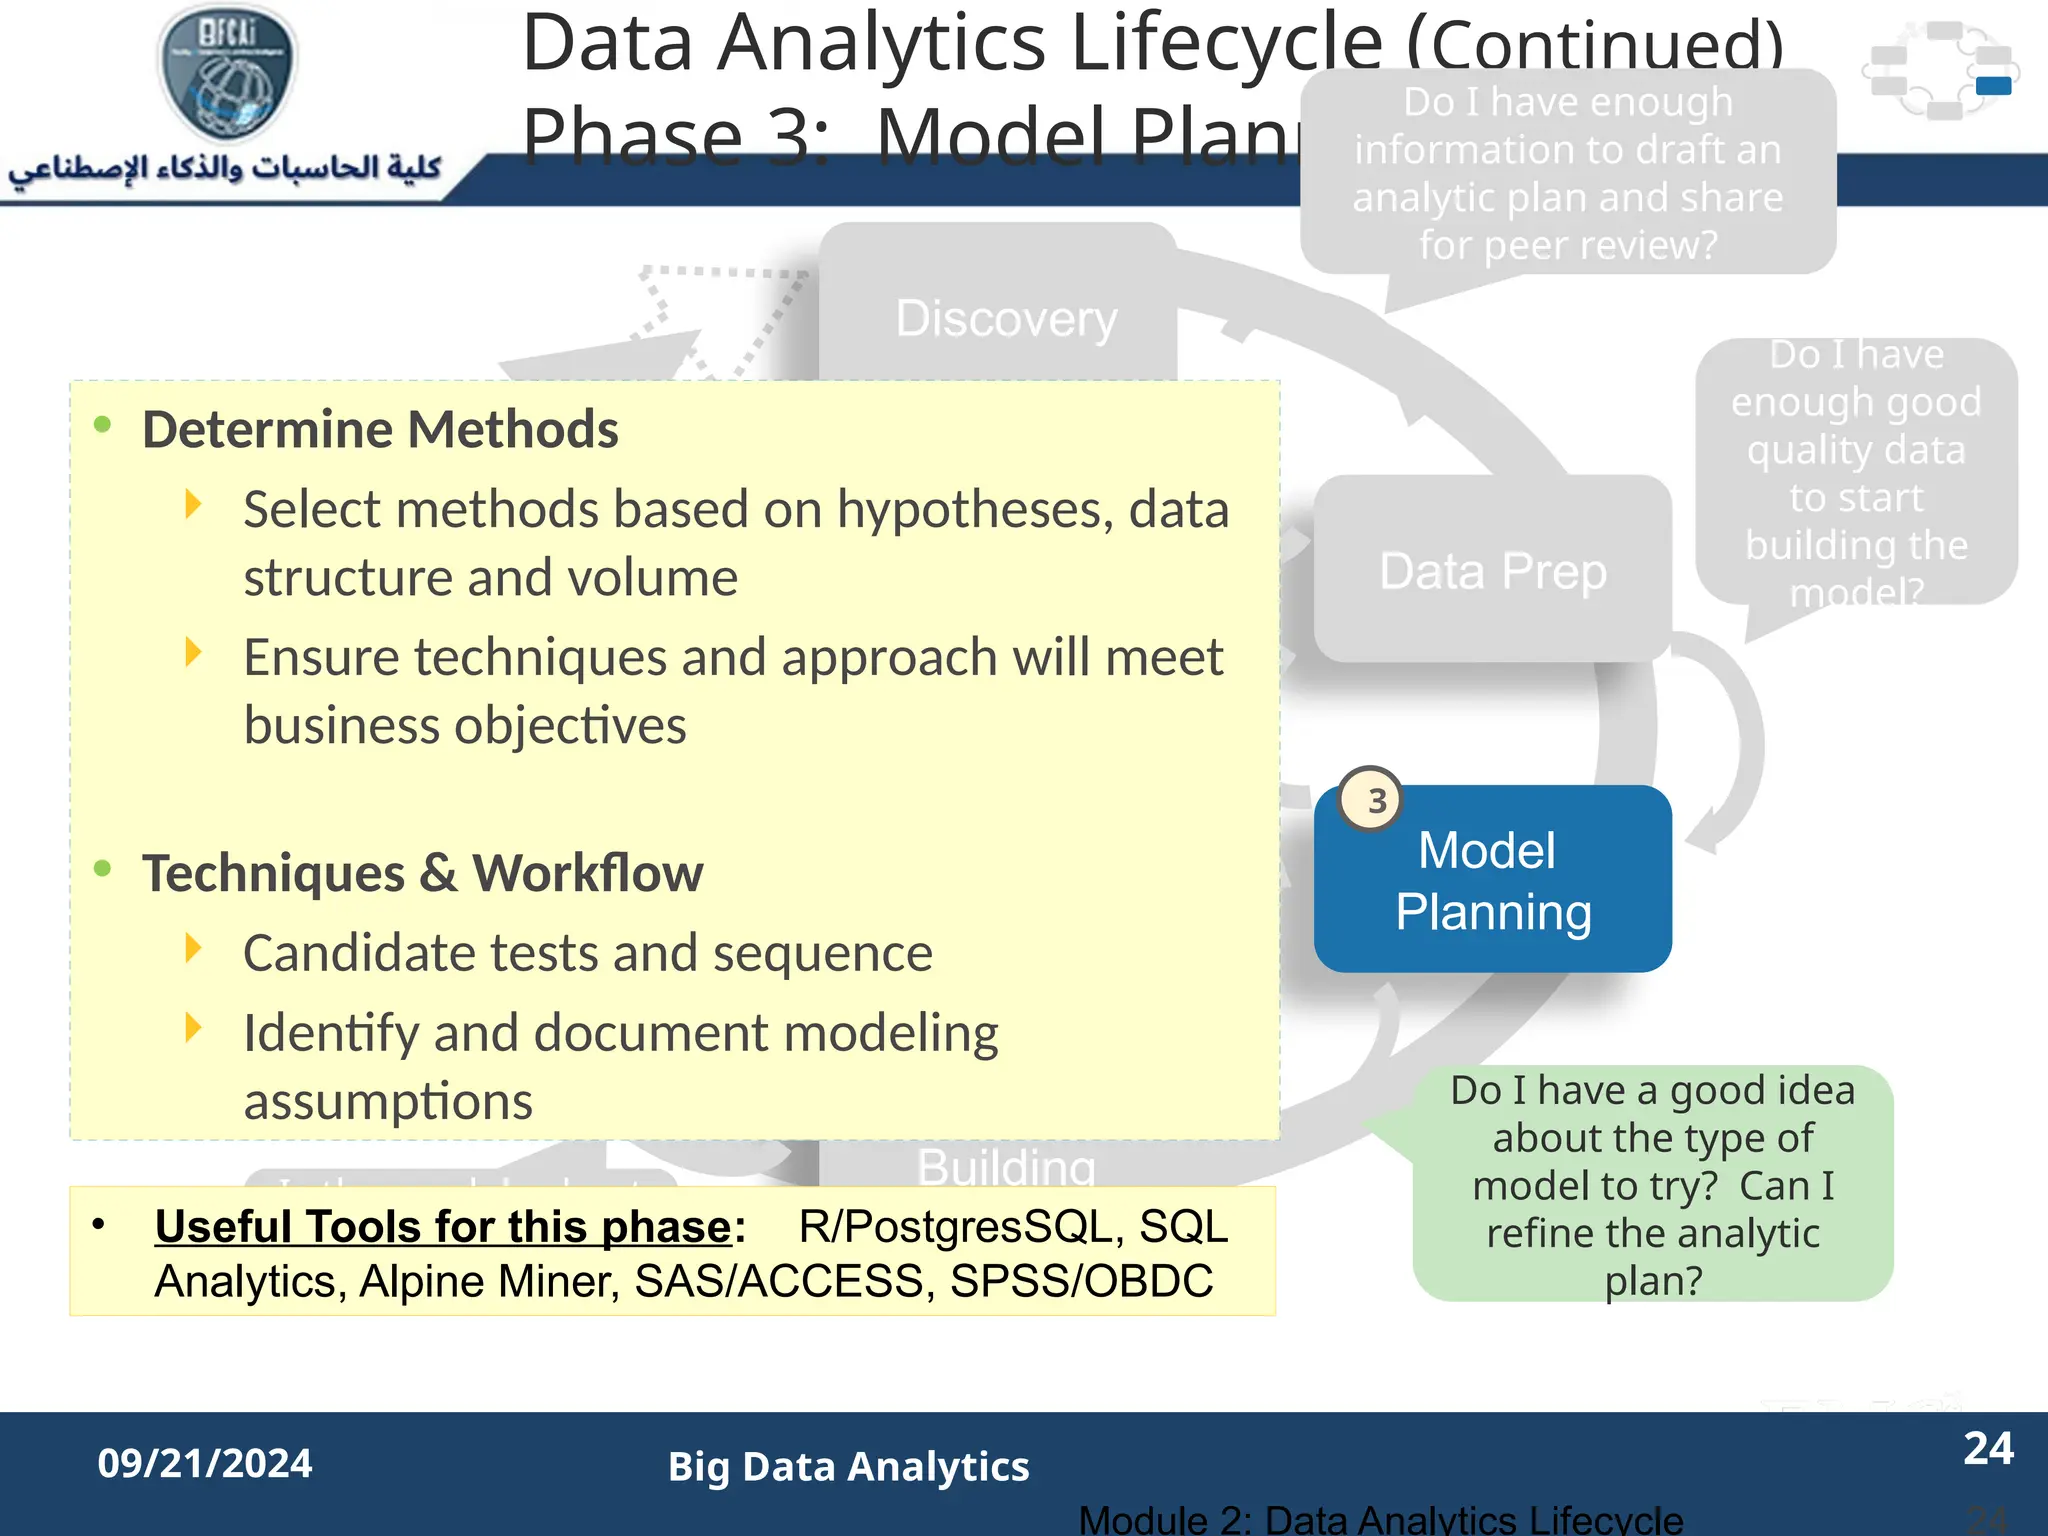
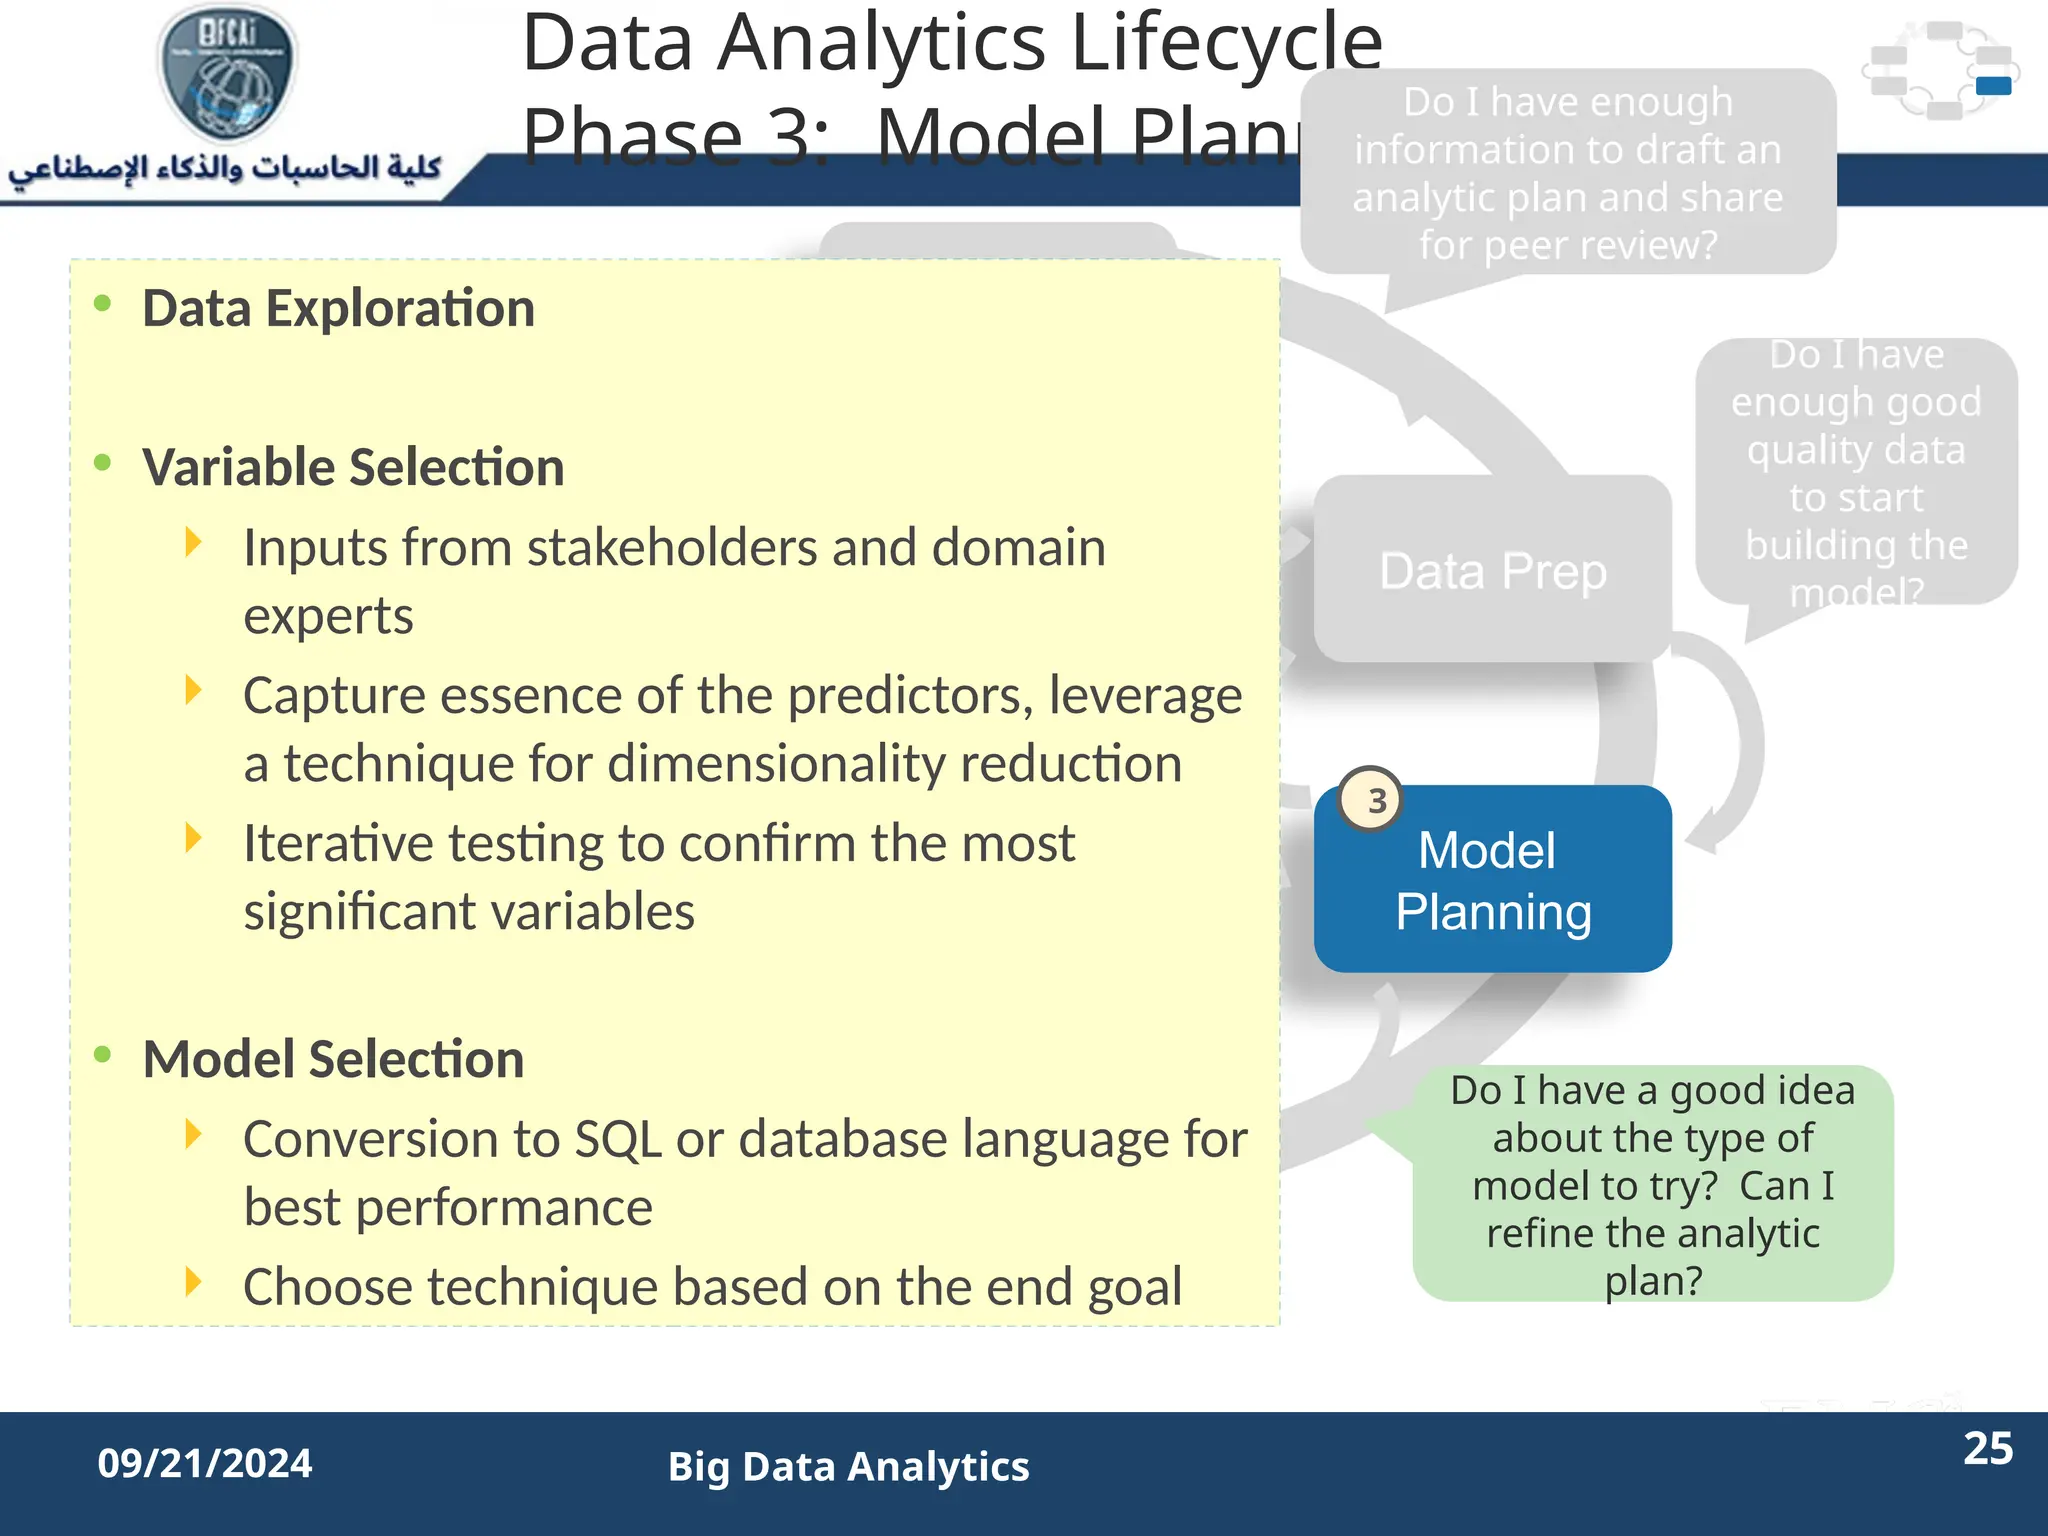
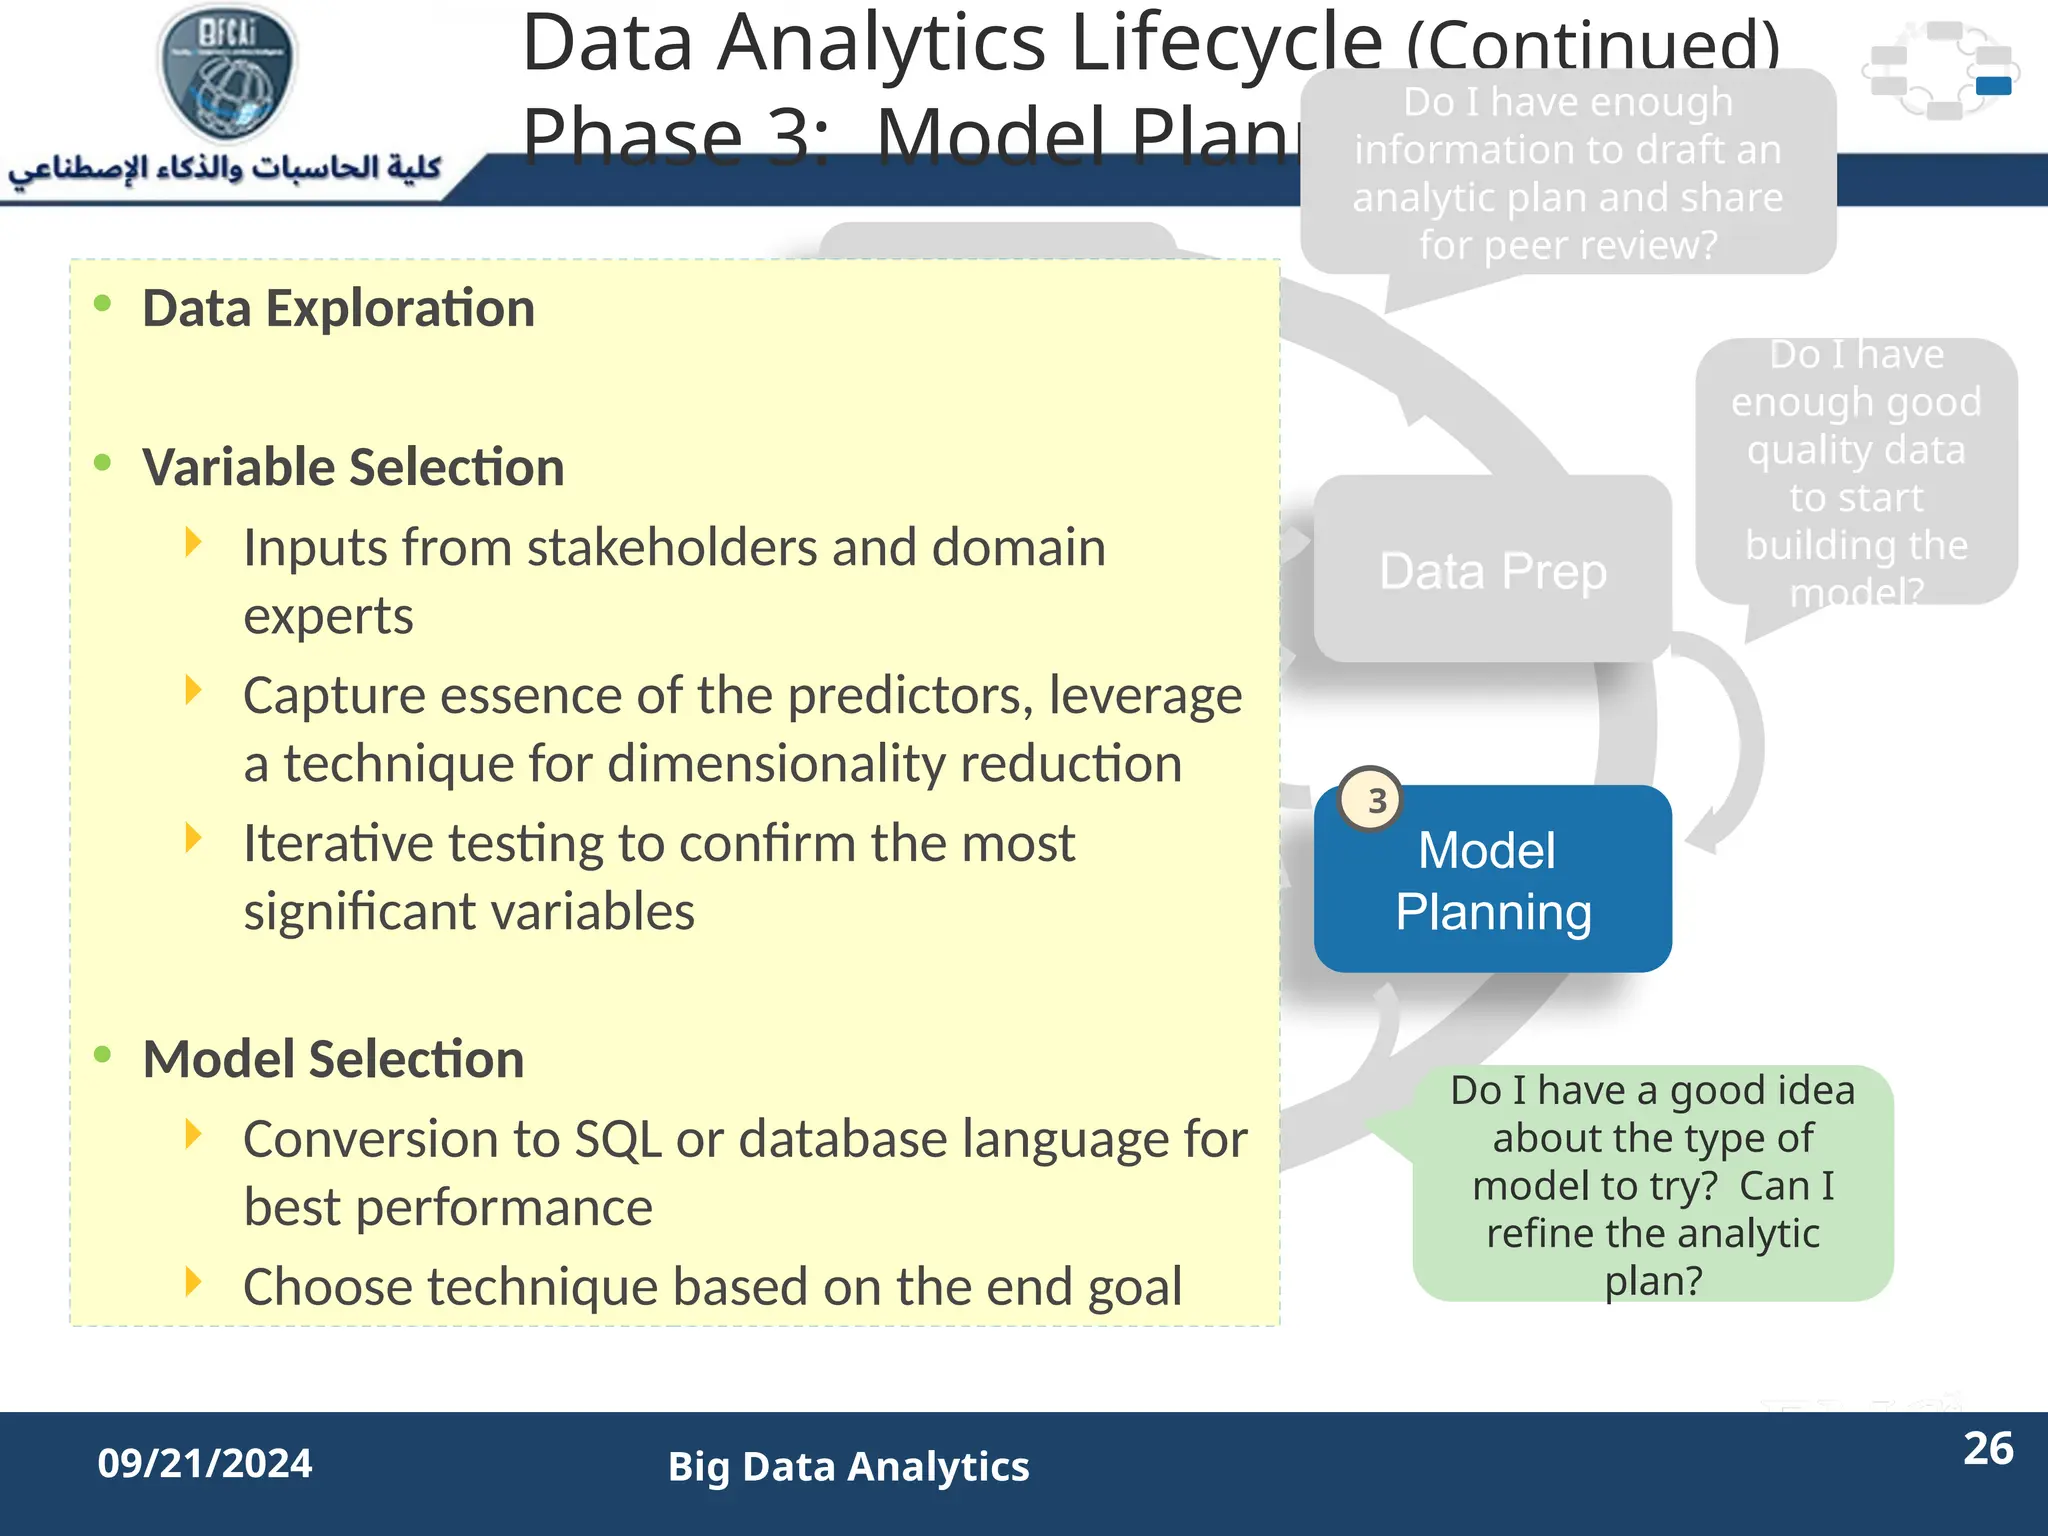
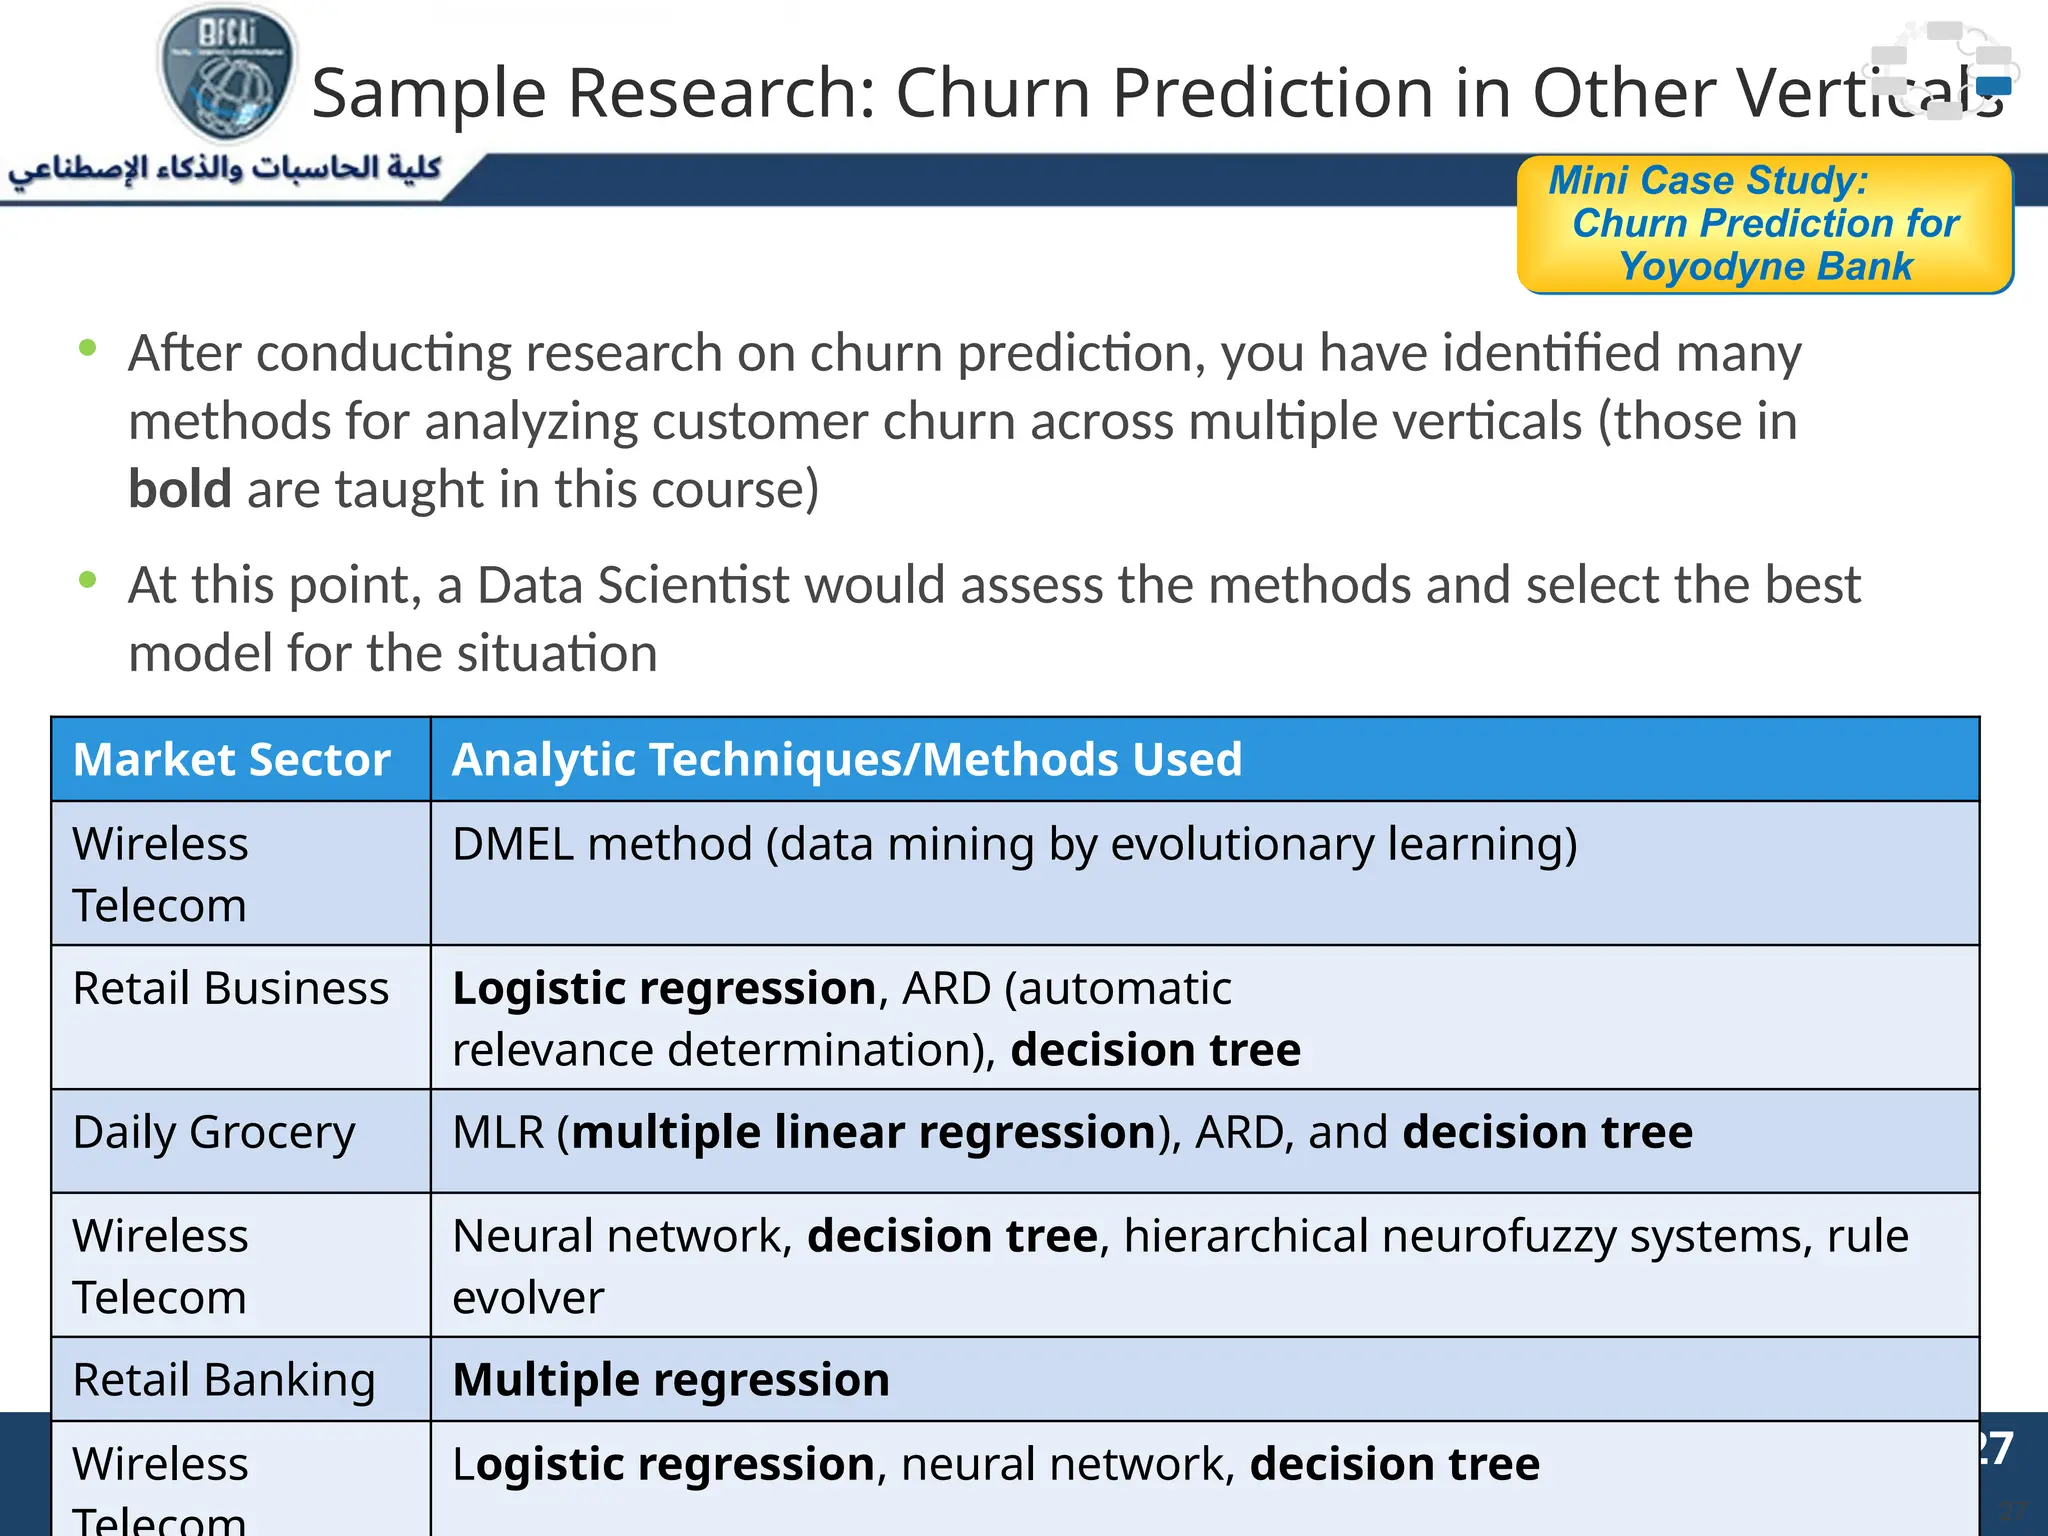
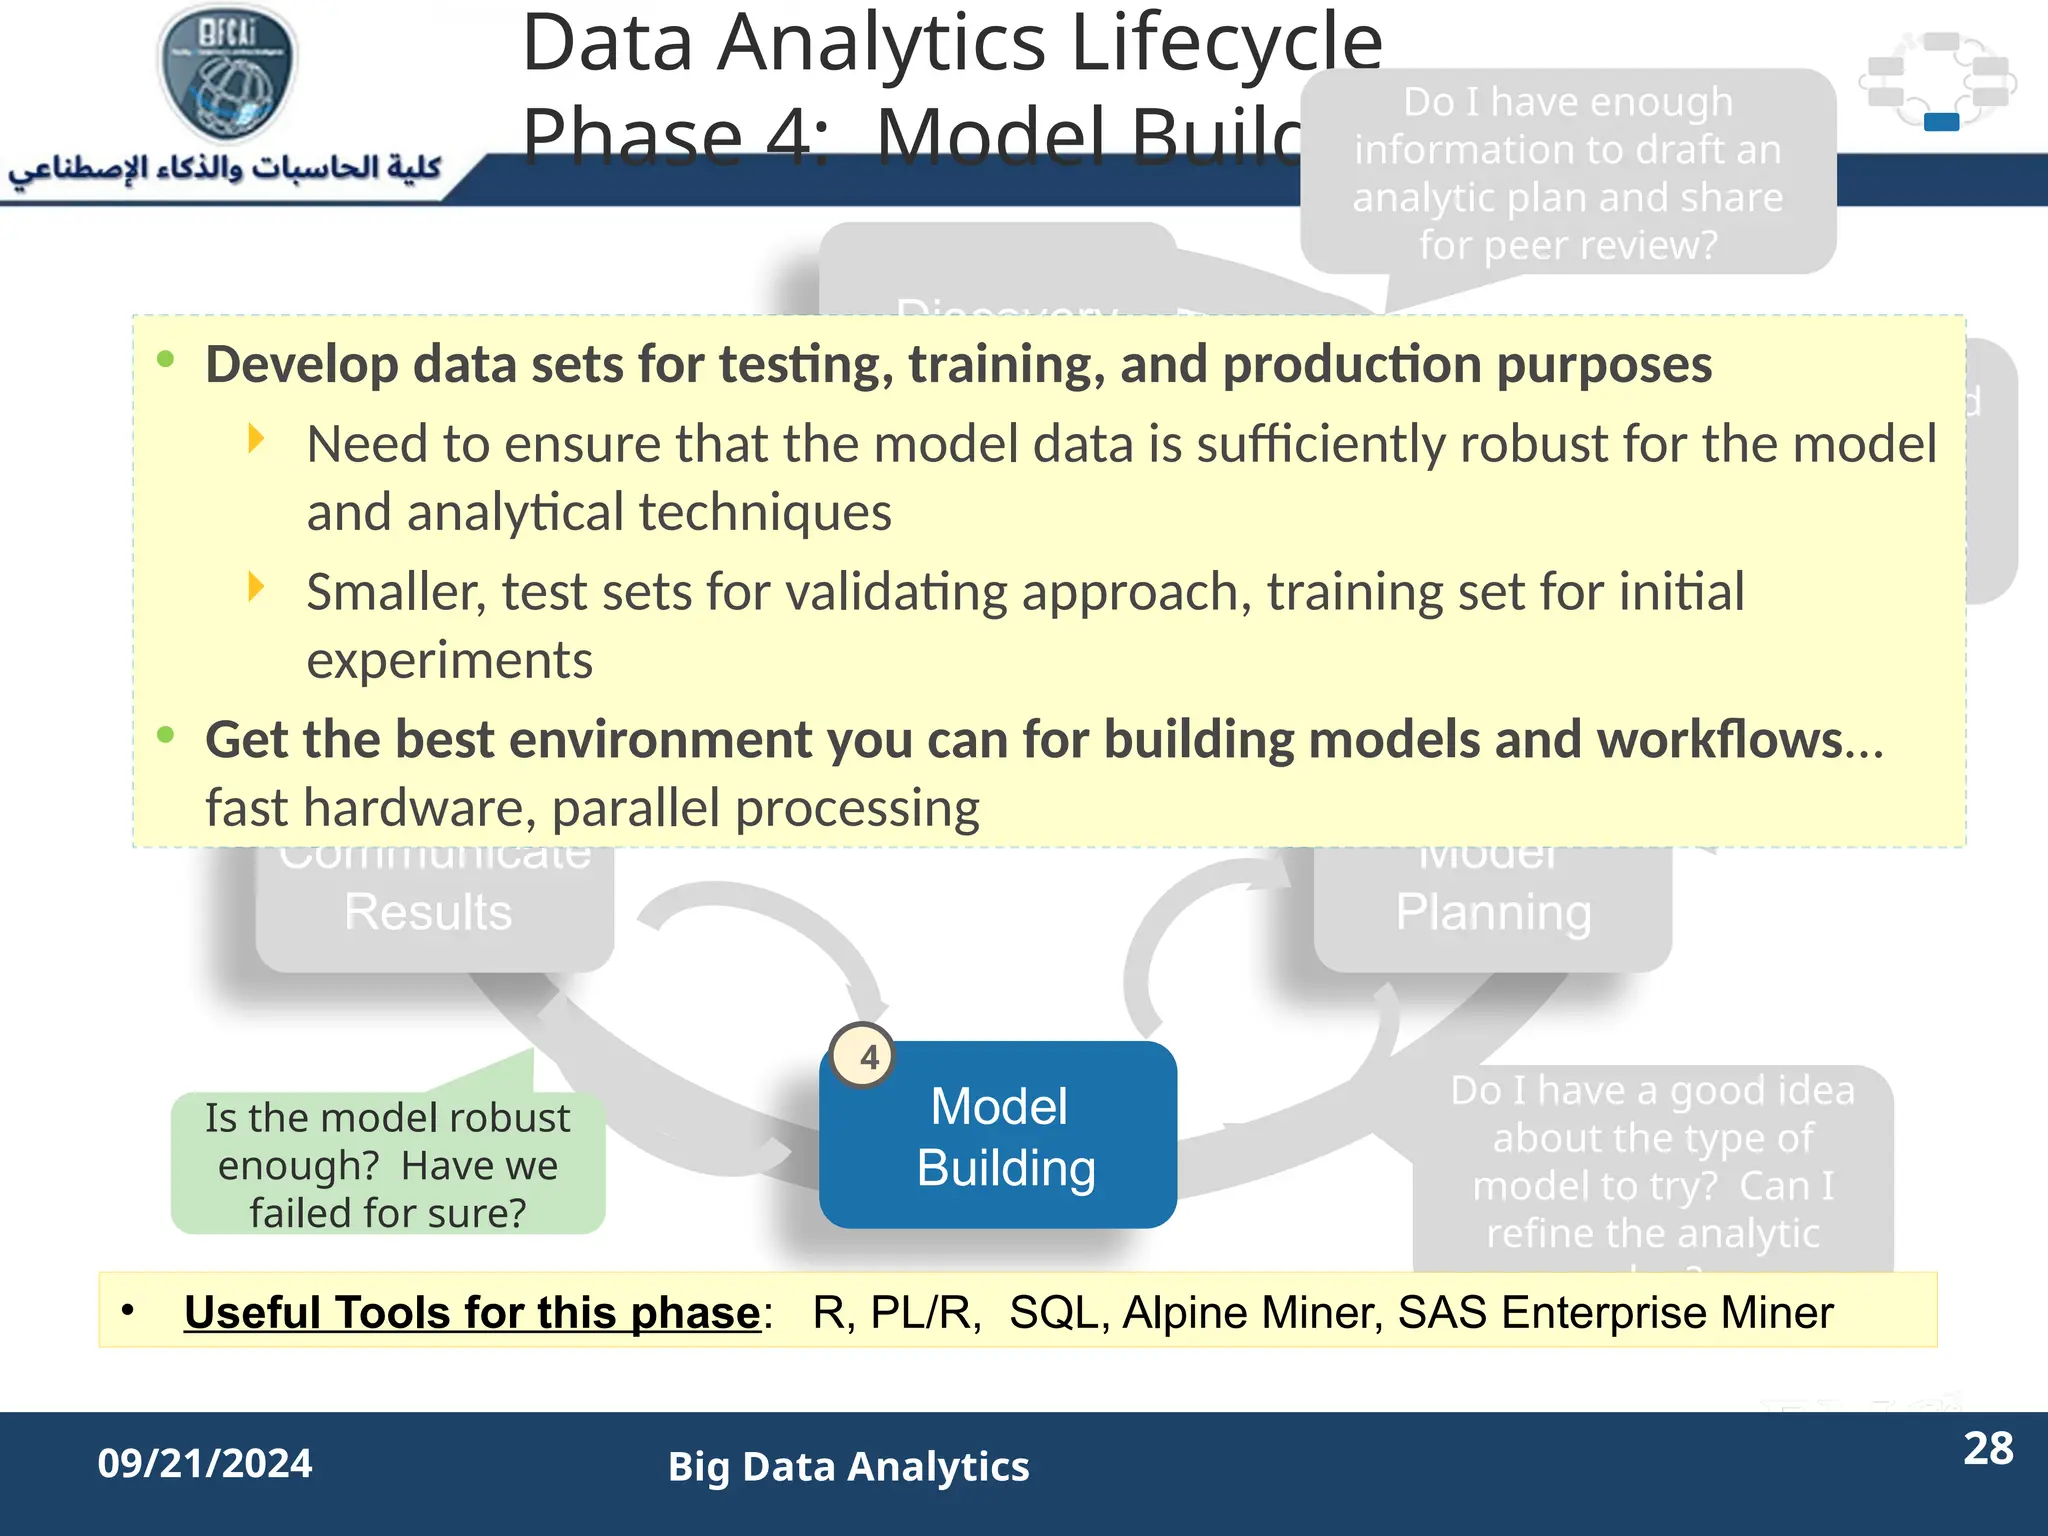
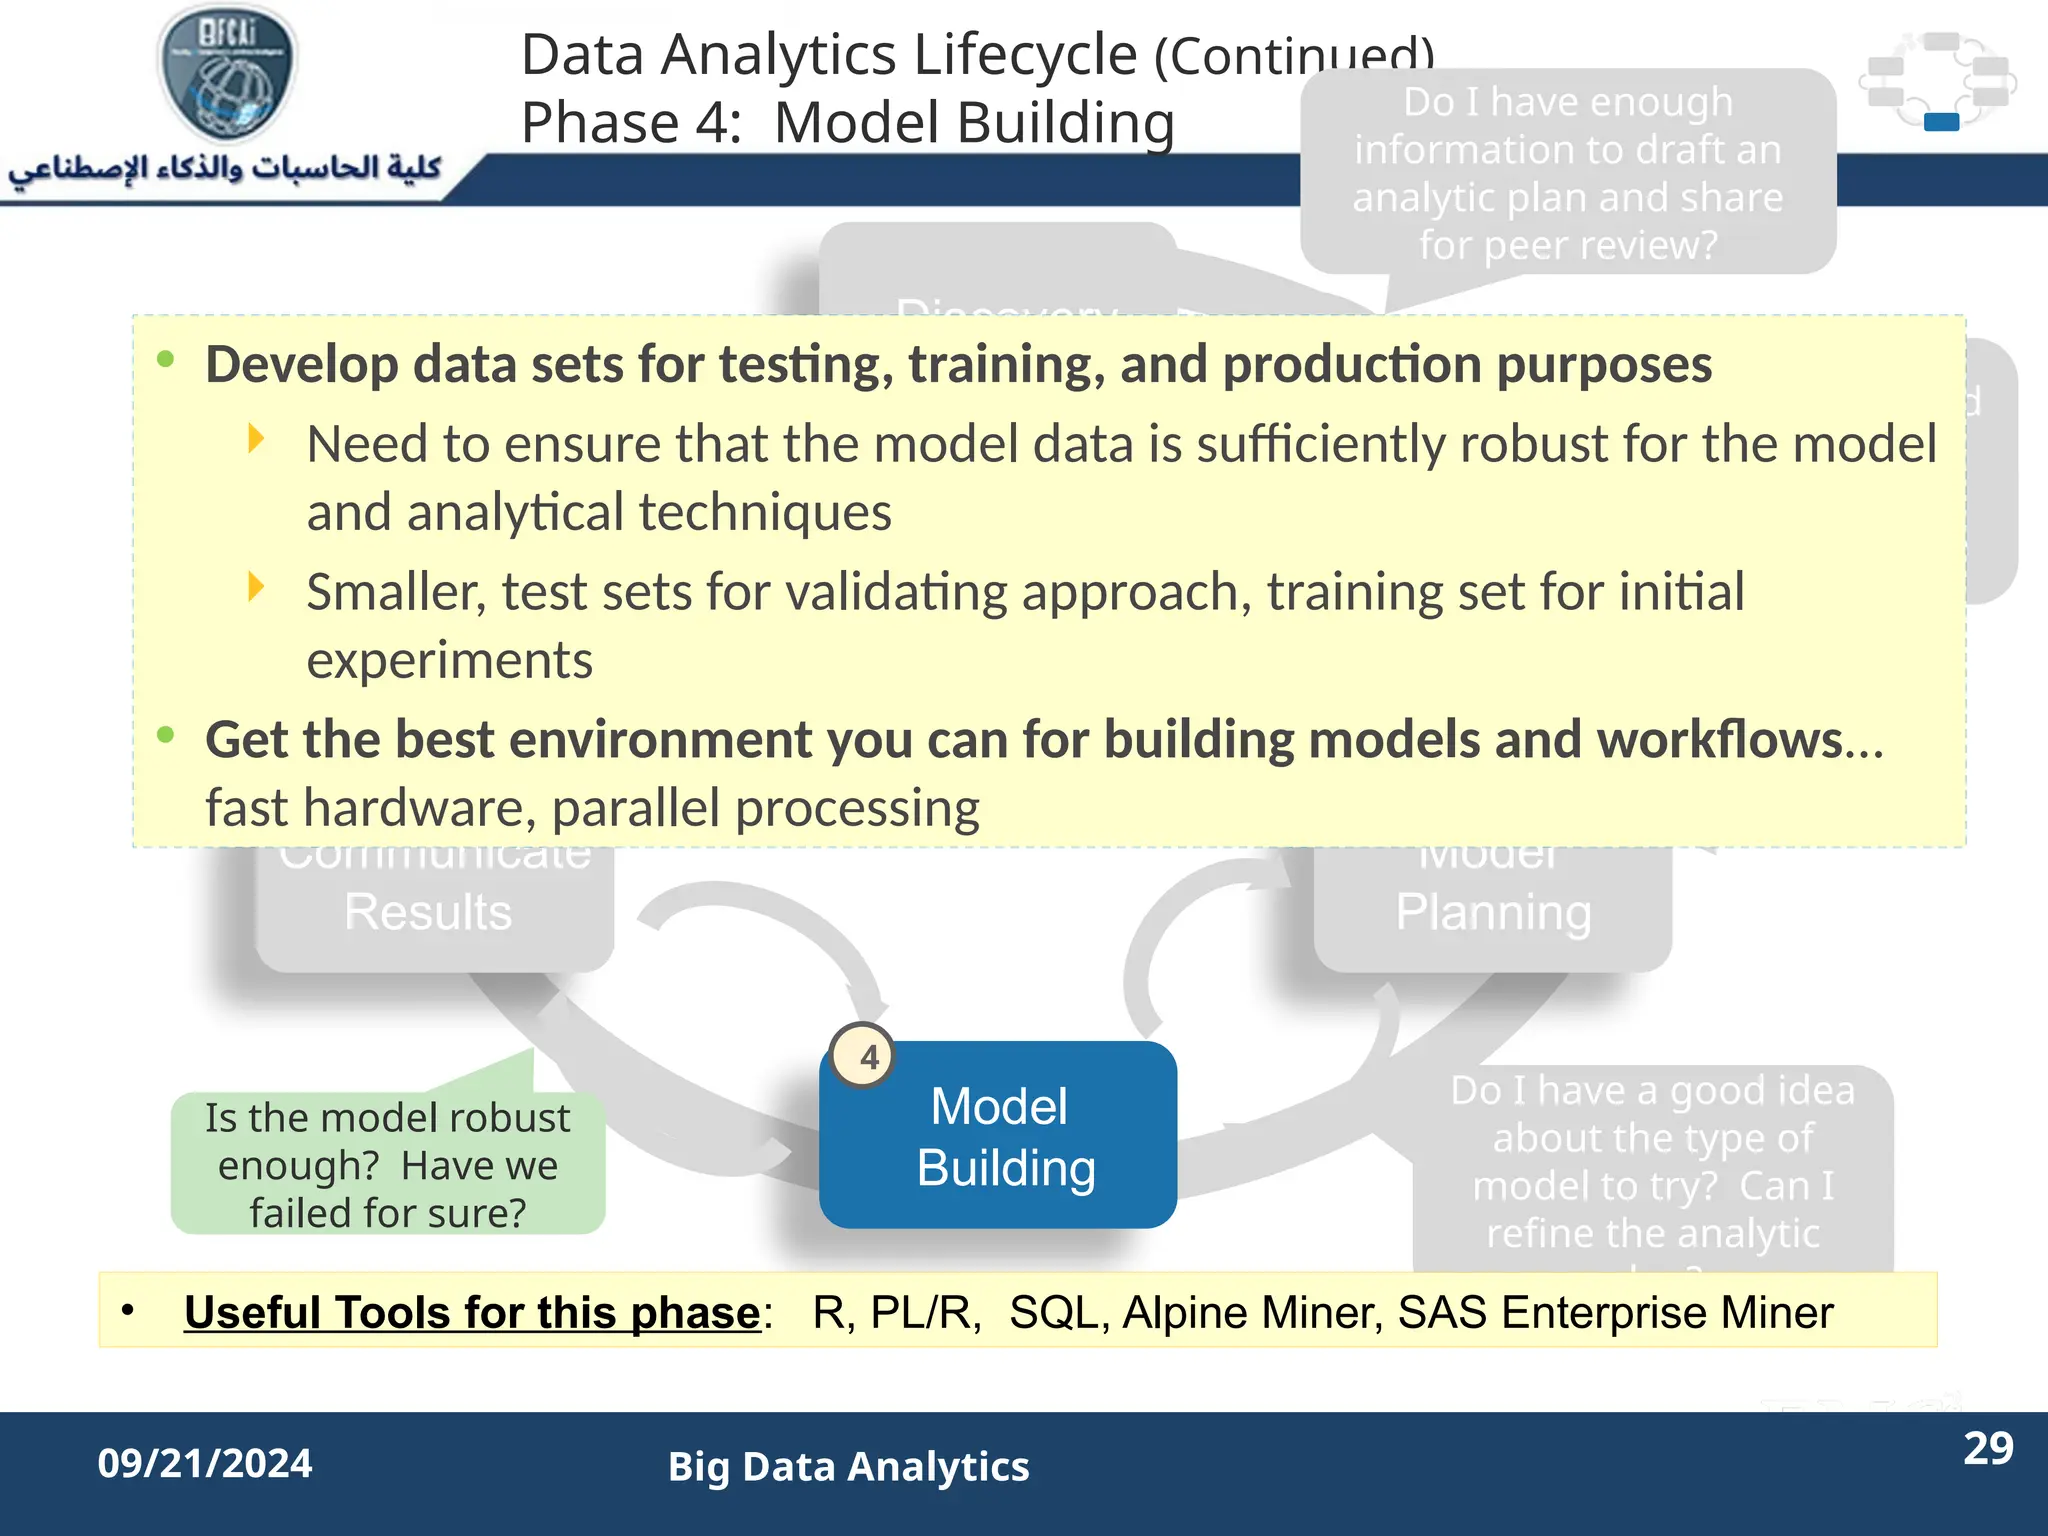
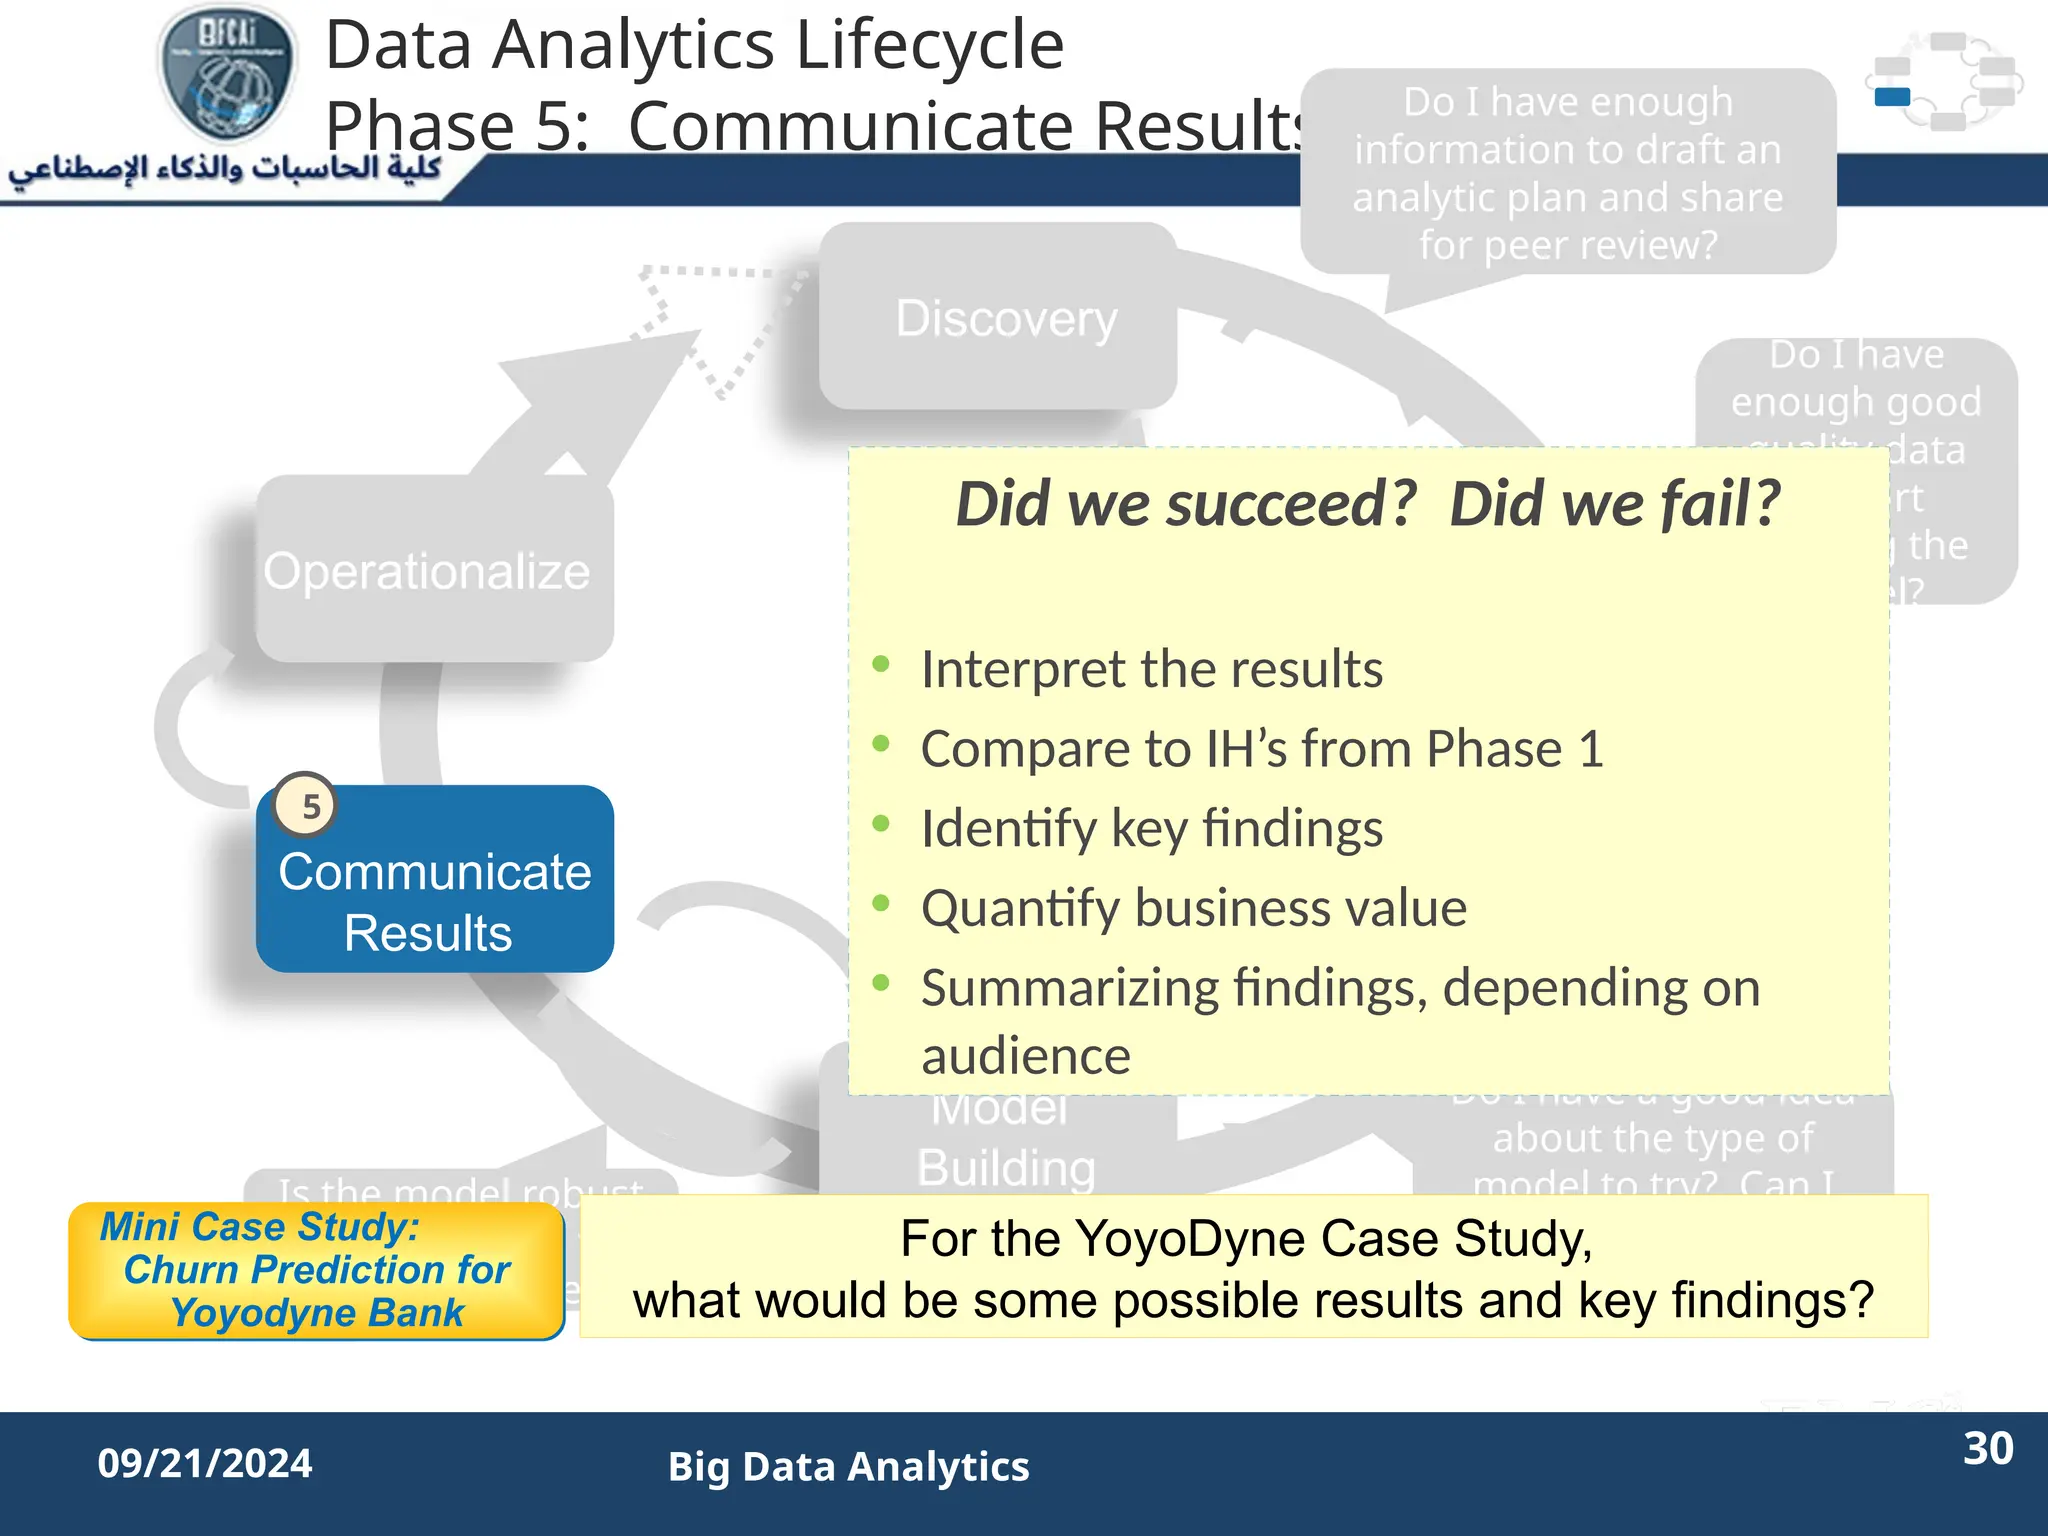
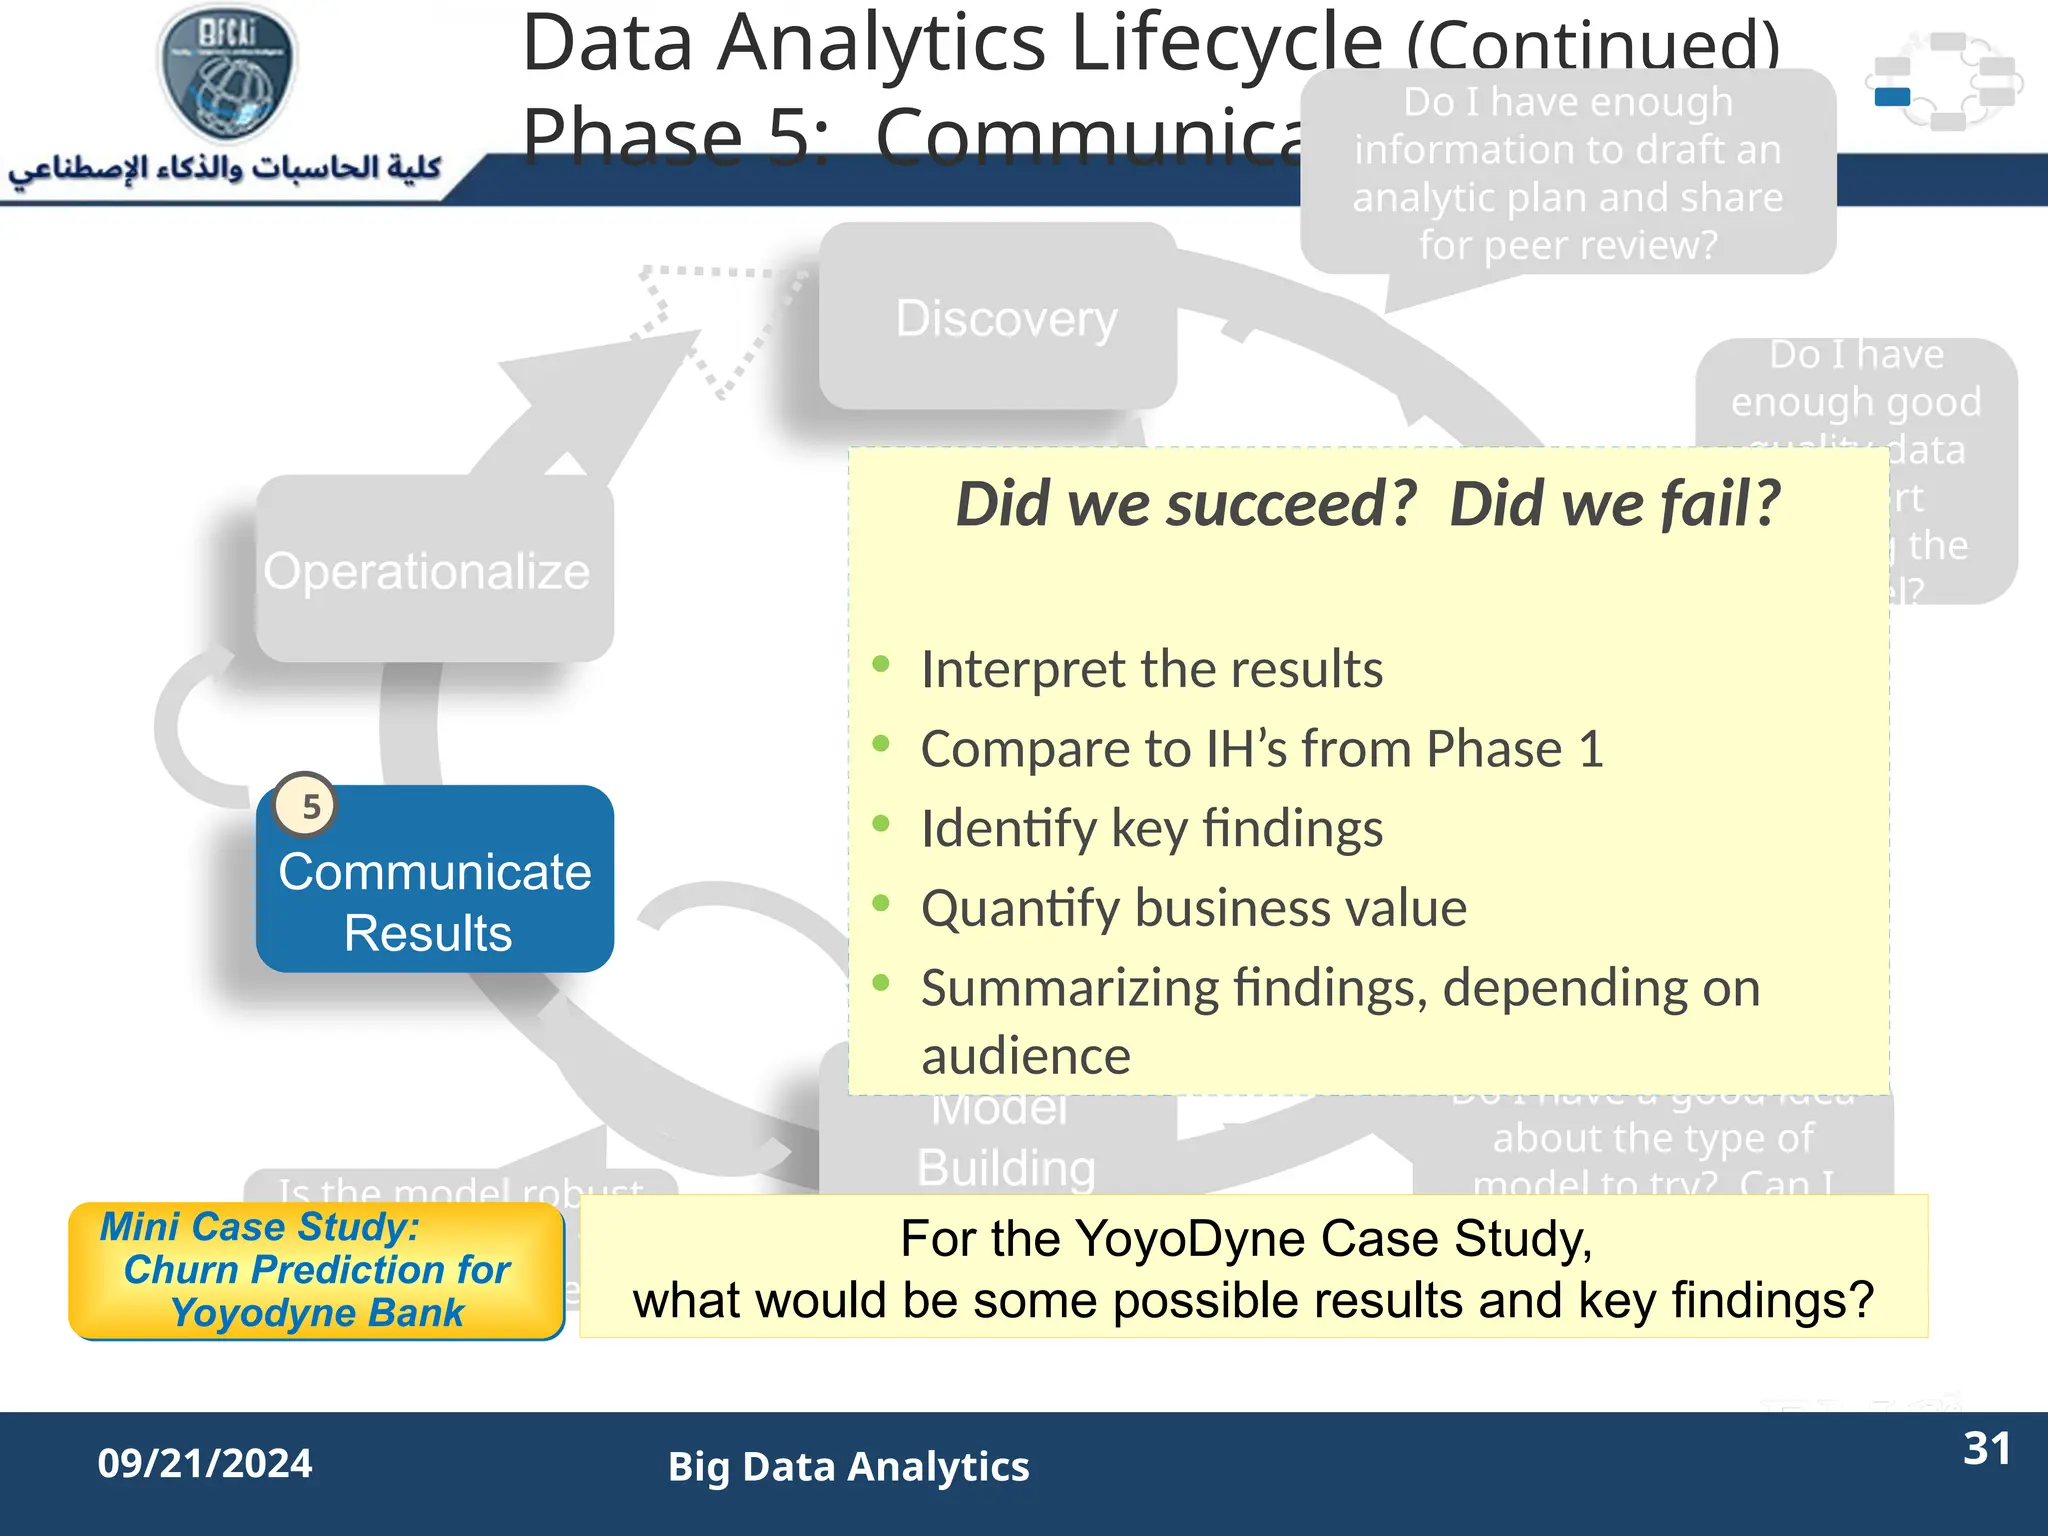
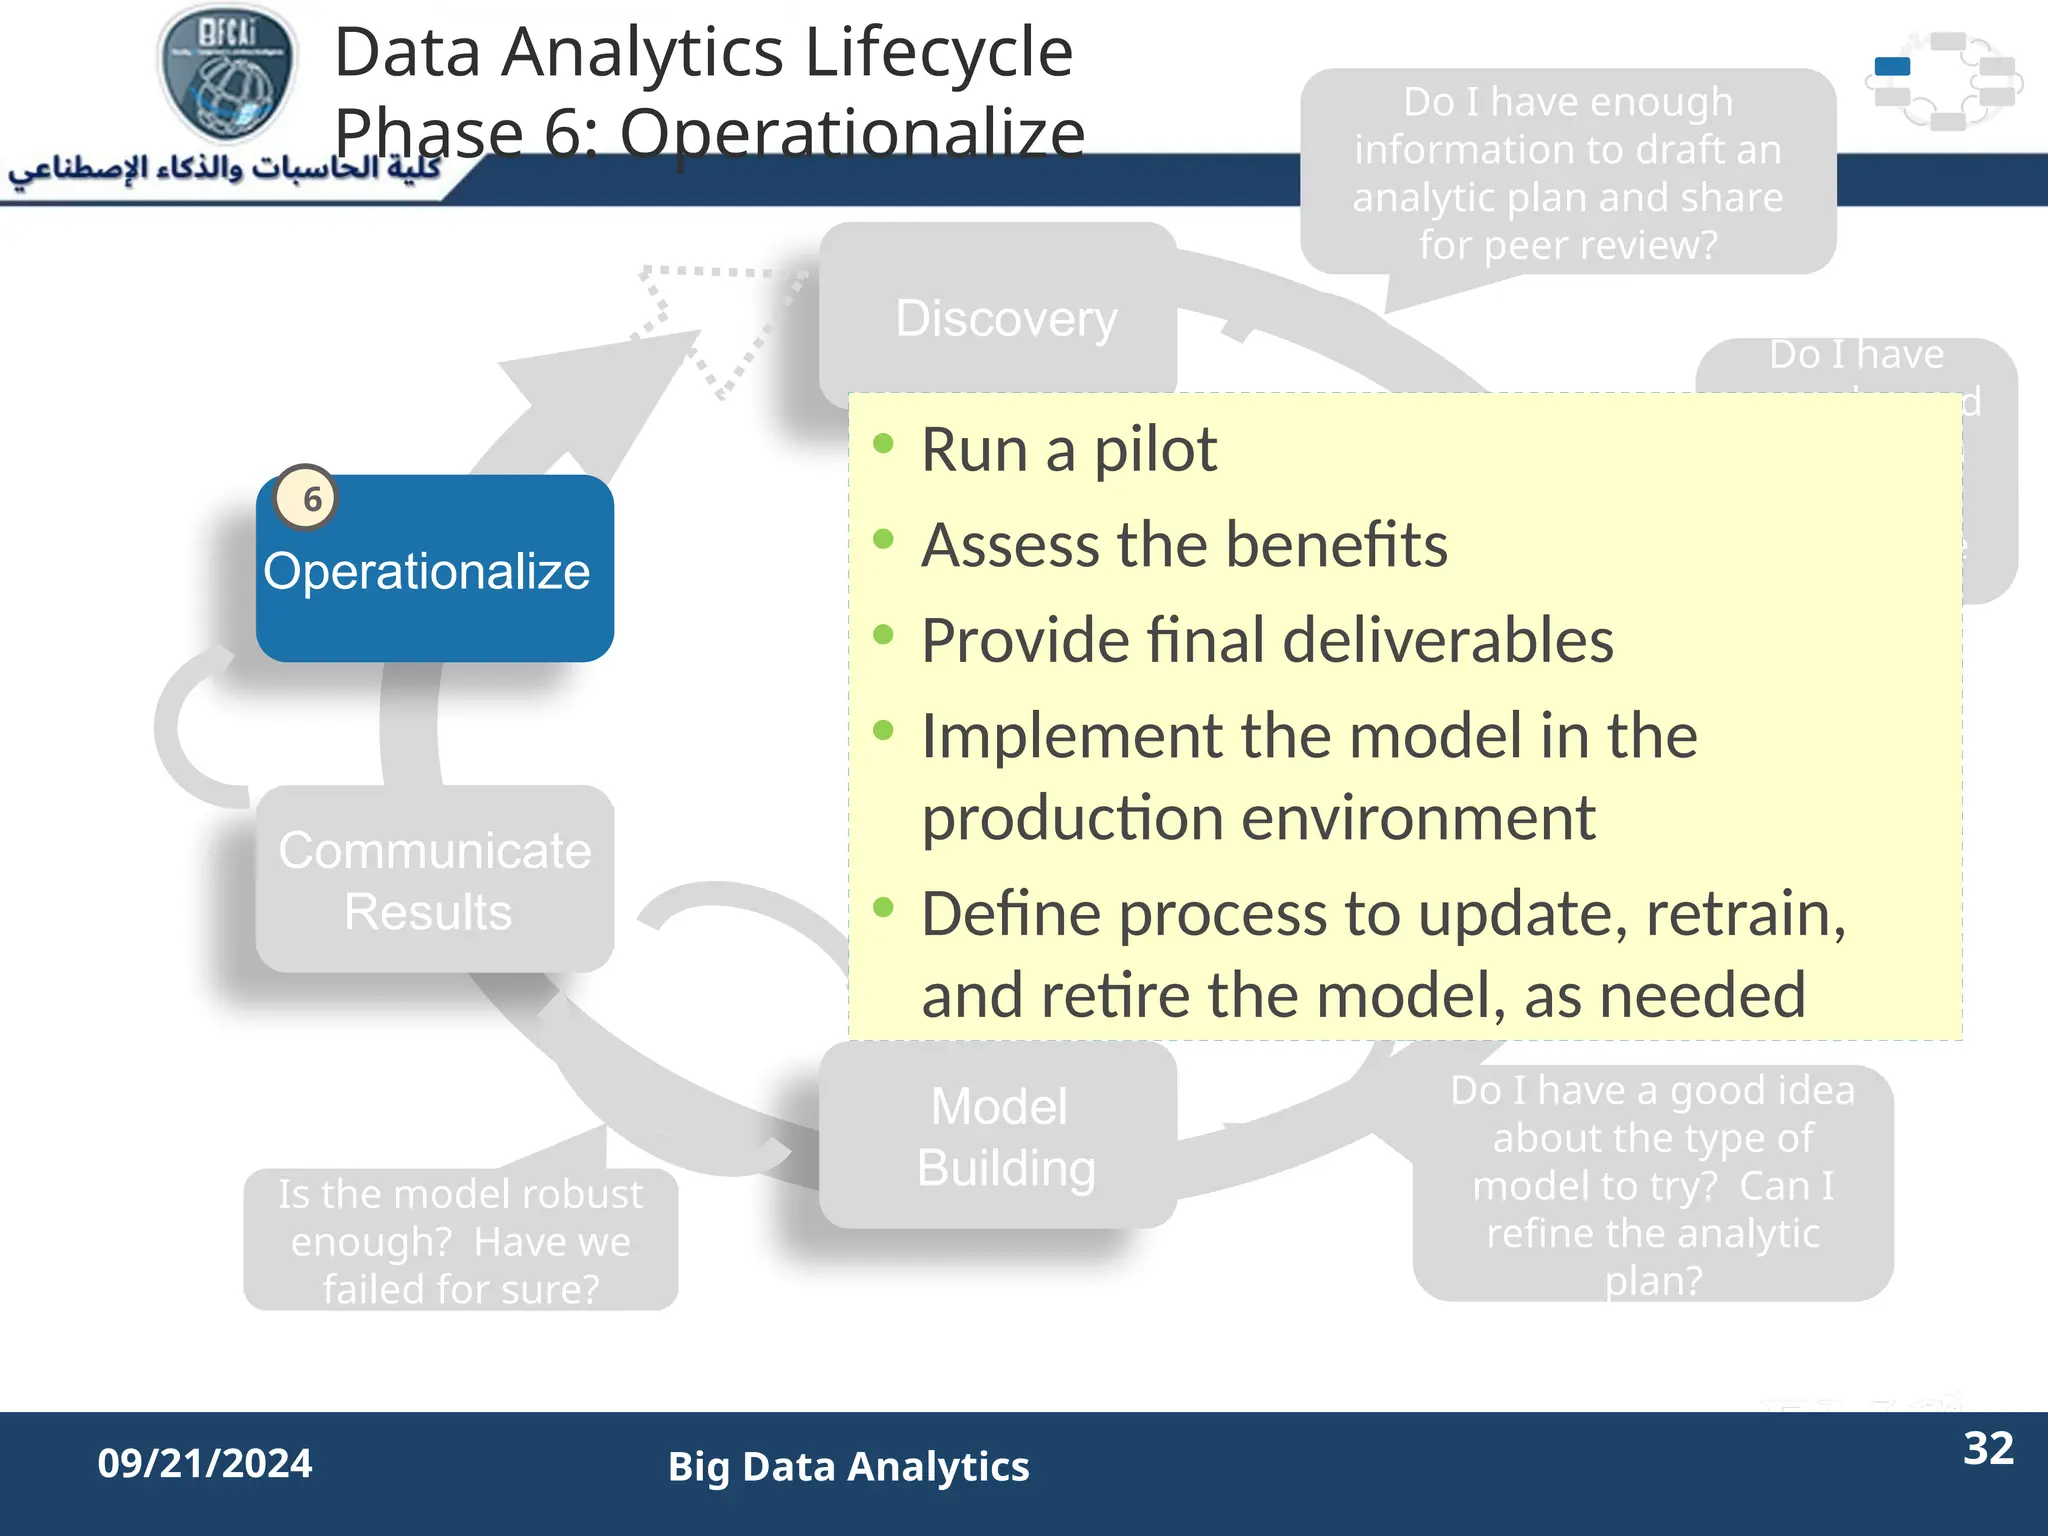
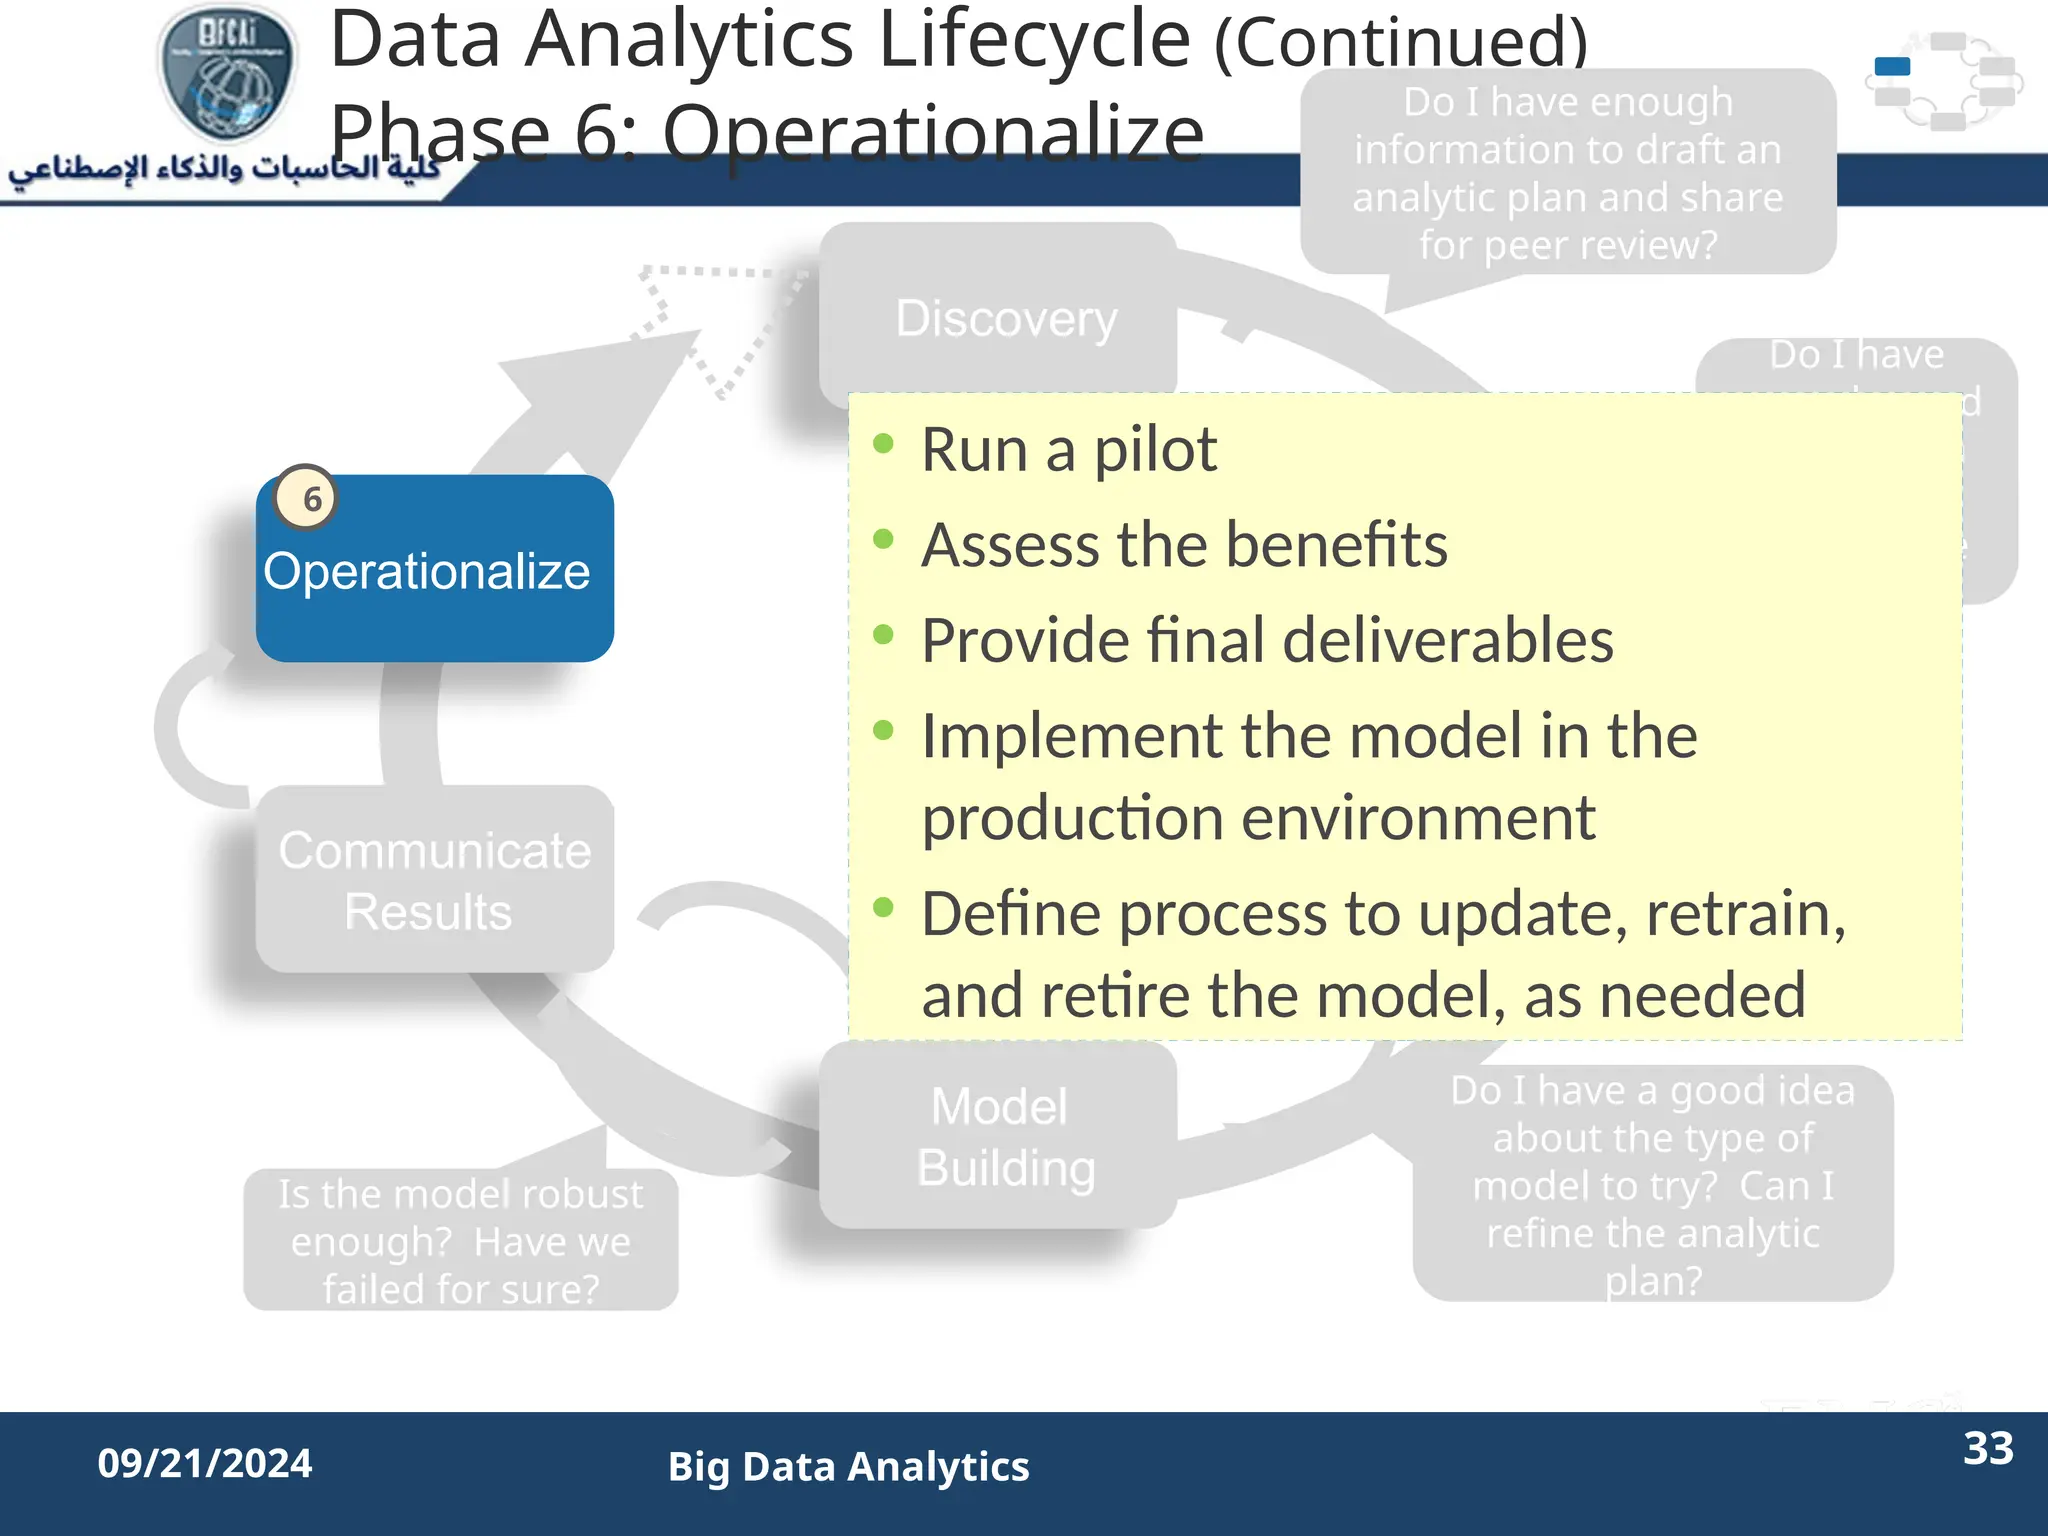
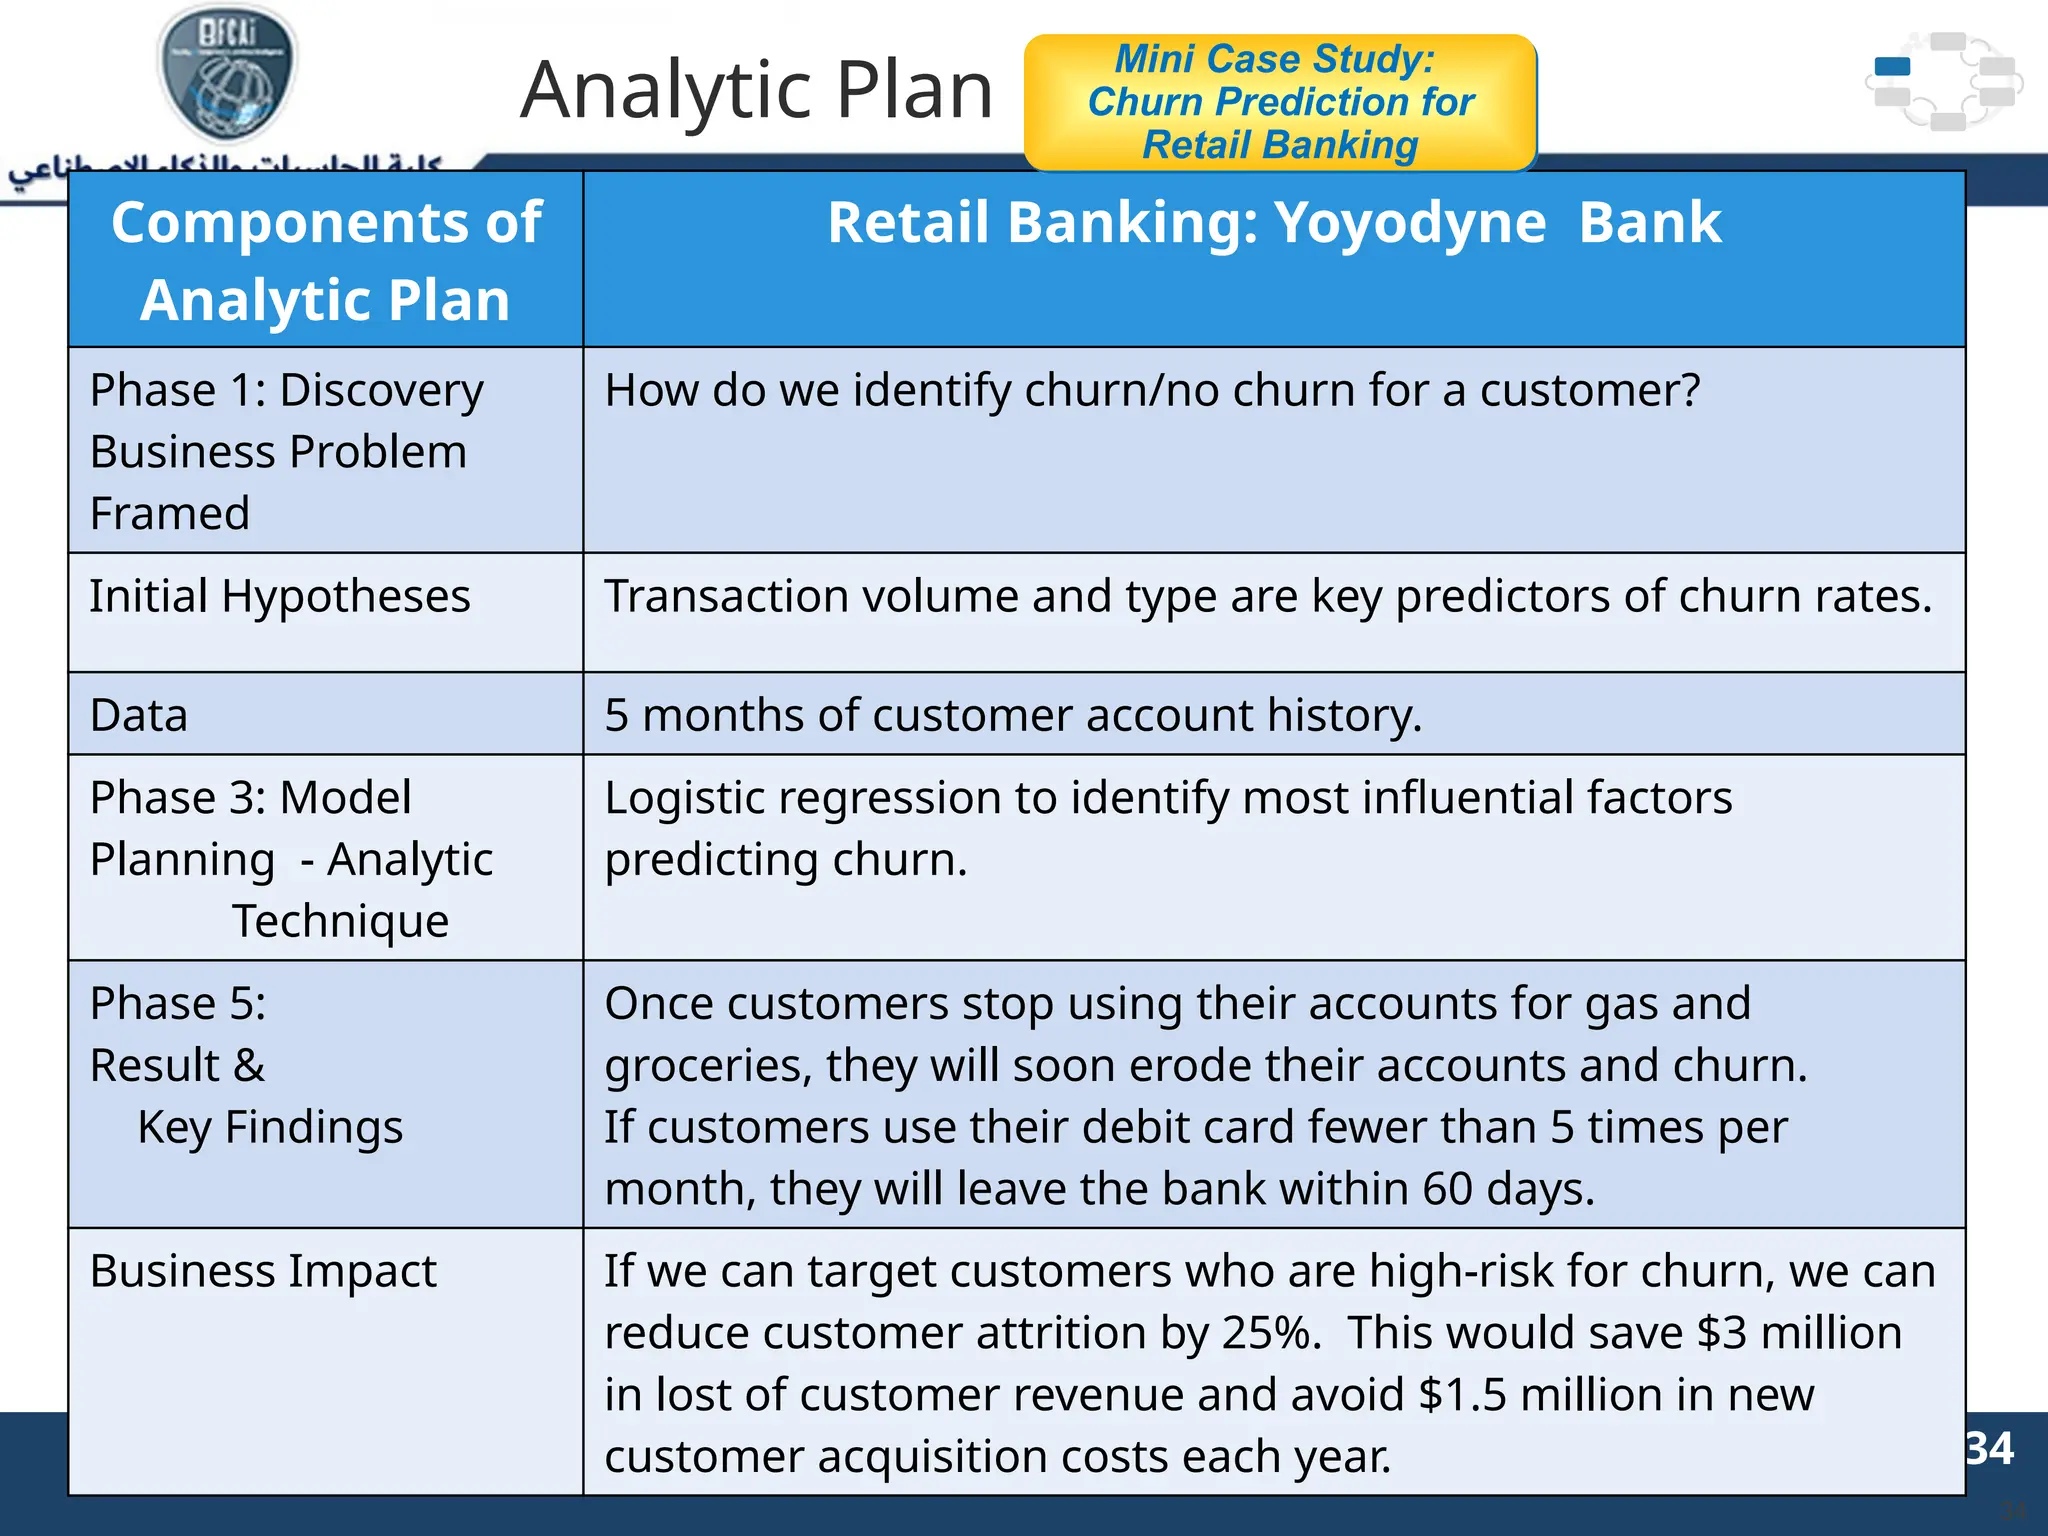
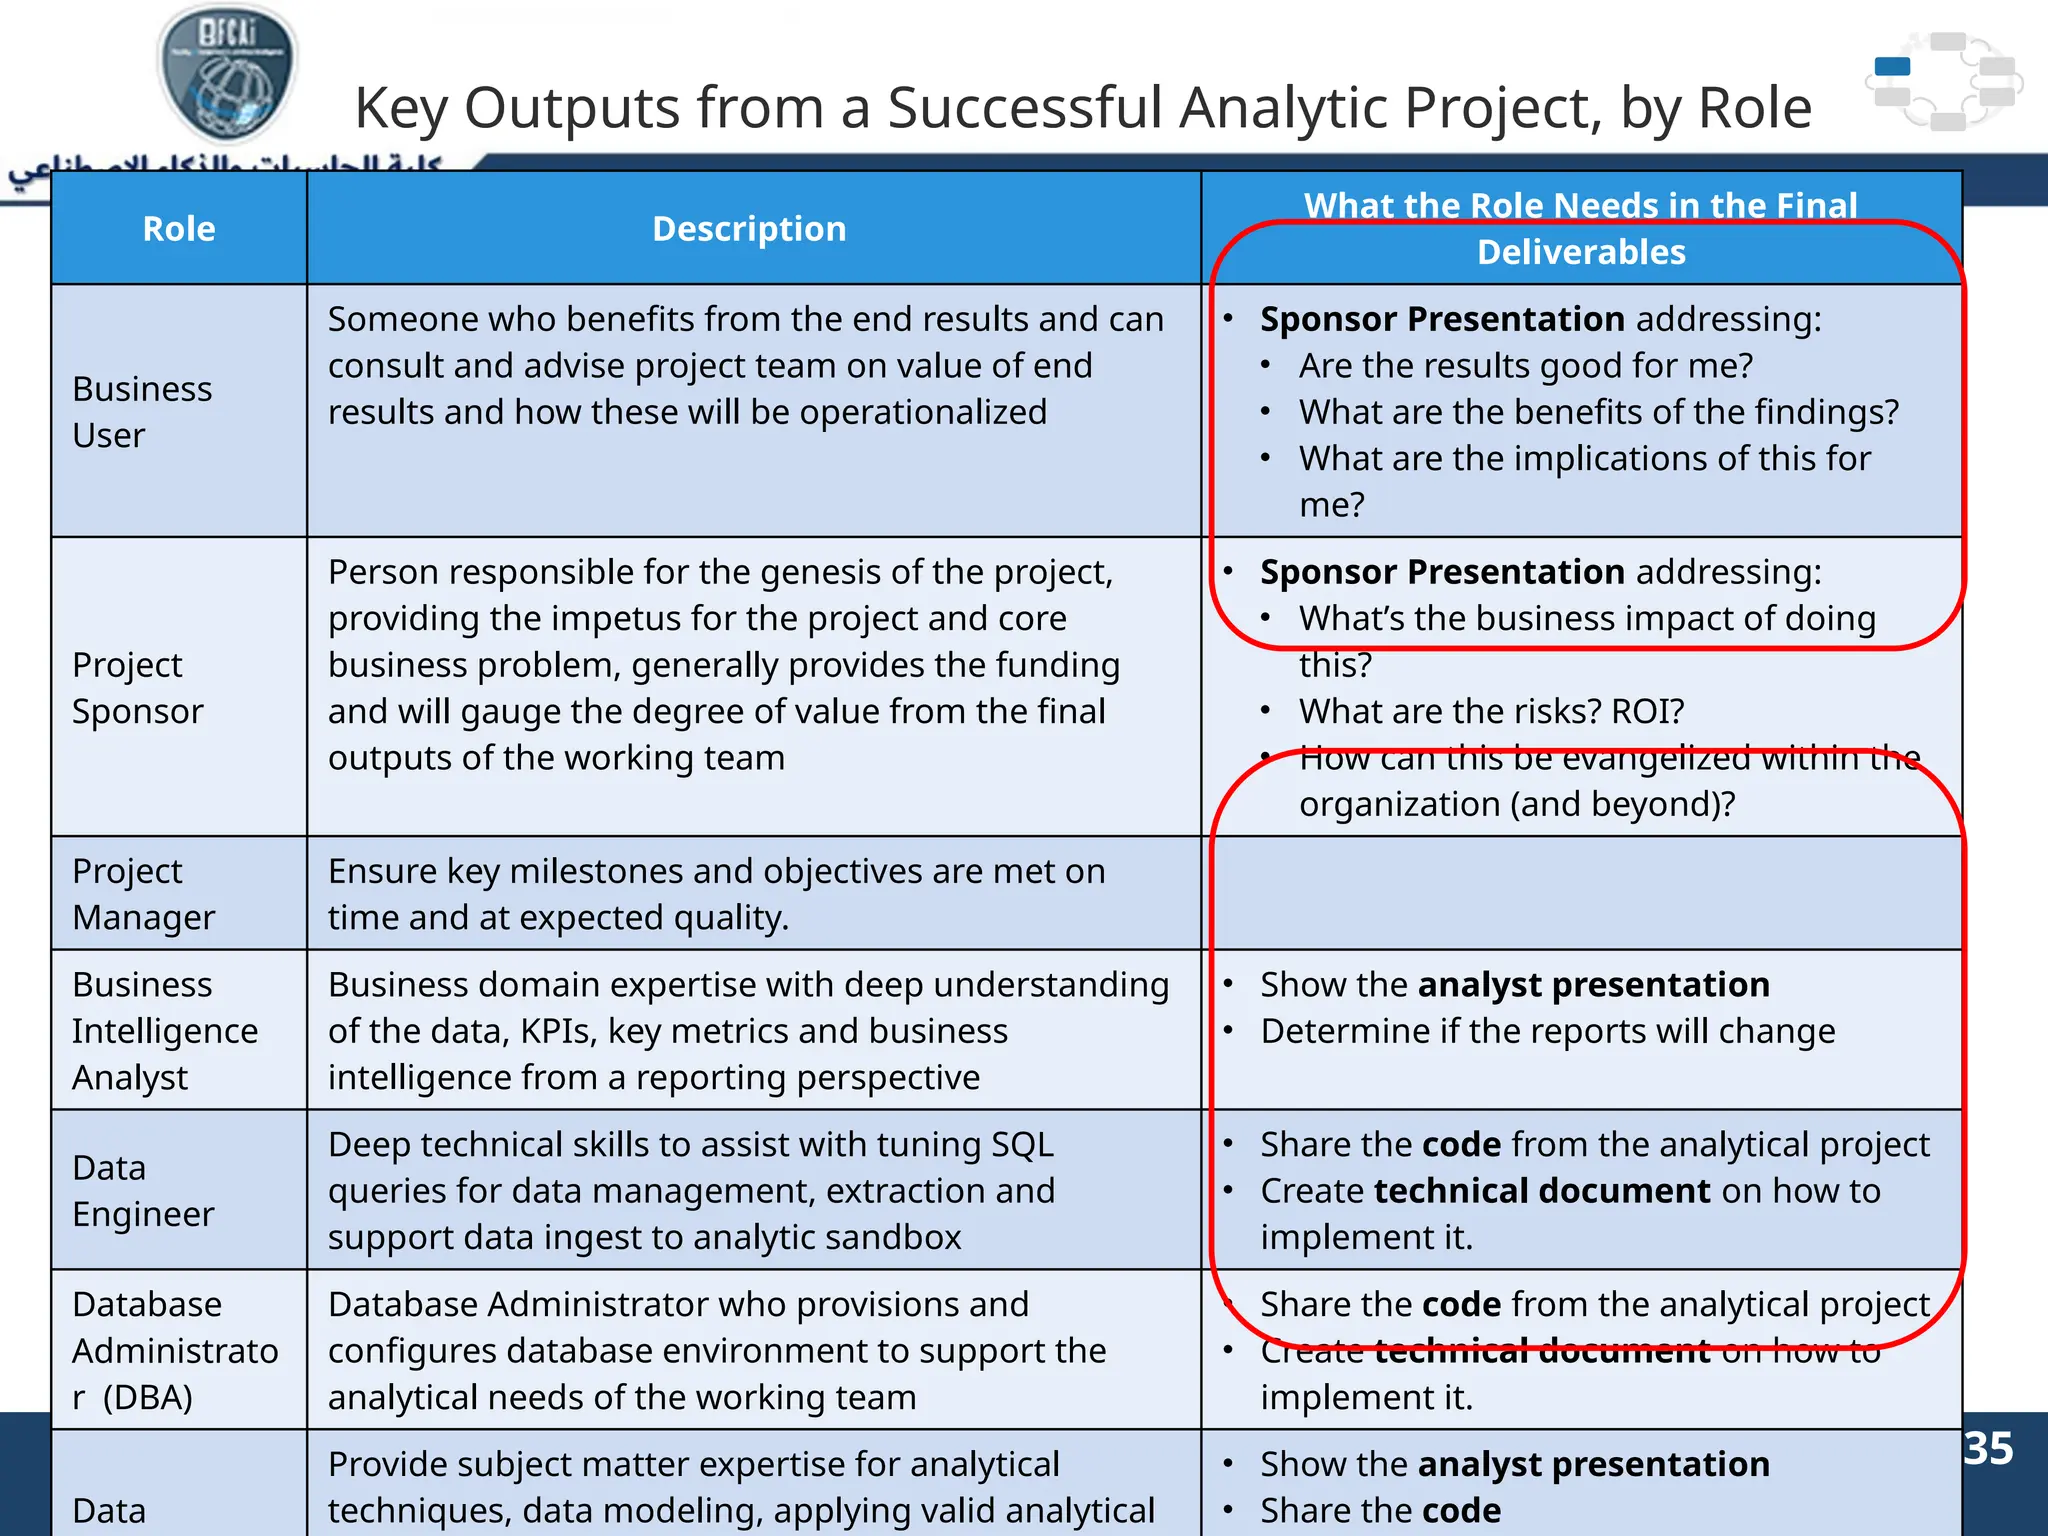
The document outlines the data analytics lifecycle, aimed to teach students the strategic application of analytics in business contexts, particularly in identifying and framing business problems and delivering analytics solutions. It introduces key roles within analytics projects, emphasizes the importance of a structured approach, and discusses phases like discovery, data preparation, and model planning, utilizing case studies for practical insights. Students will learn to apply these concepts to develop actionable analytics strategies, ultimately aiming to improve business metrics such as customer retention.
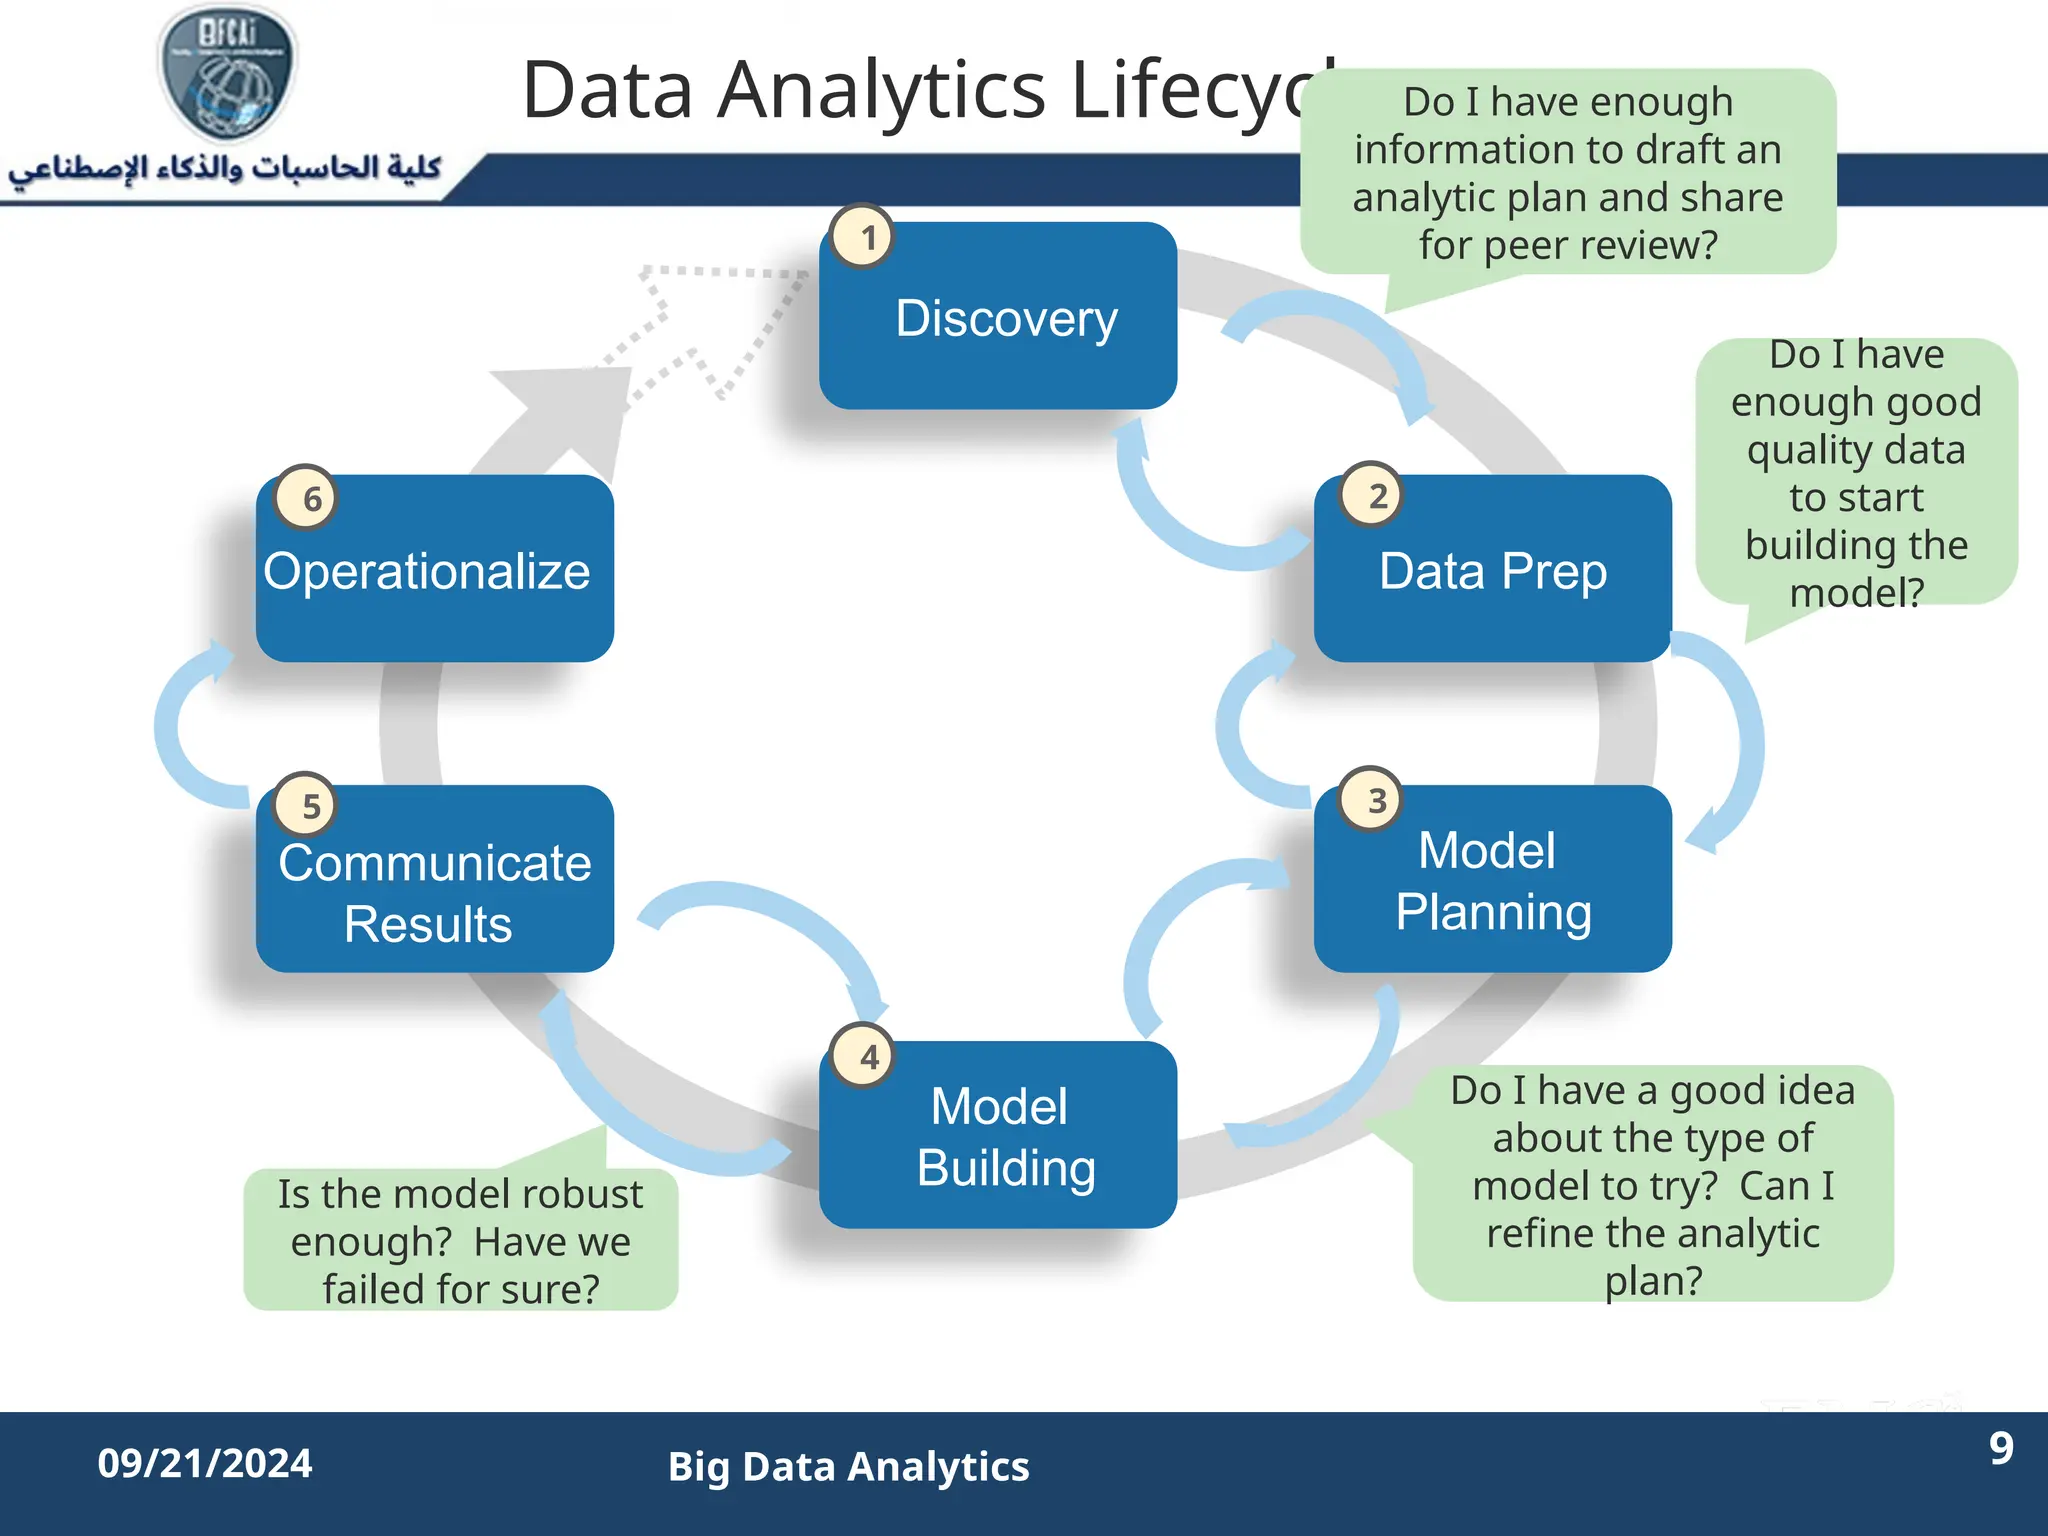

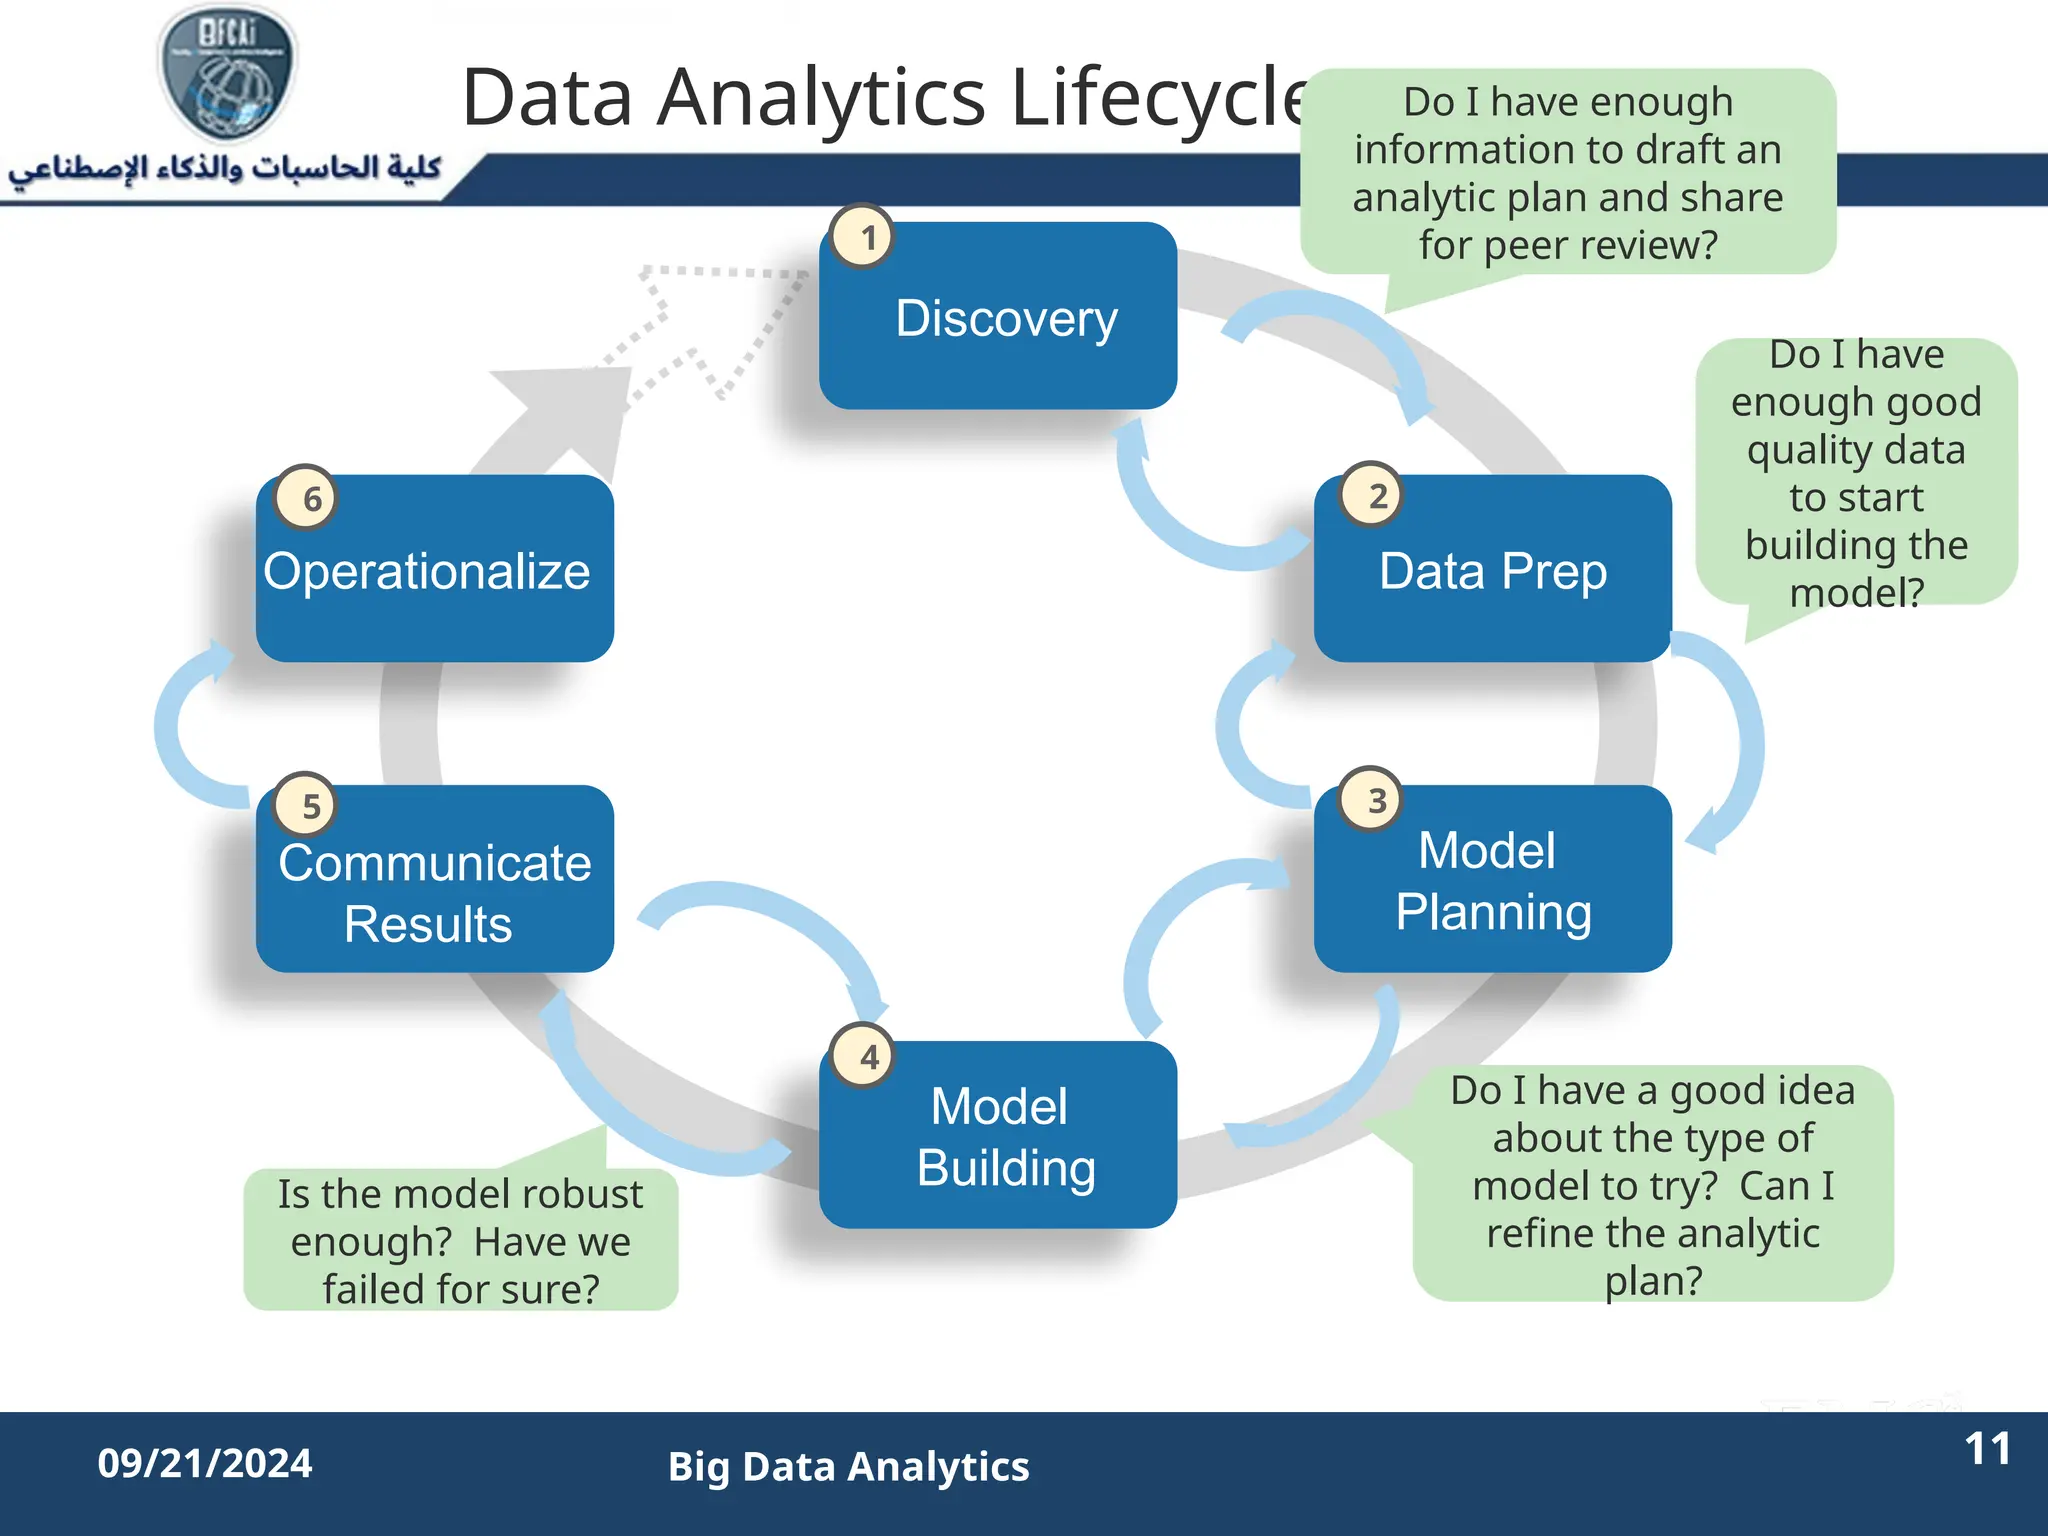


![Data Analytics Life Cycle [EMC² - Data Science and Big data analytics]](https://cdn.slidesharecdn.com/ss_thumbnails/bdalifecycle-slideshare-211028070344-thumbnail.jpg?width=640&height=640&fit=bounds)


![[DSC Europe 25] Nikola Rajovic - Hardware Technologies Under the Hood: RISC-V...](https://cdn.slidesharecdn.com/ss_thumbnails/o2gptrmtoyqndgoshwgq-dsc2025-tenstorrent-rajovic-251205090438-814685f5-thumbnail.jpg?width=640&height=640&fit=bounds)


![[DSC Europe 25] Vid Stimac - Policy Parsimony: Between Oversimplifying and Ov...](https://cdn.slidesharecdn.com/ss_thumbnails/eqlepagzqp2rhg3gbluh-dsc-stimac-251120-251205090438-059e7f54-thumbnail.jpg?width=640&height=640&fit=bounds)
![[DSC Europe 25] Andy Cotgreave - Nothing is new in analytics.pptx](https://cdn.slidesharecdn.com/ss_thumbnails/mba4vzcurvoh5lfrd5zw-6-251205194645-341bbbbe-thumbnail.jpg?width=640&height=640&fit=bounds)


![[DSC Europe 25] Petar Zivanov - AI meets documents From chatbots to AI-powere...](https://cdn.slidesharecdn.com/ss_thumbnails/xer2bb6nrdc8pdpev0pc-8-251204082258-7c2fa4a1-thumbnail.jpg?width=640&height=640&fit=bounds)