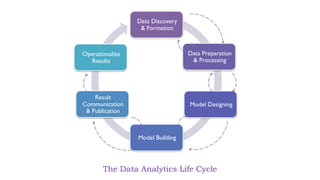
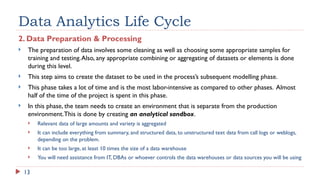
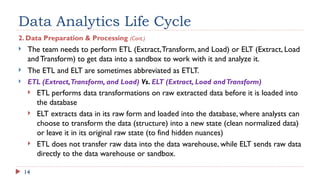
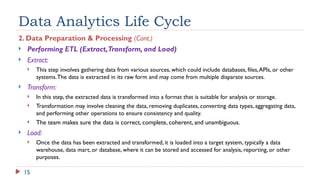
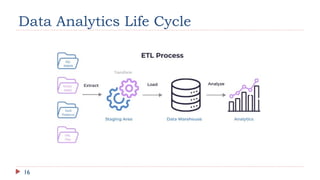
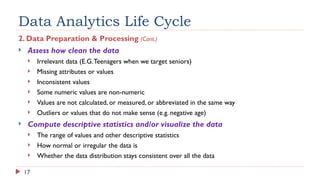
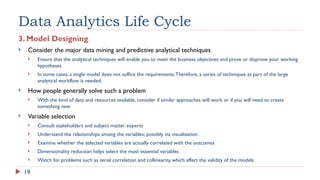
Data Science Methodology
DS103
Unit 3
2
Outline
 Analytics for Data Science
 Data Analytics Life Cycle
3
Analytics for Data Science
 Digital transformation from the last few decades is the reason behind
enormous amounts of data being generated every moment.
 The big data consists of three types: structured, semi-structured, and
unstructured. Remember!What are the differences between them?
 Structured data has a well-defined structure, i.e., in columns and rows. It can be easily managed,
accessible, and used by humans or computers.
 Semi-structured data is a type of structured data that does not adhere to the formal structure in
relational databases or other types of data tables but instead includes tags or other markers to
distinguish semantic elements and maintain hierarchies of record within the data. Such as XML, JSON,
and HTML.
 Unstructured data is very different as it does not follow the structure nor maintain a standard
hierarchy. It is different all the time. But often, it may have details about data and time
4
The 5 V’s of Big Data
 Big data is discussed with five of its characteristics that are known as 5V’s: volume,
velocity, variety, veracity, and value.
 Volume
 Volume is a huge amount of information.
 The size of the data plays a very crucial part
in determining the relevance and importance
of the data.
 This indicates that whether a particular data
should be classified as big data depends on
the amount of the data.
 Example: Global Internet traffic in 2016 was
measured at 6.2 exabytes (6.2 billion GB)
per month. Excelsior,“Big Data, explained:The 5V S of Data,” Medium, https://t.ly/ta6hP
5
The 5 V’s of Big Data
 Velocity
 The term “velocity” refers to the speed of generation of data.
 The data flows in from different sources such as machines, networks, social media, and mobile phones.
 This flow is supposed to be as fast as close to real-time as possible.
 Velocity can give a greater competitive advantage when compared to volume. Sometimes, the need is to get limited
data in real-time rather than getting a bulk of data at low speed.
 Example: More than 3.5 billion searches are made on Google in a day. Facebook users are also rising year by year
by 22% (approx.).
 Variety
 Variety talks about the nature of data. This data might be structured, semi-structured, and unstructured data.
 It also refers to heterogeneous sources.When the data comes from both inside and outside of an enterprise, it
brings variety along with the volume from various resources.
 All types of data like photos, videos, and audio, making about 80% of the data to be completely unstructured and
structured data, are just the tip of the iceberg.
6
The 5 V’s of Big Data
 Veracity
 The data that is collected from a variety of sources in a huge amount at a very high speed makes it
vulnerable to inconsistencies and uncertainty.
 This means the data may get messy. Thus, monitoring the quality and accuracy of the data can be a
challenging task.As we know, a major part of the data is unstructured and irrelevant.
 Therefore, big data needs to be cleaned to make it reliable enough.
 Value
 The data that comes which is so large must be processed to extract the value or knowledge out of it.
 It is not just the volume that matters but also the insights that we derive from it.
 To extract maximum value from Big Data, companies and data scientists need to have a clear goal for
what they want to achieve through their analysis. Once this is established, they can determine which
information needs to be collected and how it will be used.
7
Examples of Data Analytics
 Big data analytics is used in many organizations to generate reports and
dashboards based on huge data of past and present.
 Fraud detection report is commonly used in banking sectors to identify
transactions involving fraud, hacking, unauthorized access to the account, etc.
 Live tracking report that transportation sectors such as Uber, and Careem typically
use to track cars, customer requests, payment processing, emergency warnings, and
find regular needs and revenue, and so on.
 Sales forecast and plan analysis that is often used by all sectors to assess their
customers’ sales, profits, and needs.Also, it is used to evaluate the future target, etc.
 Google Analytics reports that we can get how many users visit count, where the
user is from, which computer the client is using, etc.
8
Data Analytics Life Cycle
 The data analytics life cycle is required for problems related to big data
and data science applications.
 It is a circular process consisting of six basic phases.
 The method is iterative to depict a specific project; the project returns
to an earlier phase as new information is discovered.
 The life cycle of data analytics defines best practices in the analytical
process from discovery to project completion.
Data Discovery
& Formation
Data Preparation
& Processing
Model Designing
Model Building
Result
Communication
& Publication
Operationalize
Results
The Data Analytics Life Cycle
10
Data Analytics Life Cycle
1. Data Discovery
 The first phase of the Data Analytics Lifecycle is the data discovery step.
 Learn about the business domain
 The data science team learns about the business domain, including relevant history such as whether the organization or business
unit has attempted similar projects in the past from which they can learn.
 They can seek help from domain experts.
 Assess available resources & Form the project team
 They assess the resources available to support the project in terms of people, technology, time, and data.
 Whether you have the right mix/breadth (and skills depth) of domain experts, customers, analytic team, and project management
to form an effective team
 Assess and begin learning about the data
 Data characteristics: Structure, types, formats, scope, volume, velocity
 This step involves identifying potential data sources, both internal and external, that are relevant to the business problem at hand.
 This includes gathering data from various databases, applications, and online repositories.
 This step also includes any activities you need to perform to transform existing data if needed
11
Data Analytics Life Cycle
1. Data Discovery (Cont.)
 Frame the problem
 State the analytics problem; clearly articulate the current situation and pain points (to make sure you address them)
 Identify what needs to be achieved in business terms and what needs to be done for this purpose (technical objectives)
 Identify key risks
 Identify key stakeholders, their roles, what they expect from the project, and how they will judge its success
 Identify criteria for success and failure
 Form initial hypotheses
 Form initial hypotheses that you can prove or disprove with the data
 Design your analysis so that it will determine whether to accept or reject this hypothesis.
 Decide in advance what the criteria for accepting or rejecting the hypothesis will be to ensure that your analysis is
rigorous and follows the scientific method.
12
Data Analytics Life Cycle
1. Data Discovery (Cont.)
 You can move to the next phase when you …
 Have a clear understanding of the domain area
 Have a clear understanding of the data to be used and the problem to be solved
 Identify success / failure criteria for the project
 Formulate initial hypotheses
 Have enough information to draft an analytic plan and share it for peer review.
13
Data Analytics Life Cycle
2. Data Preparation & Processing
 The preparation of data involves some cleaning as well as choosing some appropriate samples for
training and testing.Also, any appropriate combining or aggregating of datasets or elements is done
during this level.
 This step aims to create the dataset to be used in the process’s subsequent modelling phase.
 This phase takes a lot of time and is the most labor-intensive as compared to other phases. Almost
half of the time of the project is spent in this phase.
 In this phase, the team needs to create an environment that is separate from the production
environment.This is done by creating an analytical sandbox.
 Relevant data of large amounts and variety is aggregated
 It can include everything from summary, and structured data, to unstructured text data from call logs or weblogs,
depending on the problem.
 It can be too large, at least 10 times the size of a data warehouse
 You will need assistance from IT, DBAs or whoever controls the data warehouses or data sources you will be using
14
Data Analytics Life Cycle
2. Data Preparation & Processing (Cont.)
 The team needs to perform ETL (Extract,Transform, and Load) or ELT (Extract, Load
and Transform) to get data into a sandbox to work with it and analyze it.
 The ETL and ELT are sometimes abbreviated as ETLT.
 ETL (Extract,Transform, and Load) Vs. ELT (Extract, Load andTransform)
 ETL performs data transformations on raw extracted data before it is loaded into
the database
 ELT extracts data in its raw form and loaded into the database, where analysts can
choose to transform the data (structure) into a new state (clean normalized data)
or leave it in its original raw state (to find hidden nuances)
 ETL does not transfer raw data into the data warehouse, while ELT sends raw data
directly to the data warehouse or sandbox.
15
Data Analytics Life Cycle
2. Data Preparation & Processing (Cont.)
 Performing ETL (Extract,Transform, and Load)
 Extract:
 This step involves gathering data from various sources, which could include databases, files,APIs, or other
systems.The data is extracted in its raw form and may come from multiple disparate sources.
 Transform:
 In this step, the extracted data is transformed into a format that is suitable for analysis or storage.
 Transformation may involve cleaning the data, removing duplicates, converting data types, aggregating data,
and performing other operations to ensure consistency and quality.
 The team makes sure the data is correct, complete, coherent, and unambiguous.
 Load:
 Once the data has been extracted and transformed, it is loaded into a target system, typically a data
warehouse, data mart, or database, where it can be stored and accessed for analysis, reporting, or other
purposes.
16
Data Analytics Life Cycle
17
Data Analytics Life Cycle
2. Data Preparation & Processing (Cont.)
 Assess how clean the data
 Irrelevant data (E.G.Teenagers when we target seniors)
 Missing attributes or values
 Inconsistent values
 Some numeric values are non-numeric
 Values are not calculated, or measured, or abbreviated in the same way
 Outliers or values that do not make sense (e.g. negative age)
 Compute descriptive statistics and/or visualize the data
 The range of values and other descriptive statistics
 How normal or irregular the data is
 Whether the data distribution stays consistent over all the data
18
Data Analytics Life Cycle
2. Data Preparation & Processing (Cont.)
 You can move to the next phase when you …
 Have enough good-quality data to start building the model
19
Data Analytics Life Cycle
3. Model Designing
 Consider the major data mining and predictive analytical techniques
 Ensure that the analytical techniques will enable you to meet the business objectives and prove or disprove your working
hypotheses
 In some cases, a single model does not suffice the requirements.Therefore, a series of techniques as part of the large
analytical workflow is needed.
 How people generally solve such a problem
 With the kind of data and resources available, consider if similar approaches will work or if you will need to create
something new
 Variable selection
 Consult stakeholders and subject matter experts
 Understand the relationships among the variables; possibly via visualization
 Examine whether the selected variables are actually correlated with the outcomes
 Dimensionality reduction helps select the most essential variables
 Watch for problems such as serial correlation and collinearity, which affect the validity of the models
20
Data Analytics Life Cycle
3. Model Designing (Cont.)
 Model selection
 The main goal of this sub-step is to choose an analytical technique, or a short-list of candidate techniques
based on the end of the project or the purpose of analysis, for example, exploratory or prediction.
 For the selection of a model, the types of input and output variables play an important role.
 The team has to decide whether they should use one single model or a series of models depending on the
type of analysis they are doing.
 After selecting the model, a proper analytical tool is to be determined to fit the selected model.
 It is often useful to revisit the analytic challenge at this stage of the project and to ensure that the analytic
challenge is still relevant and that there is not any scope creep in the project.
21
Data Analytics Life Cycle
3. Model Designing (Cont.)
 You can move to the next phase when you …
 Have a good idea about the model to try (solid understanding of the variables and techniques to use, and
a general methodology)
 Have an analytic plan; a description or diagramming of the analytic workflow
22
Data Analytics Life Cycle
4. Model Building
 In the model-building phase, the selected analytical technique is applied to a set of training data.This
process is known as “training the model”.
 A separate set of data, known as the testing data, is then used to evaluate how well the model
performs.This is sometimes known as the pilot test.
 Often, the fitted model is to be applied to future observations. So, it is not typically sufficient to
obtain the best model that explains all of the data; one must build a model that adequately predicts
the future.
23
Data Analytics Life Cycle
4. Model Building (Cont.)
 models that are appropriate for a particular situation require careful attention to ensure that the
models that are being built eventually follow the goals outlined in Phase 1. Questions to be
considered include the following:
 Does the model appear valid and accurate on the test data?
 Does the output/behavior of the model make sense to domain experts? In other words, does it seem as though the model
provides answers that make sense in this context?
 Do the parameter values of the fitted model make sense in the context of the domain?
 Is the model sufficiently accurate to meet the goal?
 Does the model avoid intolerable mistakes?
 Are more data or more inputs needed? Do any of the inputs need to be transformed or eliminated?
 Will the kind of model chosen support the runtime requirements?
 Is a different form of the model required to address the business problem? If so, go back to the model planning phase and
revise the modeling approach.
24
Data Analytics Life Cycle
4. Model Building (Cont.)
 You can move to the next phase when you …
 can gauge if the model you’ve developed is robust enough
 or if you have failed for sure
25
Data Analytics Life Cycle
5. Result Communication & Publication
 After obtaining an acceptable model, the team has to communicate the project’s findings and the business value
of the model to the sponsors and the stakeholders.
 If the desired business outcome is not obtained, this result also must be communicated.
 Assess and interpret the results
 What are the 3 most significant findings?
 Compare the outcomes to the criteria for success and failure
 Which data points are surprising, and which are in line with the hypotheses developed in Phase 1
 Make sure to consider and include warnings, assumptions, and any limitations of results
 It is important to remind the audience about the business problem and the scope of the project.
 The team has to build a strategy to communicate the findings, by including caveats, assumptions, and any
limitations of results.
 They also add recommendations for future work or improvements to the existing processes
 It is important to use imagery when possible; people tend to remember mental pictures to demonstrate a point
more than long lists of bullets
26
Data Analytics Life Cycle
6. Operationalization
 When the stakeholders agree to implement the model in the production environment, the operationalization
phase begins.
 Depending on the organization, the project team may be responsible for the model’s implementation or may
simply transfer the code and other technical documentation to a different team.
 During this phase, it is important to establish the approach to monitor the performance of the model after it is
placed into production.
 It is common to run a pilot program before fully implementing the model in production. Running a pilot helps
minimize risk and further demonstrates the business value.
 Testing the model in a live setting allows the team to learn from the deployment and make necessary
adjustments before launching across the enterprise.
 After the model is placed into production, it is often necessary to monitor the model’s performance and
establish a process to retrain and update the model.
 Any further communication of results often occurs during the operationalization phase; the executives will be
interested in knowing the return on investment from their investment.
27
Data Analytics Life Cycle
Notes about the Life Cycle
 The phases do not have the same duration and do not have to proceed strictly in order
 Of all the phases, Data Preparation (Phase 2) is generally the most iterative and time-intensive.
 Plan to spend more time in Discovery and Data Preparation (Phases 1-2) and Communicating
Results (Phase 5)
 Model Planning and Model Building (Phases 3-4) overlap quite a bit, and in practice one can iterate
back and forth between the two phases for a while before settling on a final model
 Model Planning and Model Building (Phases 3-4) tend to move more quickly, although more complex
from a conceptual point of view
 There are many versions of the Data Science Lifecycle, where each step may have different names
and number of stages but will contain the same processes mentioned within this lesson.
 Team Data Science Process (TDSP)
 Cross-industry standard process for data mining (CRISP-DM)
Any Questions?

DS103 - Unit03DS103 - Unit03DS103 - Unit03.pptx

  • 1.
  • 2.
    2 Outline  Analytics forData Science  Data Analytics Life Cycle
  • 3.
    3 Analytics for DataScience  Digital transformation from the last few decades is the reason behind enormous amounts of data being generated every moment.  The big data consists of three types: structured, semi-structured, and unstructured. Remember!What are the differences between them?  Structured data has a well-defined structure, i.e., in columns and rows. It can be easily managed, accessible, and used by humans or computers.  Semi-structured data is a type of structured data that does not adhere to the formal structure in relational databases or other types of data tables but instead includes tags or other markers to distinguish semantic elements and maintain hierarchies of record within the data. Such as XML, JSON, and HTML.  Unstructured data is very different as it does not follow the structure nor maintain a standard hierarchy. It is different all the time. But often, it may have details about data and time
  • 4.
    4 The 5 V’sof Big Data  Big data is discussed with five of its characteristics that are known as 5V’s: volume, velocity, variety, veracity, and value.  Volume  Volume is a huge amount of information.  The size of the data plays a very crucial part in determining the relevance and importance of the data.  This indicates that whether a particular data should be classified as big data depends on the amount of the data.  Example: Global Internet traffic in 2016 was measured at 6.2 exabytes (6.2 billion GB) per month. Excelsior,“Big Data, explained:The 5V S of Data,” Medium, https://t.ly/ta6hP
  • 5.
    5 The 5 V’sof Big Data  Velocity  The term “velocity” refers to the speed of generation of data.  The data flows in from different sources such as machines, networks, social media, and mobile phones.  This flow is supposed to be as fast as close to real-time as possible.  Velocity can give a greater competitive advantage when compared to volume. Sometimes, the need is to get limited data in real-time rather than getting a bulk of data at low speed.  Example: More than 3.5 billion searches are made on Google in a day. Facebook users are also rising year by year by 22% (approx.).  Variety  Variety talks about the nature of data. This data might be structured, semi-structured, and unstructured data.  It also refers to heterogeneous sources.When the data comes from both inside and outside of an enterprise, it brings variety along with the volume from various resources.  All types of data like photos, videos, and audio, making about 80% of the data to be completely unstructured and structured data, are just the tip of the iceberg.
  • 6.
    6 The 5 V’sof Big Data  Veracity  The data that is collected from a variety of sources in a huge amount at a very high speed makes it vulnerable to inconsistencies and uncertainty.  This means the data may get messy. Thus, monitoring the quality and accuracy of the data can be a challenging task.As we know, a major part of the data is unstructured and irrelevant.  Therefore, big data needs to be cleaned to make it reliable enough.  Value  The data that comes which is so large must be processed to extract the value or knowledge out of it.  It is not just the volume that matters but also the insights that we derive from it.  To extract maximum value from Big Data, companies and data scientists need to have a clear goal for what they want to achieve through their analysis. Once this is established, they can determine which information needs to be collected and how it will be used.
  • 7.
    7 Examples of DataAnalytics  Big data analytics is used in many organizations to generate reports and dashboards based on huge data of past and present.  Fraud detection report is commonly used in banking sectors to identify transactions involving fraud, hacking, unauthorized access to the account, etc.  Live tracking report that transportation sectors such as Uber, and Careem typically use to track cars, customer requests, payment processing, emergency warnings, and find regular needs and revenue, and so on.  Sales forecast and plan analysis that is often used by all sectors to assess their customers’ sales, profits, and needs.Also, it is used to evaluate the future target, etc.  Google Analytics reports that we can get how many users visit count, where the user is from, which computer the client is using, etc.
  • 8.
    8 Data Analytics LifeCycle  The data analytics life cycle is required for problems related to big data and data science applications.  It is a circular process consisting of six basic phases.  The method is iterative to depict a specific project; the project returns to an earlier phase as new information is discovered.  The life cycle of data analytics defines best practices in the analytical process from discovery to project completion.
  • 9.
    Data Discovery & Formation DataPreparation & Processing Model Designing Model Building Result Communication & Publication Operationalize Results The Data Analytics Life Cycle
  • 10.
    10 Data Analytics LifeCycle 1. Data Discovery  The first phase of the Data Analytics Lifecycle is the data discovery step.  Learn about the business domain  The data science team learns about the business domain, including relevant history such as whether the organization or business unit has attempted similar projects in the past from which they can learn.  They can seek help from domain experts.  Assess available resources & Form the project team  They assess the resources available to support the project in terms of people, technology, time, and data.  Whether you have the right mix/breadth (and skills depth) of domain experts, customers, analytic team, and project management to form an effective team  Assess and begin learning about the data  Data characteristics: Structure, types, formats, scope, volume, velocity  This step involves identifying potential data sources, both internal and external, that are relevant to the business problem at hand.  This includes gathering data from various databases, applications, and online repositories.  This step also includes any activities you need to perform to transform existing data if needed
  • 11.
    11 Data Analytics LifeCycle 1. Data Discovery (Cont.)  Frame the problem  State the analytics problem; clearly articulate the current situation and pain points (to make sure you address them)  Identify what needs to be achieved in business terms and what needs to be done for this purpose (technical objectives)  Identify key risks  Identify key stakeholders, their roles, what they expect from the project, and how they will judge its success  Identify criteria for success and failure  Form initial hypotheses  Form initial hypotheses that you can prove or disprove with the data  Design your analysis so that it will determine whether to accept or reject this hypothesis.  Decide in advance what the criteria for accepting or rejecting the hypothesis will be to ensure that your analysis is rigorous and follows the scientific method.
  • 12.
    12 Data Analytics LifeCycle 1. Data Discovery (Cont.)  You can move to the next phase when you …  Have a clear understanding of the domain area  Have a clear understanding of the data to be used and the problem to be solved  Identify success / failure criteria for the project  Formulate initial hypotheses  Have enough information to draft an analytic plan and share it for peer review.
  • 13.
    13 Data Analytics LifeCycle 2. Data Preparation & Processing  The preparation of data involves some cleaning as well as choosing some appropriate samples for training and testing.Also, any appropriate combining or aggregating of datasets or elements is done during this level.  This step aims to create the dataset to be used in the process’s subsequent modelling phase.  This phase takes a lot of time and is the most labor-intensive as compared to other phases. Almost half of the time of the project is spent in this phase.  In this phase, the team needs to create an environment that is separate from the production environment.This is done by creating an analytical sandbox.  Relevant data of large amounts and variety is aggregated  It can include everything from summary, and structured data, to unstructured text data from call logs or weblogs, depending on the problem.  It can be too large, at least 10 times the size of a data warehouse  You will need assistance from IT, DBAs or whoever controls the data warehouses or data sources you will be using
  • 14.
    14 Data Analytics LifeCycle 2. Data Preparation & Processing (Cont.)  The team needs to perform ETL (Extract,Transform, and Load) or ELT (Extract, Load and Transform) to get data into a sandbox to work with it and analyze it.  The ETL and ELT are sometimes abbreviated as ETLT.  ETL (Extract,Transform, and Load) Vs. ELT (Extract, Load andTransform)  ETL performs data transformations on raw extracted data before it is loaded into the database  ELT extracts data in its raw form and loaded into the database, where analysts can choose to transform the data (structure) into a new state (clean normalized data) or leave it in its original raw state (to find hidden nuances)  ETL does not transfer raw data into the data warehouse, while ELT sends raw data directly to the data warehouse or sandbox.
  • 15.
    15 Data Analytics LifeCycle 2. Data Preparation & Processing (Cont.)  Performing ETL (Extract,Transform, and Load)  Extract:  This step involves gathering data from various sources, which could include databases, files,APIs, or other systems.The data is extracted in its raw form and may come from multiple disparate sources.  Transform:  In this step, the extracted data is transformed into a format that is suitable for analysis or storage.  Transformation may involve cleaning the data, removing duplicates, converting data types, aggregating data, and performing other operations to ensure consistency and quality.  The team makes sure the data is correct, complete, coherent, and unambiguous.  Load:  Once the data has been extracted and transformed, it is loaded into a target system, typically a data warehouse, data mart, or database, where it can be stored and accessed for analysis, reporting, or other purposes.
  • 16.
  • 17.
    17 Data Analytics LifeCycle 2. Data Preparation & Processing (Cont.)  Assess how clean the data  Irrelevant data (E.G.Teenagers when we target seniors)  Missing attributes or values  Inconsistent values  Some numeric values are non-numeric  Values are not calculated, or measured, or abbreviated in the same way  Outliers or values that do not make sense (e.g. negative age)  Compute descriptive statistics and/or visualize the data  The range of values and other descriptive statistics  How normal or irregular the data is  Whether the data distribution stays consistent over all the data
  • 18.
    18 Data Analytics LifeCycle 2. Data Preparation & Processing (Cont.)  You can move to the next phase when you …  Have enough good-quality data to start building the model
  • 19.
    19 Data Analytics LifeCycle 3. Model Designing  Consider the major data mining and predictive analytical techniques  Ensure that the analytical techniques will enable you to meet the business objectives and prove or disprove your working hypotheses  In some cases, a single model does not suffice the requirements.Therefore, a series of techniques as part of the large analytical workflow is needed.  How people generally solve such a problem  With the kind of data and resources available, consider if similar approaches will work or if you will need to create something new  Variable selection  Consult stakeholders and subject matter experts  Understand the relationships among the variables; possibly via visualization  Examine whether the selected variables are actually correlated with the outcomes  Dimensionality reduction helps select the most essential variables  Watch for problems such as serial correlation and collinearity, which affect the validity of the models
  • 20.
    20 Data Analytics LifeCycle 3. Model Designing (Cont.)  Model selection  The main goal of this sub-step is to choose an analytical technique, or a short-list of candidate techniques based on the end of the project or the purpose of analysis, for example, exploratory or prediction.  For the selection of a model, the types of input and output variables play an important role.  The team has to decide whether they should use one single model or a series of models depending on the type of analysis they are doing.  After selecting the model, a proper analytical tool is to be determined to fit the selected model.  It is often useful to revisit the analytic challenge at this stage of the project and to ensure that the analytic challenge is still relevant and that there is not any scope creep in the project.
  • 21.
    21 Data Analytics LifeCycle 3. Model Designing (Cont.)  You can move to the next phase when you …  Have a good idea about the model to try (solid understanding of the variables and techniques to use, and a general methodology)  Have an analytic plan; a description or diagramming of the analytic workflow
  • 22.
    22 Data Analytics LifeCycle 4. Model Building  In the model-building phase, the selected analytical technique is applied to a set of training data.This process is known as “training the model”.  A separate set of data, known as the testing data, is then used to evaluate how well the model performs.This is sometimes known as the pilot test.  Often, the fitted model is to be applied to future observations. So, it is not typically sufficient to obtain the best model that explains all of the data; one must build a model that adequately predicts the future.
  • 23.
    23 Data Analytics LifeCycle 4. Model Building (Cont.)  models that are appropriate for a particular situation require careful attention to ensure that the models that are being built eventually follow the goals outlined in Phase 1. Questions to be considered include the following:  Does the model appear valid and accurate on the test data?  Does the output/behavior of the model make sense to domain experts? In other words, does it seem as though the model provides answers that make sense in this context?  Do the parameter values of the fitted model make sense in the context of the domain?  Is the model sufficiently accurate to meet the goal?  Does the model avoid intolerable mistakes?  Are more data or more inputs needed? Do any of the inputs need to be transformed or eliminated?  Will the kind of model chosen support the runtime requirements?  Is a different form of the model required to address the business problem? If so, go back to the model planning phase and revise the modeling approach.
  • 24.
    24 Data Analytics LifeCycle 4. Model Building (Cont.)  You can move to the next phase when you …  can gauge if the model you’ve developed is robust enough  or if you have failed for sure
  • 25.
    25 Data Analytics LifeCycle 5. Result Communication & Publication  After obtaining an acceptable model, the team has to communicate the project’s findings and the business value of the model to the sponsors and the stakeholders.  If the desired business outcome is not obtained, this result also must be communicated.  Assess and interpret the results  What are the 3 most significant findings?  Compare the outcomes to the criteria for success and failure  Which data points are surprising, and which are in line with the hypotheses developed in Phase 1  Make sure to consider and include warnings, assumptions, and any limitations of results  It is important to remind the audience about the business problem and the scope of the project.  The team has to build a strategy to communicate the findings, by including caveats, assumptions, and any limitations of results.  They also add recommendations for future work or improvements to the existing processes  It is important to use imagery when possible; people tend to remember mental pictures to demonstrate a point more than long lists of bullets
  • 26.
    26 Data Analytics LifeCycle 6. Operationalization  When the stakeholders agree to implement the model in the production environment, the operationalization phase begins.  Depending on the organization, the project team may be responsible for the model’s implementation or may simply transfer the code and other technical documentation to a different team.  During this phase, it is important to establish the approach to monitor the performance of the model after it is placed into production.  It is common to run a pilot program before fully implementing the model in production. Running a pilot helps minimize risk and further demonstrates the business value.  Testing the model in a live setting allows the team to learn from the deployment and make necessary adjustments before launching across the enterprise.  After the model is placed into production, it is often necessary to monitor the model’s performance and establish a process to retrain and update the model.  Any further communication of results often occurs during the operationalization phase; the executives will be interested in knowing the return on investment from their investment.
  • 27.
    27 Data Analytics LifeCycle Notes about the Life Cycle  The phases do not have the same duration and do not have to proceed strictly in order  Of all the phases, Data Preparation (Phase 2) is generally the most iterative and time-intensive.  Plan to spend more time in Discovery and Data Preparation (Phases 1-2) and Communicating Results (Phase 5)  Model Planning and Model Building (Phases 3-4) overlap quite a bit, and in practice one can iterate back and forth between the two phases for a while before settling on a final model  Model Planning and Model Building (Phases 3-4) tend to move more quickly, although more complex from a conceptual point of view  There are many versions of the Data Science Lifecycle, where each step may have different names and number of stages but will contain the same processes mentioned within this lesson.  Team Data Science Process (TDSP)  Cross-industry standard process for data mining (CRISP-DM)
  • 28.