Download to read offline


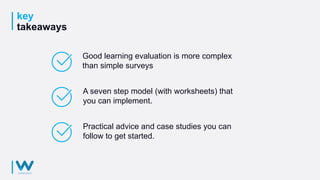


The document outlines key takeaways for effective learning evaluation that goes beyond simple surveys, introducing a seven-step model for implementation. It discusses various evaluation models, including Kirkpatrick, Phillips, Kaufman, Anderson, and Brinkerhoff, emphasizing the importance of aligning learning goals with organizational priorities and utilizing metrics effectively. Practical advice, case studies, and resources to get started with evaluation in learning and development are also provided.


