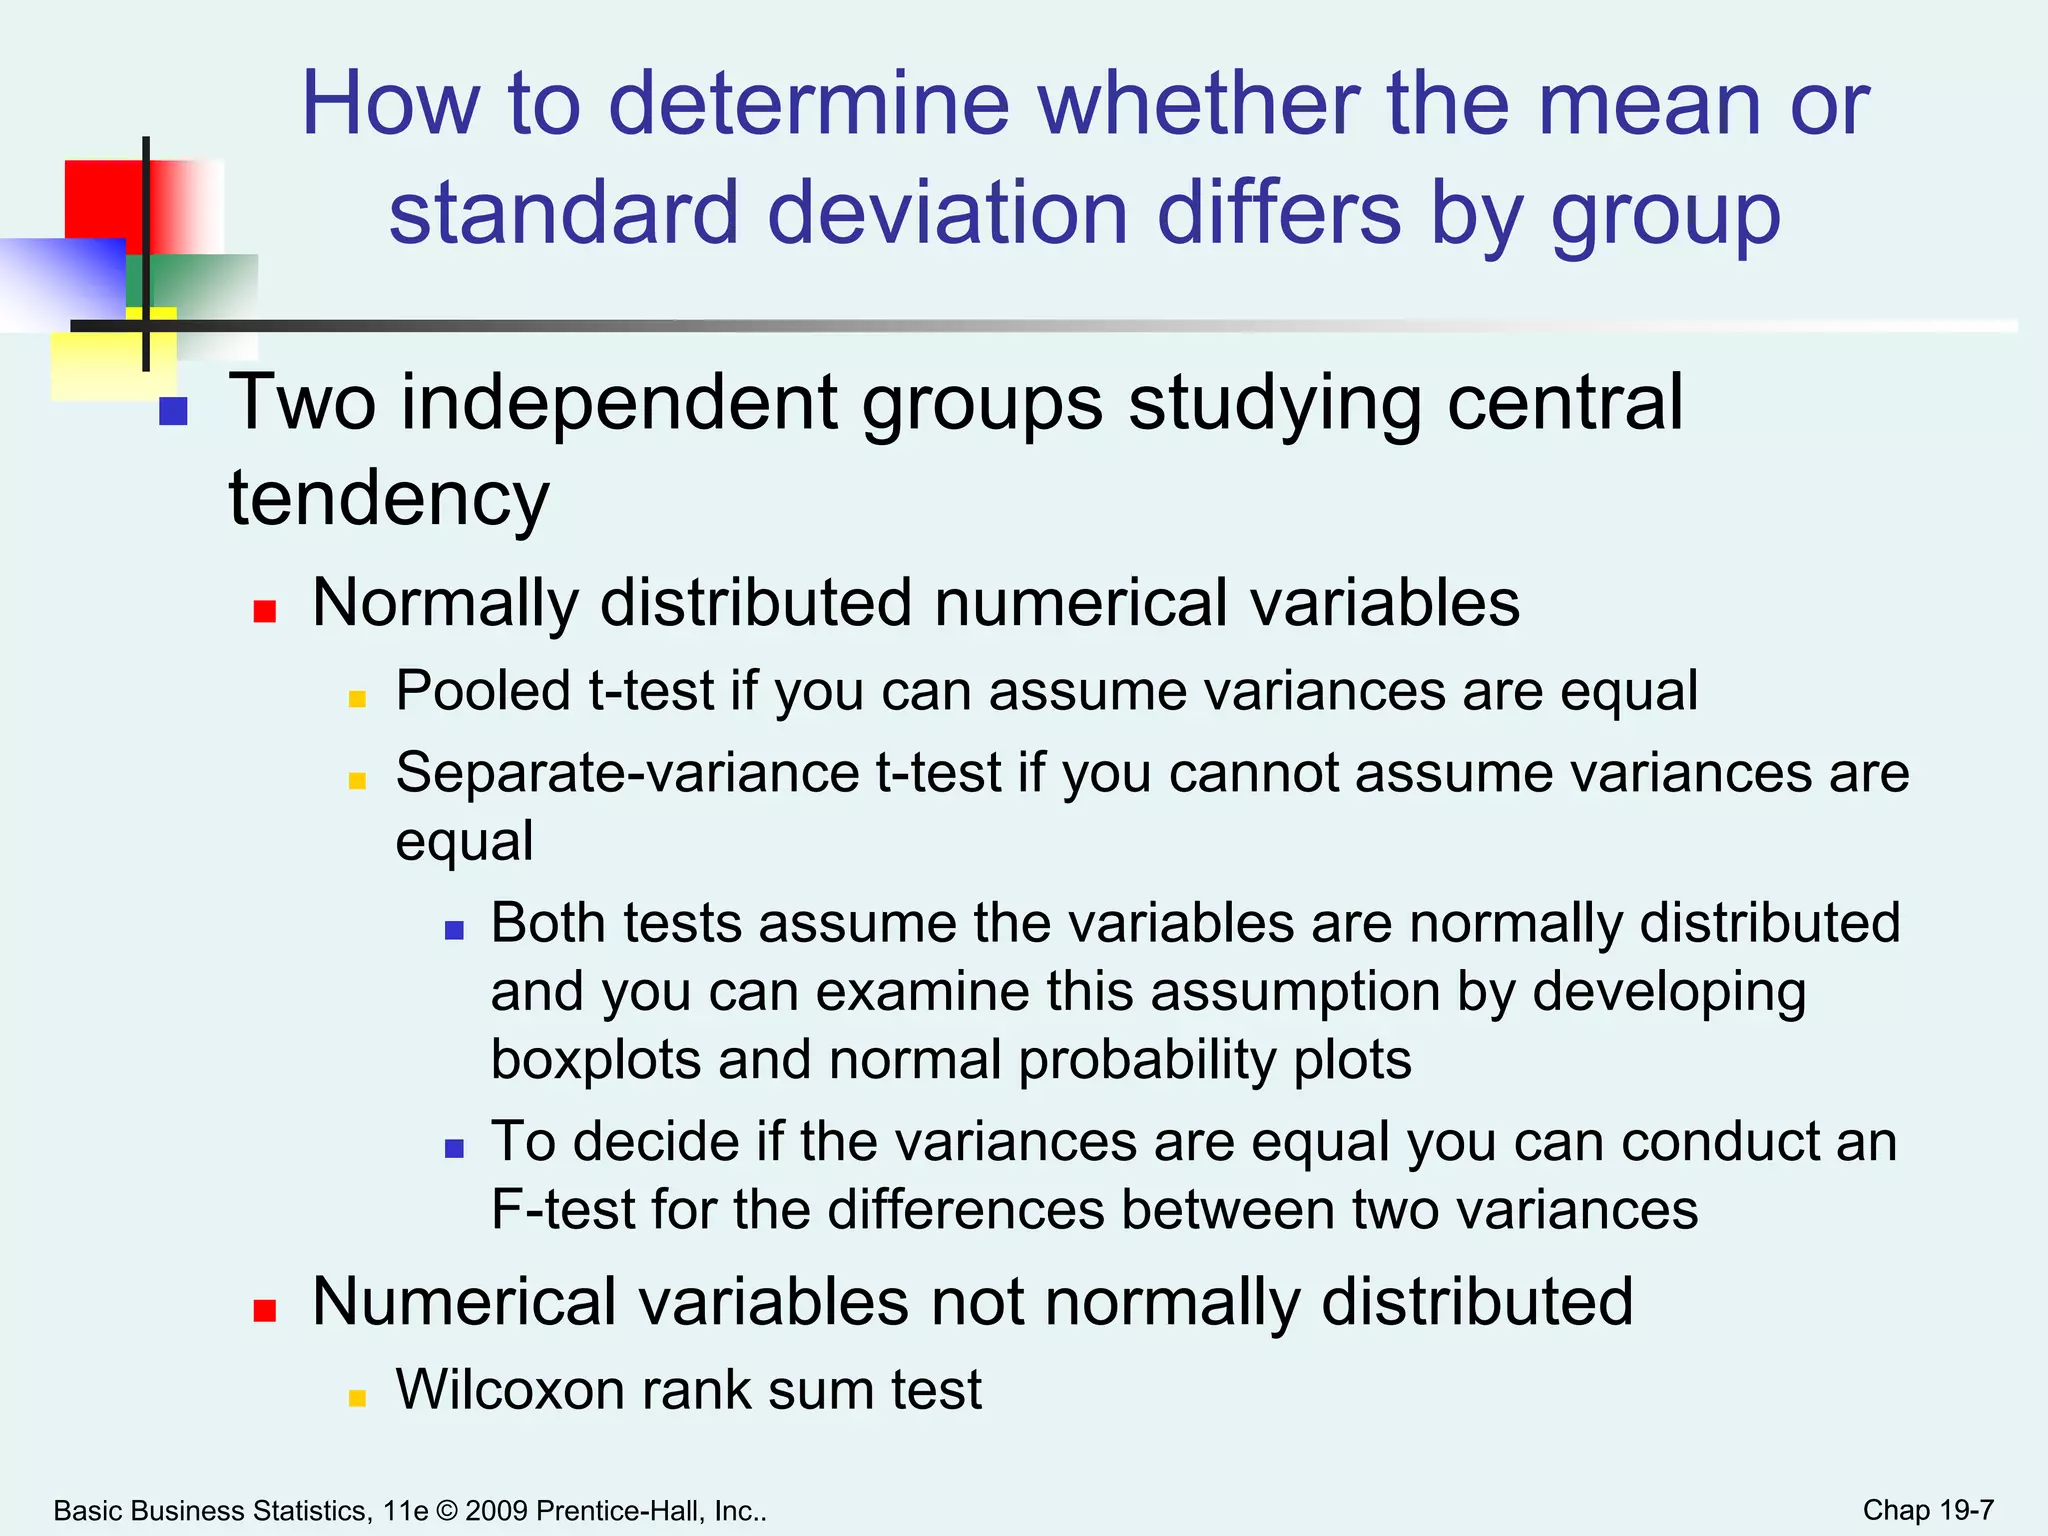
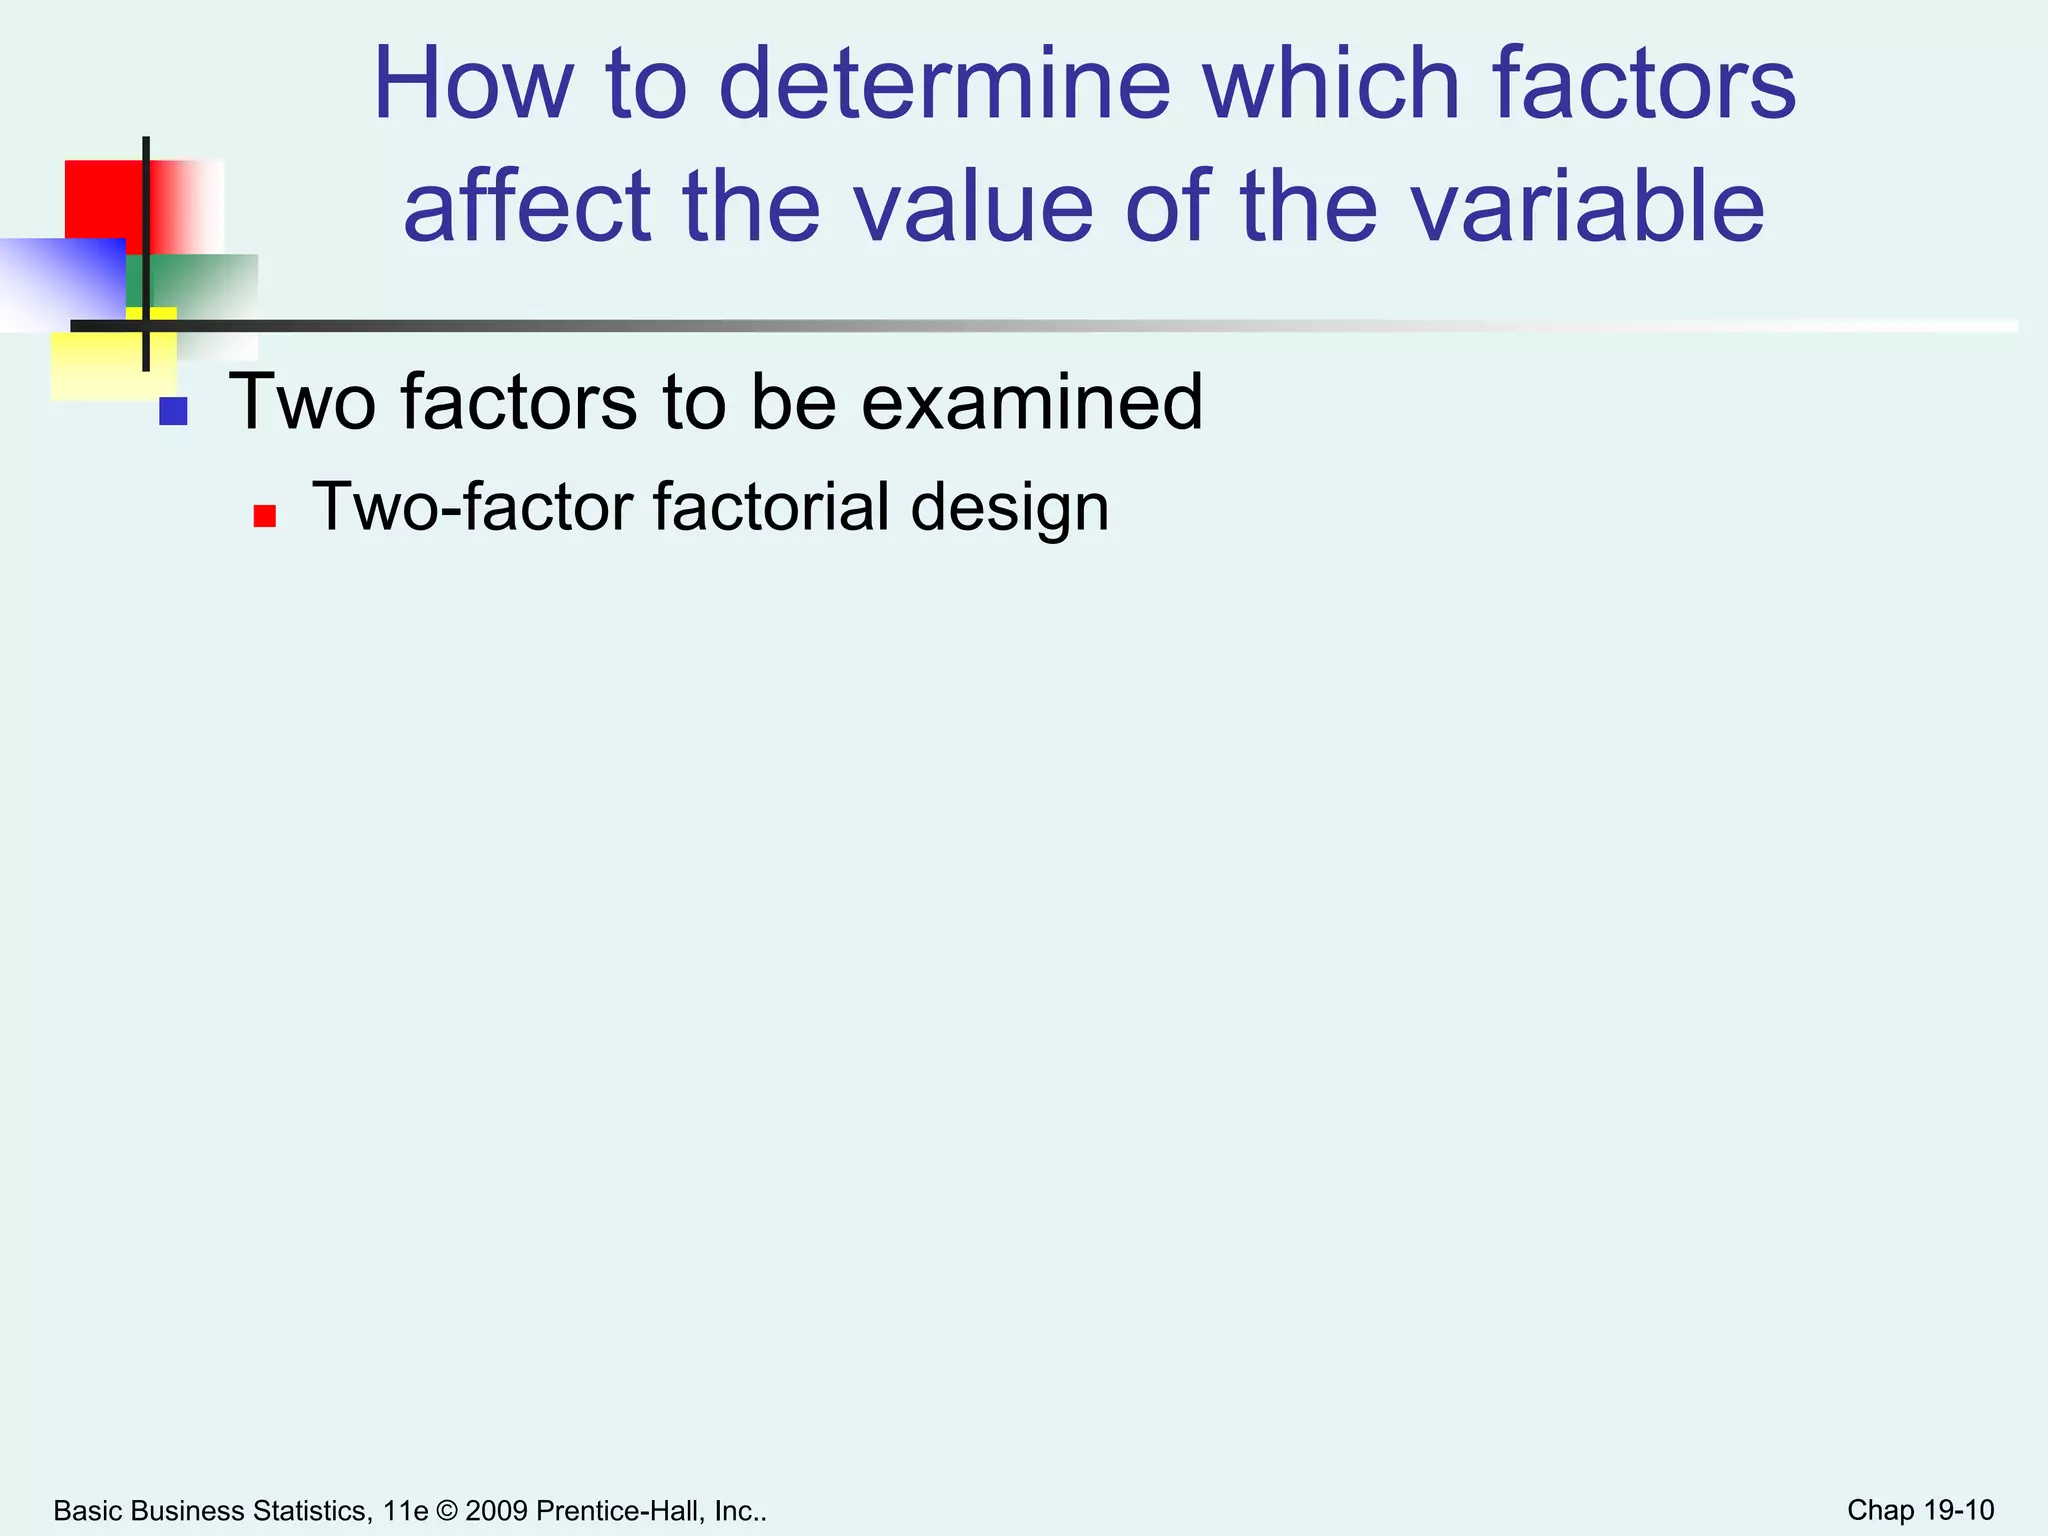
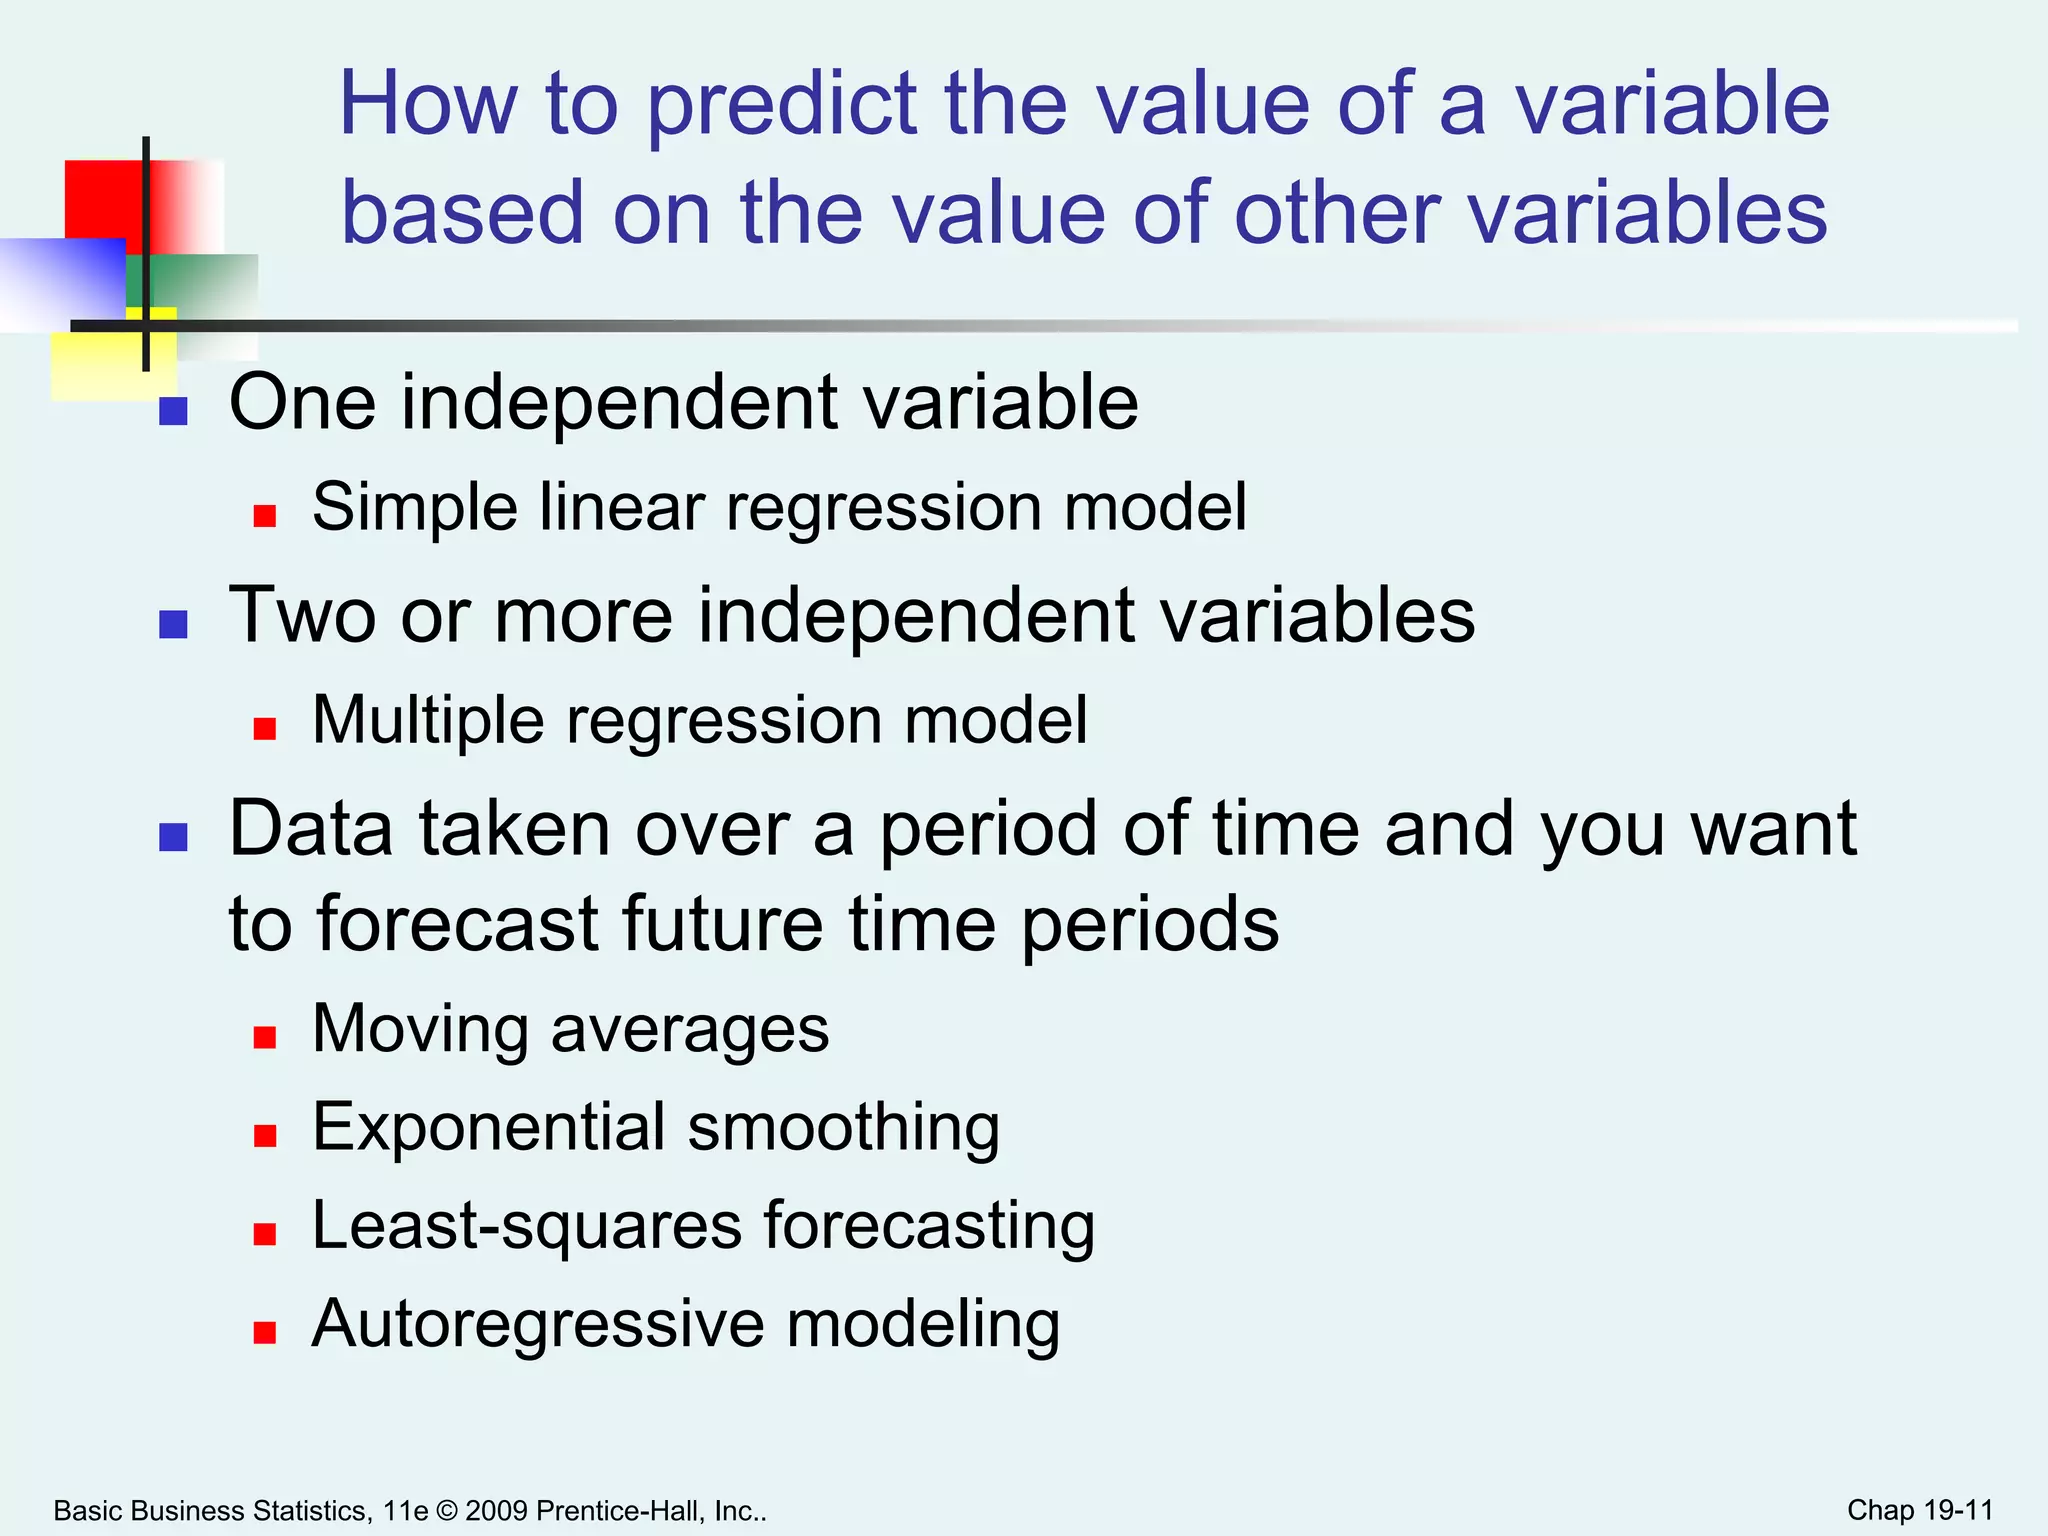
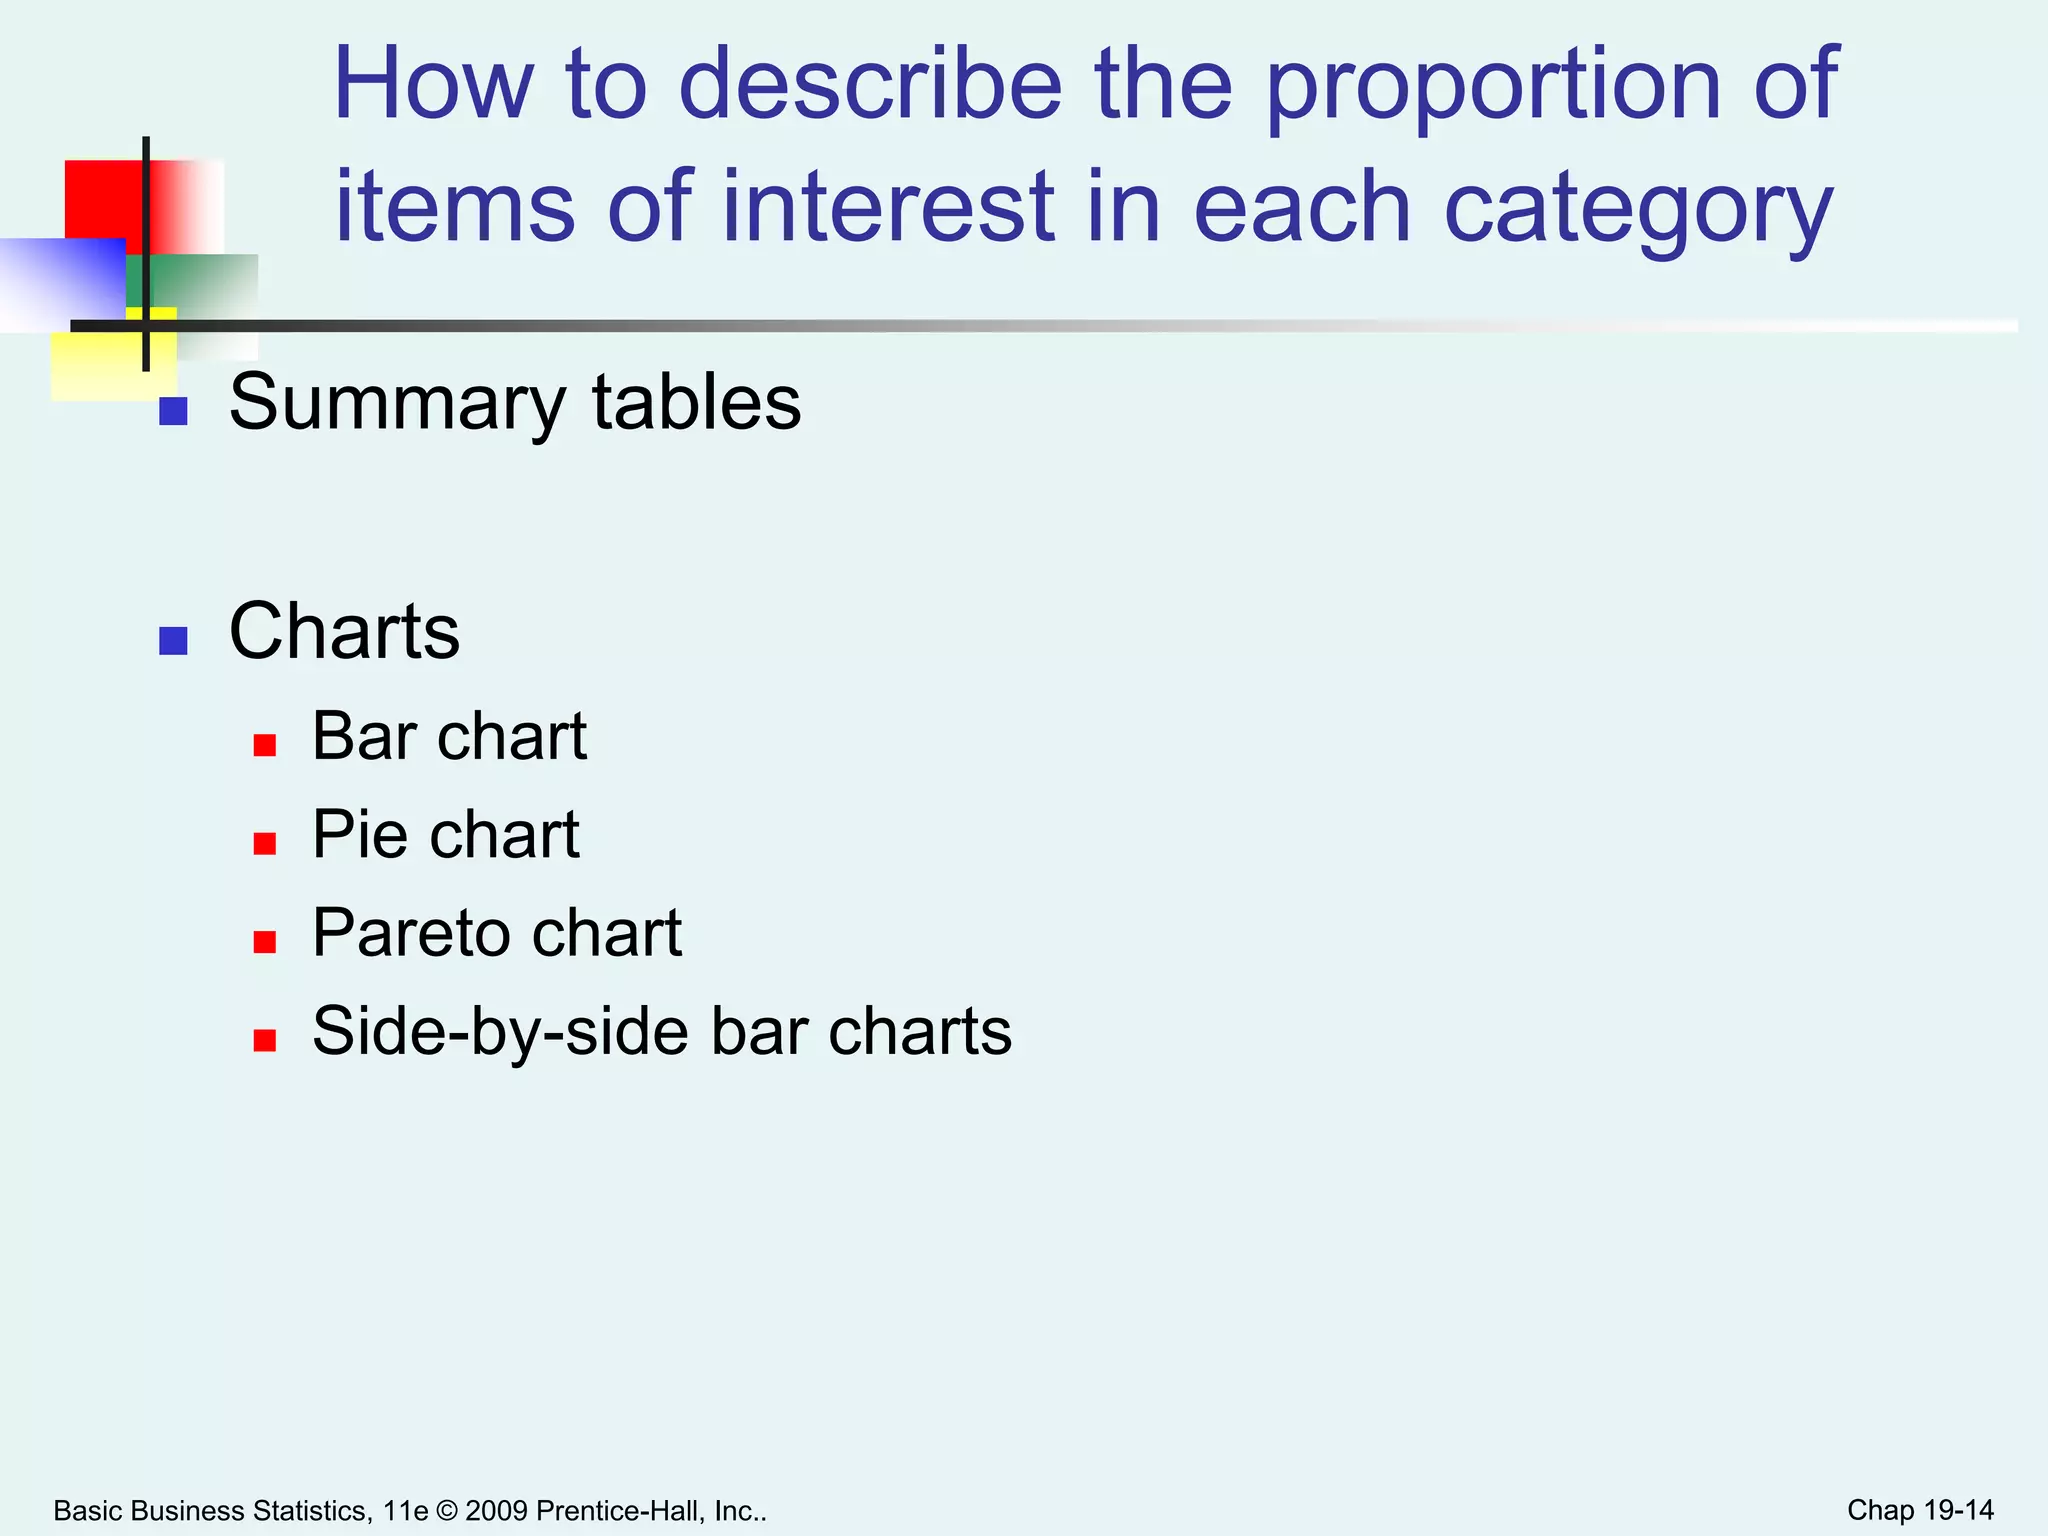
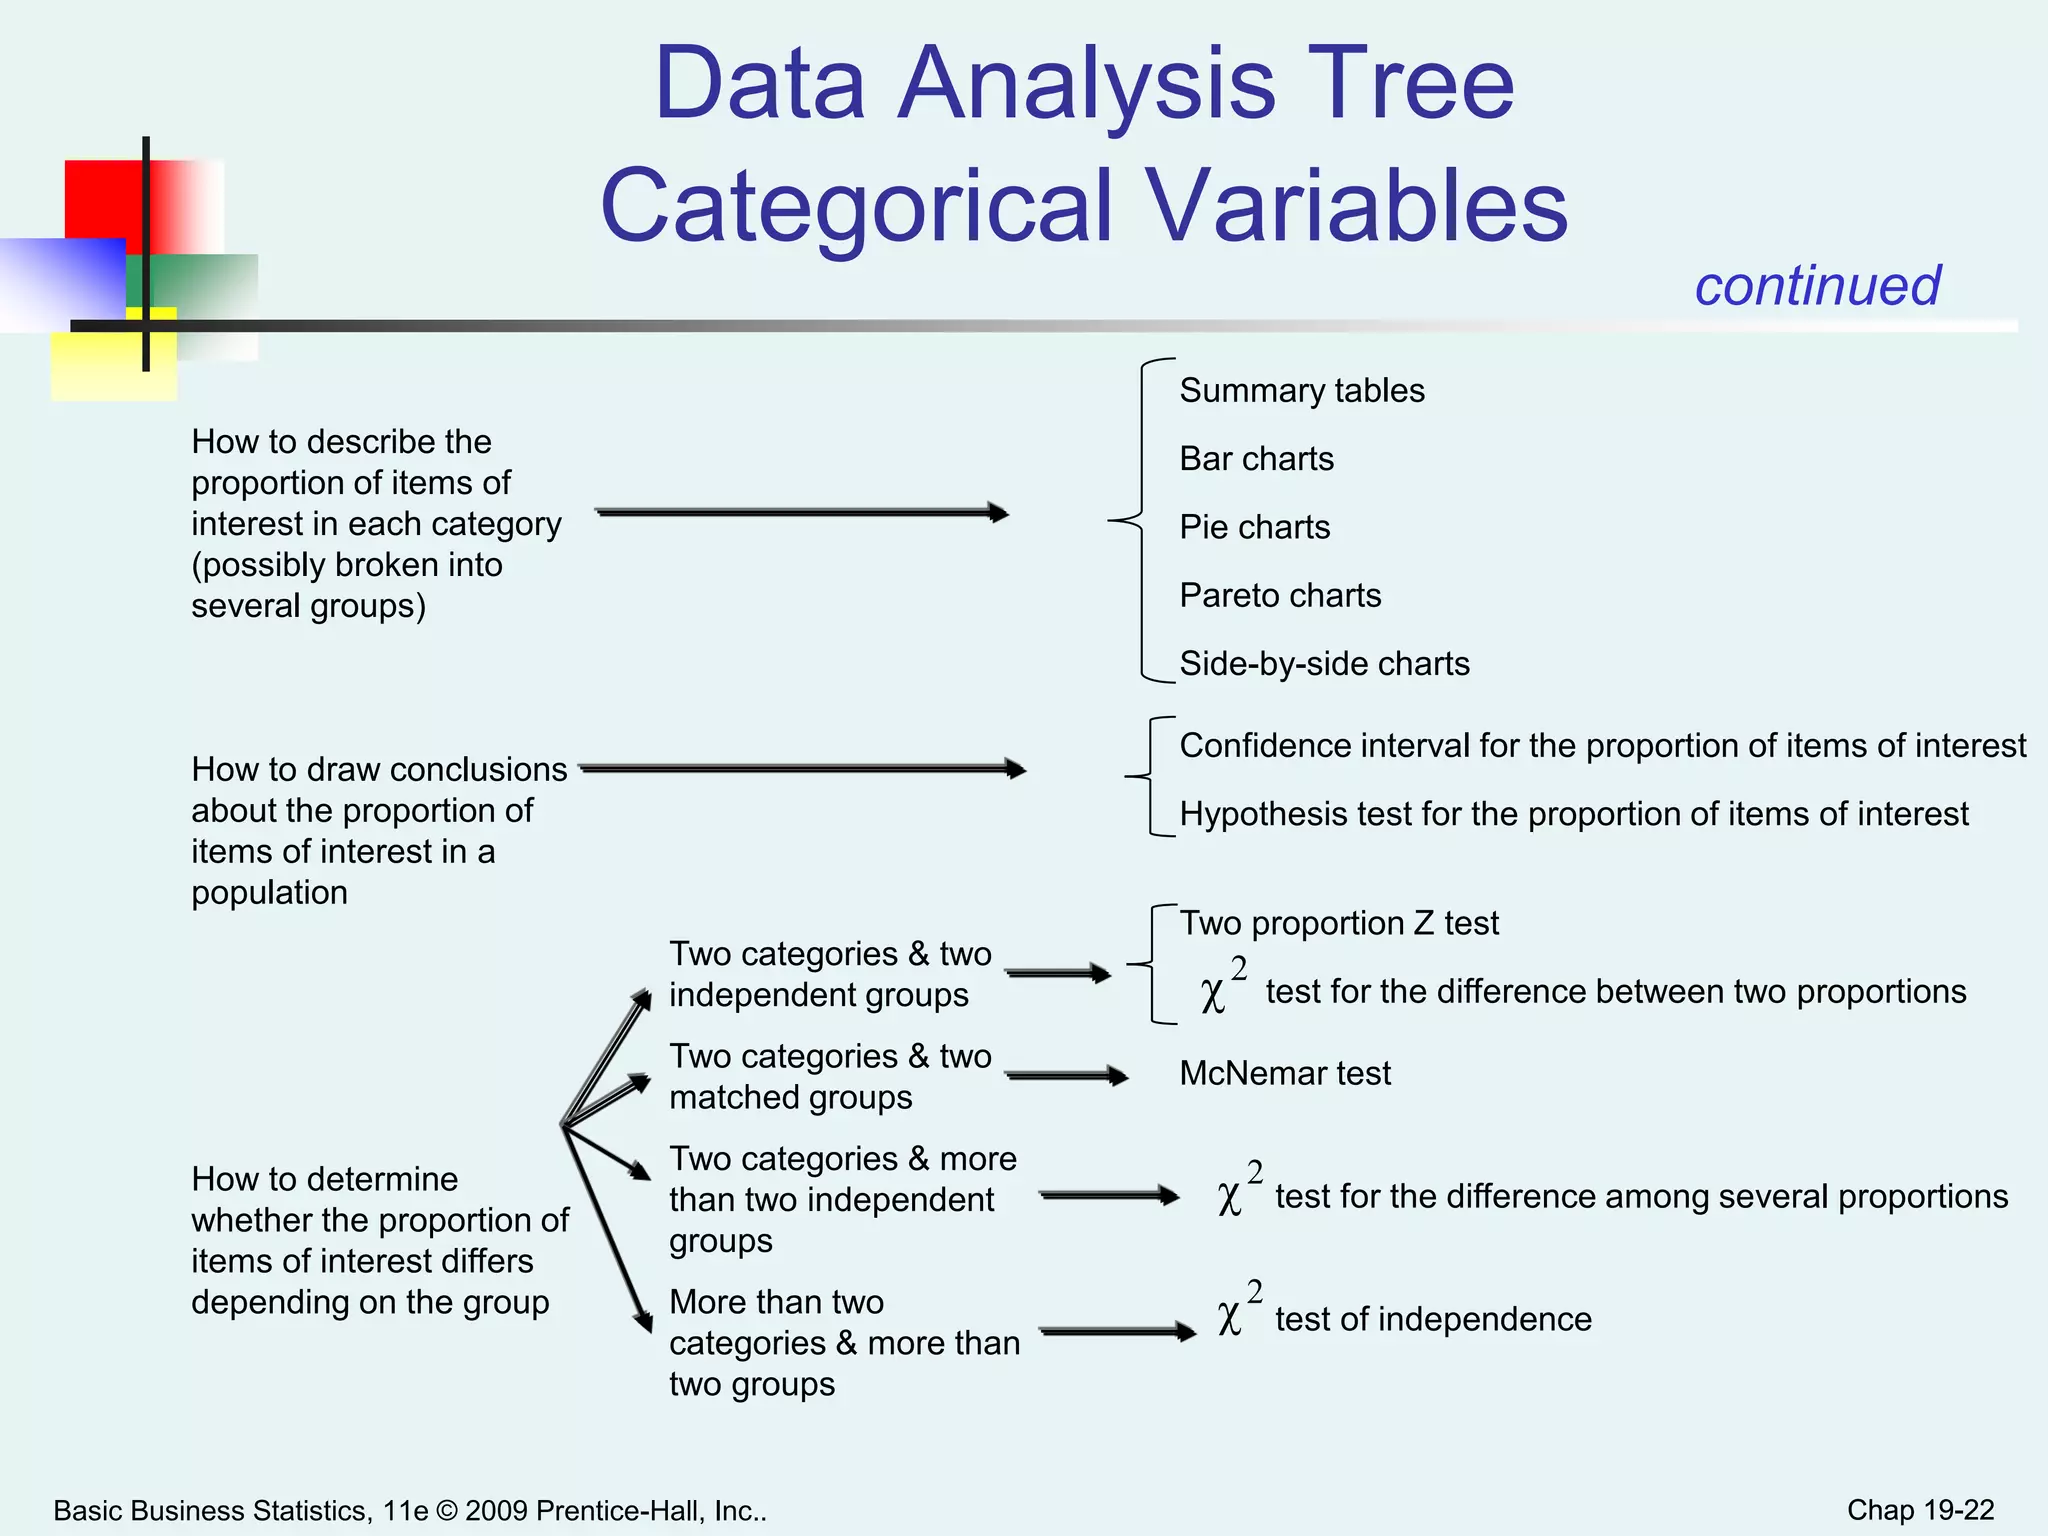
Chap 19-1Basic Business Statistics, 11e © 2009 Prentice-Hall, Inc. Chap 19-1
Chapter 19
Data Analysis Overview
Basic Business Statistics
11th Edition
Chap 19-2Basic Business Statistics, 11e © 2009 Prentice-Hall, Inc.. Chap 19-2
Learning Objectives
In this chapter, you learn:
The steps involved in choosing what statistical
methods to use to conduct a data analysis
Chap 19-3
Good Data Analysis Requires
Choosing The Proper Technique(s)
 Choosing the proper technique(s) to use
requires the consideration of:
 The purpose of the analysis
 The type of variable being analyzed
 Numerical
 Categorical
 The assumptions about the variable you are willing to
make
Basic Business Statistics, 11e © 2009 Prentice-Hall, Inc.. Chap 19-3
Chap 19-4
Questions To Ask When Analyzing
Numerical Variables
 Do you seek to:
 Describe the characteristics of the variable (possibly
broken into several groups)
 Draw conclusions about the mean and standard
deviation of the variable in a population
 Determine whether the mean and standard deviation
of the variable differs depending on the group
 Determine which factors affect the value of the
variable
 Predict the value of the variable based on the value
of other variables
 Determine whether the values of the variable are
stable over time
Basic Business Statistics, 11e © 2009 Prentice-Hall, Inc.. Chap 19-4
Chap 19-5
How to Describe the Characteristics
of a Numerical Variable
 Develop tables and charts and compute
descriptive statistics to describe the variable’s
characteristics:
 Tables and charts
 Stem-and-leaf display, percentage distribution, histogram,
polygon, boxplot, normal probability plot
 Statistics
 Mean, median, mode, quartiles, range, interquartile range,
standard deviation, variance, and coefficient of variation
Basic Business Statistics, 11e © 2009 Prentice-Hall, Inc.. Chap 19-5
Chap 19-6
How to draw conclusions about the
population mean or standard deviation
 Confidence interval for the mean based on the
t-distribution
 Hypothesis test for the mean (t-test)
 Hypothesis test for the variance (
Basic Business Statistics, 11e © 2009 Prentice-Hall, Inc.. Chap 19-6
2 -test)
Chap 19-7
How to determine whether the mean or
standard deviation differs by group
 Two independent groups studying central
tendency
 Normally distributed numerical variables
 Pooled t-test if you can assume variances are equal
 Separate-variance t-test if you cannot assume variances are
equal
 Both tests assume the variables are normally distributed
and you can examine this assumption by developing
boxplots and normal probability plots
 To decide if the variances are equal you can conduct an
F-test for the differences between two variances
 Numerical variables not normally distributed
 Wilcoxon rank sum test
Basic Business Statistics, 11e © 2009 Prentice-Hall, Inc.. Chap 19-7
Chap 19-8
How to determine whether the mean or
standard deviation differs by group
 Two groups of matched items or repeated
measures studying central tendency
 Paired differences normally distributed
 Paired t-test
 Paired differences not normally distributed
 Wilcoxon signed ranks test
 Two independent groups studying variability
 Numerical variables normally distributed
 F-test
Basic Business Statistics, 11e © 2009 Prentice-Hall, Inc.. Chap 19-8
continued
Chap 19-9
How to determine whether the mean or
standard deviation differs by group
 Three or more independent groups and
studying central tendency
 Numerical variables normally distributed
 One Way Analysis of Variance
 Three or more groups of matched or repeated
measurements
 Numerical variables normally distributed
 Randomized block design
 Numerical variables not normally distributed
 Friedman test
Basic Business Statistics, 11e © 2009 Prentice-Hall, Inc.. Chap 19-9
continued
Chap 19-10
How to determine which factors
affect the value of the variable
 Two factors to be examined
 Two-factor factorial design
Basic Business Statistics, 11e © 2009 Prentice-Hall, Inc.. Chap 19-10
Chap 19-11
How to predict the value of a variable
based on the value of other variables
 One independent variable
 Simple linear regression model
 Two or more independent variables
 Multiple regression model
 Data taken over a period of time and you want
to forecast future time periods
 Moving averages
 Exponential smoothing
 Least-squares forecasting
 Autoregressive modeling
Basic Business Statistics, 11e © 2009 Prentice-Hall, Inc.. Chap 19-11
Chap 19-12
How to determine whether the values of
a variable are stable over time
 Studying a process and have collected data over time
 Develop R and charts
Basic Business Statistics, 11e © 2009 Prentice-Hall, Inc.. Chap 19-12
X
Chap 19-13
Questions To Ask When Analyzing
Categorical Variables
 Do you seek to:
 Describe the proportion of items of interest in each
category (possibly broken into several groups)
 Draw conclusions about the proportion of items of
interest in a population
 Determine whether the proportion of items of interest
differs depending on the group
 Predict the proportion of items of interest based on
the value of other variables
 Determine whether the proportion of items of interest
is stable over time
Basic Business Statistics, 11e © 2009 Prentice-Hall, Inc.. Chap 19-13
Chap 19-14
How to describe the proportion of
items of interest in each category
 Summary tables
 Charts
 Bar chart
 Pie chart
 Pareto chart
 Side-by-side bar charts
Basic Business Statistics, 11e © 2009 Prentice-Hall, Inc.. Chap 19-14
Chap 19-15
How to draw conclusions about the
proportion of items of interest
 Confidence interval for proportion of items of
interest
 Hypothesis test for the proportion of items of
interest (Z-test)
Basic Business Statistics, 11e © 2009 Prentice-Hall, Inc.. Chap 19-15
Chap 19-16
How to determine whether the proportion of
items of interest differs depending on the group
 Categorical variable has two categories
 Two independent groups
 Two proportion Z-test
 for the difference between two proportions
 Two groups of matched or repeated measurements
 McNemar test
 More than two independent groups
 for the difference among several proportions
 More than two categories and more than two
groups
 of independence
Basic Business Statistics, 11e © 2009 Prentice-Hall, Inc.. Chap 19-16
2 -test
2 -test
2 -test
Chap 19-17
How to predict the proportion of items of interest
based on the value of other variables
 Logistic regression
Basic Business Statistics, 11e © 2009 Prentice-Hall, Inc.. Chap 19-17
Chap 19-18
How to determine whether the proportion of
items of interest is stable over time
 Studying a process and data is taken over time
 Collected items of interest over time
 p-chart
Basic Business Statistics, 11e © 2009 Prentice-Hall, Inc.. Chap 19-18
Chap 19-19Chap 19-19
Data Analysis Tree
Numerical & Categorical Variables
Numerical
Variables
Categorical
Variables
Possible Questions
How to describe the characteristics of the variable (possibly broken into several groups)?
How to draw conclusions about the mean and standard deviation of the variable in the population?
How to determine whether the mean and standard deviation of the variable differs depending on the
group?
How to determine which factors affect the value of the variable?
How to predict the value of the variable based on the value of other variables?
How to determine whether the values of the variable are stable over time?
How to describe the proportion of items of interest in each category (possibly broken into several
groups)?
How to draw conclusions about the proportion of items of interest in a population?
How to determine whether the proportion of items of interest differs depending on the group?
How to predict the proportion of items of interest based on the value of other variables?
How to determine whether the proportion of items of interest is stable over time?
Basic Business Statistics, 11e © 2009 Prentice-Hall, Inc..
Chap 19-20Chap 19-20
Data Analysis Tree
Numerical Variables
How to describe the
characteristics of the
variable (possibly broken
into several groups)?
How to draw conclusions
about the mean and
standard deviation of the
variable in the population?
How to determine whether
the mean and standard
deviation of the variable
differs depending on the
group?
continued
Create Tables & Charts
Calculate Statistics
Mean
Variance / Standard
Deviation
Mean
Variance
Stem-and-leaf display, percentage distribution,
histogram, polygon, boxplot, normal probability plot
Mean, median, mode, quartiles, range,
interquartile range, standard deviation, variance,
coefficient of variation
Confidence interval for mean (t or z)
Hypothesis test for mean (t or z)
Hypothesis test for variance
Pooled t test (both variables must be normal, variances equal)
Separate variance t test (both variables must be normal)
Wilcoxon rank sum test (variables do not have to be normal)
F-test (both variables must be normal)
Paired t test (differences must be normal)
Wilcoxon signed ranks test (differences do not have to be normal)
One Way Anova (variable must be normal)
Randomized Block Design (variable must be normal)
Friedman test (variable does not have to be normal)
(2 -test)
2 independent
groups
2 matched
groups
>2 independent
groups
>2 matched
groups
Basic Business Statistics, 11e © 2009 Prentice-Hall, Inc..
Chap 19-21Chap 19-21
Data Analysis Tree
Numerical Variables
continued
How to determine which
factors affect the value of
the variable?
How to predict the value of
the variable based on the
value of other variables?
How to determine whether
the values of the variable
are stable over time?
Two factors
to be examined
One independent
variable
Two or more
Independent variables
Data taken over time to
forecast the future
Studied a process and
taken data over time
Two factor factorial design
Simple linear regression
Multiple regression model
Moving averages
Exponential smoothing
Least squares forecasting
Autoregressive modeling
Develop and R chartsX
Basic Business Statistics, 11e © 2009 Prentice-Hall, Inc..
Chap 19-22
Data Analysis Tree
Categorical Variables
2
χ
continued
Chap 19-22Basic Business Statistics, 11e © 2009 Prentice-Hall, Inc..
How to describe the
proportion of items of
interest in each category
(possibly broken into
several groups)
How to draw conclusions
about the proportion of
items of interest in a
population
How to determine
whether the proportion of
items of interest differs
depending on the group
Summary tables
Bar charts
Pie charts
Pareto charts
Side-by-side charts
Confidence interval for the proportion of items of interest
Hypothesis test for the proportion of items of interest
Two proportion Z test
test for the difference between two proportions
McNemar test
test for the difference among several proportions
test of independence
Two categories & two
independent groups
Two categories & two
matched groups
Two categories & more
than two independent
groups
More than two
categories & more than
two groups
2
χ
2
χ
Chap 19-23
How to predict the
proportion of items of
interest based on the
value of other variables
How to determine
whether the proportion of
items of interest is stable
over time
Data Analysis Tree
Categorical Variables
continued
Chap 19-23Basic Business Statistics, 11e © 2009 Prentice-Hall, Inc..
Logistic Regression
p-chart
Studying a process
and collected items of
interest over time
Chap 19-24
Chapter Summary
 Discussed how to choose the appropriate
technique(s) for data analysis for both
numerical and categorical variables
 Discussed potential questions and the
associated appropriate techniques for
numerical variables
 Discussed potential questions and the
associated appropriate techniques for
categorical variables
Basic Business Statistics, 11e © 2009 Prentice-Hall, Inc.. Chap 19-24

Bbs11 ppt ch19

  • 1.
    Chap 19-1Basic BusinessStatistics, 11e © 2009 Prentice-Hall, Inc. Chap 19-1 Chapter 19 Data Analysis Overview Basic Business Statistics 11th Edition
  • 2.
    Chap 19-2Basic BusinessStatistics, 11e © 2009 Prentice-Hall, Inc.. Chap 19-2 Learning Objectives In this chapter, you learn: The steps involved in choosing what statistical methods to use to conduct a data analysis
  • 3.
    Chap 19-3 Good DataAnalysis Requires Choosing The Proper Technique(s)  Choosing the proper technique(s) to use requires the consideration of:  The purpose of the analysis  The type of variable being analyzed  Numerical  Categorical  The assumptions about the variable you are willing to make Basic Business Statistics, 11e © 2009 Prentice-Hall, Inc.. Chap 19-3
  • 4.
    Chap 19-4 Questions ToAsk When Analyzing Numerical Variables  Do you seek to:  Describe the characteristics of the variable (possibly broken into several groups)  Draw conclusions about the mean and standard deviation of the variable in a population  Determine whether the mean and standard deviation of the variable differs depending on the group  Determine which factors affect the value of the variable  Predict the value of the variable based on the value of other variables  Determine whether the values of the variable are stable over time Basic Business Statistics, 11e © 2009 Prentice-Hall, Inc.. Chap 19-4
  • 5.
    Chap 19-5 How toDescribe the Characteristics of a Numerical Variable  Develop tables and charts and compute descriptive statistics to describe the variable’s characteristics:  Tables and charts  Stem-and-leaf display, percentage distribution, histogram, polygon, boxplot, normal probability plot  Statistics  Mean, median, mode, quartiles, range, interquartile range, standard deviation, variance, and coefficient of variation Basic Business Statistics, 11e © 2009 Prentice-Hall, Inc.. Chap 19-5
  • 6.
    Chap 19-6 How todraw conclusions about the population mean or standard deviation  Confidence interval for the mean based on the t-distribution  Hypothesis test for the mean (t-test)  Hypothesis test for the variance ( Basic Business Statistics, 11e © 2009 Prentice-Hall, Inc.. Chap 19-6 2 -test)
  • 7.
    Chap 19-7 How todetermine whether the mean or standard deviation differs by group  Two independent groups studying central tendency  Normally distributed numerical variables  Pooled t-test if you can assume variances are equal  Separate-variance t-test if you cannot assume variances are equal  Both tests assume the variables are normally distributed and you can examine this assumption by developing boxplots and normal probability plots  To decide if the variances are equal you can conduct an F-test for the differences between two variances  Numerical variables not normally distributed  Wilcoxon rank sum test Basic Business Statistics, 11e © 2009 Prentice-Hall, Inc.. Chap 19-7
  • 8.
    Chap 19-8 How todetermine whether the mean or standard deviation differs by group  Two groups of matched items or repeated measures studying central tendency  Paired differences normally distributed  Paired t-test  Paired differences not normally distributed  Wilcoxon signed ranks test  Two independent groups studying variability  Numerical variables normally distributed  F-test Basic Business Statistics, 11e © 2009 Prentice-Hall, Inc.. Chap 19-8 continued
  • 9.
    Chap 19-9 How todetermine whether the mean or standard deviation differs by group  Three or more independent groups and studying central tendency  Numerical variables normally distributed  One Way Analysis of Variance  Three or more groups of matched or repeated measurements  Numerical variables normally distributed  Randomized block design  Numerical variables not normally distributed  Friedman test Basic Business Statistics, 11e © 2009 Prentice-Hall, Inc.. Chap 19-9 continued
  • 10.
    Chap 19-10 How todetermine which factors affect the value of the variable  Two factors to be examined  Two-factor factorial design Basic Business Statistics, 11e © 2009 Prentice-Hall, Inc.. Chap 19-10
  • 11.
    Chap 19-11 How topredict the value of a variable based on the value of other variables  One independent variable  Simple linear regression model  Two or more independent variables  Multiple regression model  Data taken over a period of time and you want to forecast future time periods  Moving averages  Exponential smoothing  Least-squares forecasting  Autoregressive modeling Basic Business Statistics, 11e © 2009 Prentice-Hall, Inc.. Chap 19-11
  • 12.
    Chap 19-12 How todetermine whether the values of a variable are stable over time  Studying a process and have collected data over time  Develop R and charts Basic Business Statistics, 11e © 2009 Prentice-Hall, Inc.. Chap 19-12 X
  • 13.
    Chap 19-13 Questions ToAsk When Analyzing Categorical Variables  Do you seek to:  Describe the proportion of items of interest in each category (possibly broken into several groups)  Draw conclusions about the proportion of items of interest in a population  Determine whether the proportion of items of interest differs depending on the group  Predict the proportion of items of interest based on the value of other variables  Determine whether the proportion of items of interest is stable over time Basic Business Statistics, 11e © 2009 Prentice-Hall, Inc.. Chap 19-13
  • 14.
    Chap 19-14 How todescribe the proportion of items of interest in each category  Summary tables  Charts  Bar chart  Pie chart  Pareto chart  Side-by-side bar charts Basic Business Statistics, 11e © 2009 Prentice-Hall, Inc.. Chap 19-14
  • 15.
    Chap 19-15 How todraw conclusions about the proportion of items of interest  Confidence interval for proportion of items of interest  Hypothesis test for the proportion of items of interest (Z-test) Basic Business Statistics, 11e © 2009 Prentice-Hall, Inc.. Chap 19-15
  • 16.
    Chap 19-16 How todetermine whether the proportion of items of interest differs depending on the group  Categorical variable has two categories  Two independent groups  Two proportion Z-test  for the difference between two proportions  Two groups of matched or repeated measurements  McNemar test  More than two independent groups  for the difference among several proportions  More than two categories and more than two groups  of independence Basic Business Statistics, 11e © 2009 Prentice-Hall, Inc.. Chap 19-16 2 -test 2 -test 2 -test
  • 17.
    Chap 19-17 How topredict the proportion of items of interest based on the value of other variables  Logistic regression Basic Business Statistics, 11e © 2009 Prentice-Hall, Inc.. Chap 19-17
  • 18.
    Chap 19-18 How todetermine whether the proportion of items of interest is stable over time  Studying a process and data is taken over time  Collected items of interest over time  p-chart Basic Business Statistics, 11e © 2009 Prentice-Hall, Inc.. Chap 19-18
  • 19.
    Chap 19-19Chap 19-19 DataAnalysis Tree Numerical & Categorical Variables Numerical Variables Categorical Variables Possible Questions How to describe the characteristics of the variable (possibly broken into several groups)? How to draw conclusions about the mean and standard deviation of the variable in the population? How to determine whether the mean and standard deviation of the variable differs depending on the group? How to determine which factors affect the value of the variable? How to predict the value of the variable based on the value of other variables? How to determine whether the values of the variable are stable over time? How to describe the proportion of items of interest in each category (possibly broken into several groups)? How to draw conclusions about the proportion of items of interest in a population? How to determine whether the proportion of items of interest differs depending on the group? How to predict the proportion of items of interest based on the value of other variables? How to determine whether the proportion of items of interest is stable over time? Basic Business Statistics, 11e © 2009 Prentice-Hall, Inc..
  • 20.
    Chap 19-20Chap 19-20 DataAnalysis Tree Numerical Variables How to describe the characteristics of the variable (possibly broken into several groups)? How to draw conclusions about the mean and standard deviation of the variable in the population? How to determine whether the mean and standard deviation of the variable differs depending on the group? continued Create Tables & Charts Calculate Statistics Mean Variance / Standard Deviation Mean Variance Stem-and-leaf display, percentage distribution, histogram, polygon, boxplot, normal probability plot Mean, median, mode, quartiles, range, interquartile range, standard deviation, variance, coefficient of variation Confidence interval for mean (t or z) Hypothesis test for mean (t or z) Hypothesis test for variance Pooled t test (both variables must be normal, variances equal) Separate variance t test (both variables must be normal) Wilcoxon rank sum test (variables do not have to be normal) F-test (both variables must be normal) Paired t test (differences must be normal) Wilcoxon signed ranks test (differences do not have to be normal) One Way Anova (variable must be normal) Randomized Block Design (variable must be normal) Friedman test (variable does not have to be normal) (2 -test) 2 independent groups 2 matched groups >2 independent groups >2 matched groups Basic Business Statistics, 11e © 2009 Prentice-Hall, Inc..
  • 21.
    Chap 19-21Chap 19-21 DataAnalysis Tree Numerical Variables continued How to determine which factors affect the value of the variable? How to predict the value of the variable based on the value of other variables? How to determine whether the values of the variable are stable over time? Two factors to be examined One independent variable Two or more Independent variables Data taken over time to forecast the future Studied a process and taken data over time Two factor factorial design Simple linear regression Multiple regression model Moving averages Exponential smoothing Least squares forecasting Autoregressive modeling Develop and R chartsX Basic Business Statistics, 11e © 2009 Prentice-Hall, Inc..
  • 22.
    Chap 19-22 Data AnalysisTree Categorical Variables 2 χ continued Chap 19-22Basic Business Statistics, 11e © 2009 Prentice-Hall, Inc.. How to describe the proportion of items of interest in each category (possibly broken into several groups) How to draw conclusions about the proportion of items of interest in a population How to determine whether the proportion of items of interest differs depending on the group Summary tables Bar charts Pie charts Pareto charts Side-by-side charts Confidence interval for the proportion of items of interest Hypothesis test for the proportion of items of interest Two proportion Z test test for the difference between two proportions McNemar test test for the difference among several proportions test of independence Two categories & two independent groups Two categories & two matched groups Two categories & more than two independent groups More than two categories & more than two groups 2 χ 2 χ
  • 23.
    Chap 19-23 How topredict the proportion of items of interest based on the value of other variables How to determine whether the proportion of items of interest is stable over time Data Analysis Tree Categorical Variables continued Chap 19-23Basic Business Statistics, 11e © 2009 Prentice-Hall, Inc.. Logistic Regression p-chart Studying a process and collected items of interest over time
  • 24.
    Chap 19-24 Chapter Summary Discussed how to choose the appropriate technique(s) for data analysis for both numerical and categorical variables  Discussed potential questions and the associated appropriate techniques for numerical variables  Discussed potential questions and the associated appropriate techniques for categorical variables Basic Business Statistics, 11e © 2009 Prentice-Hall, Inc.. Chap 19-24