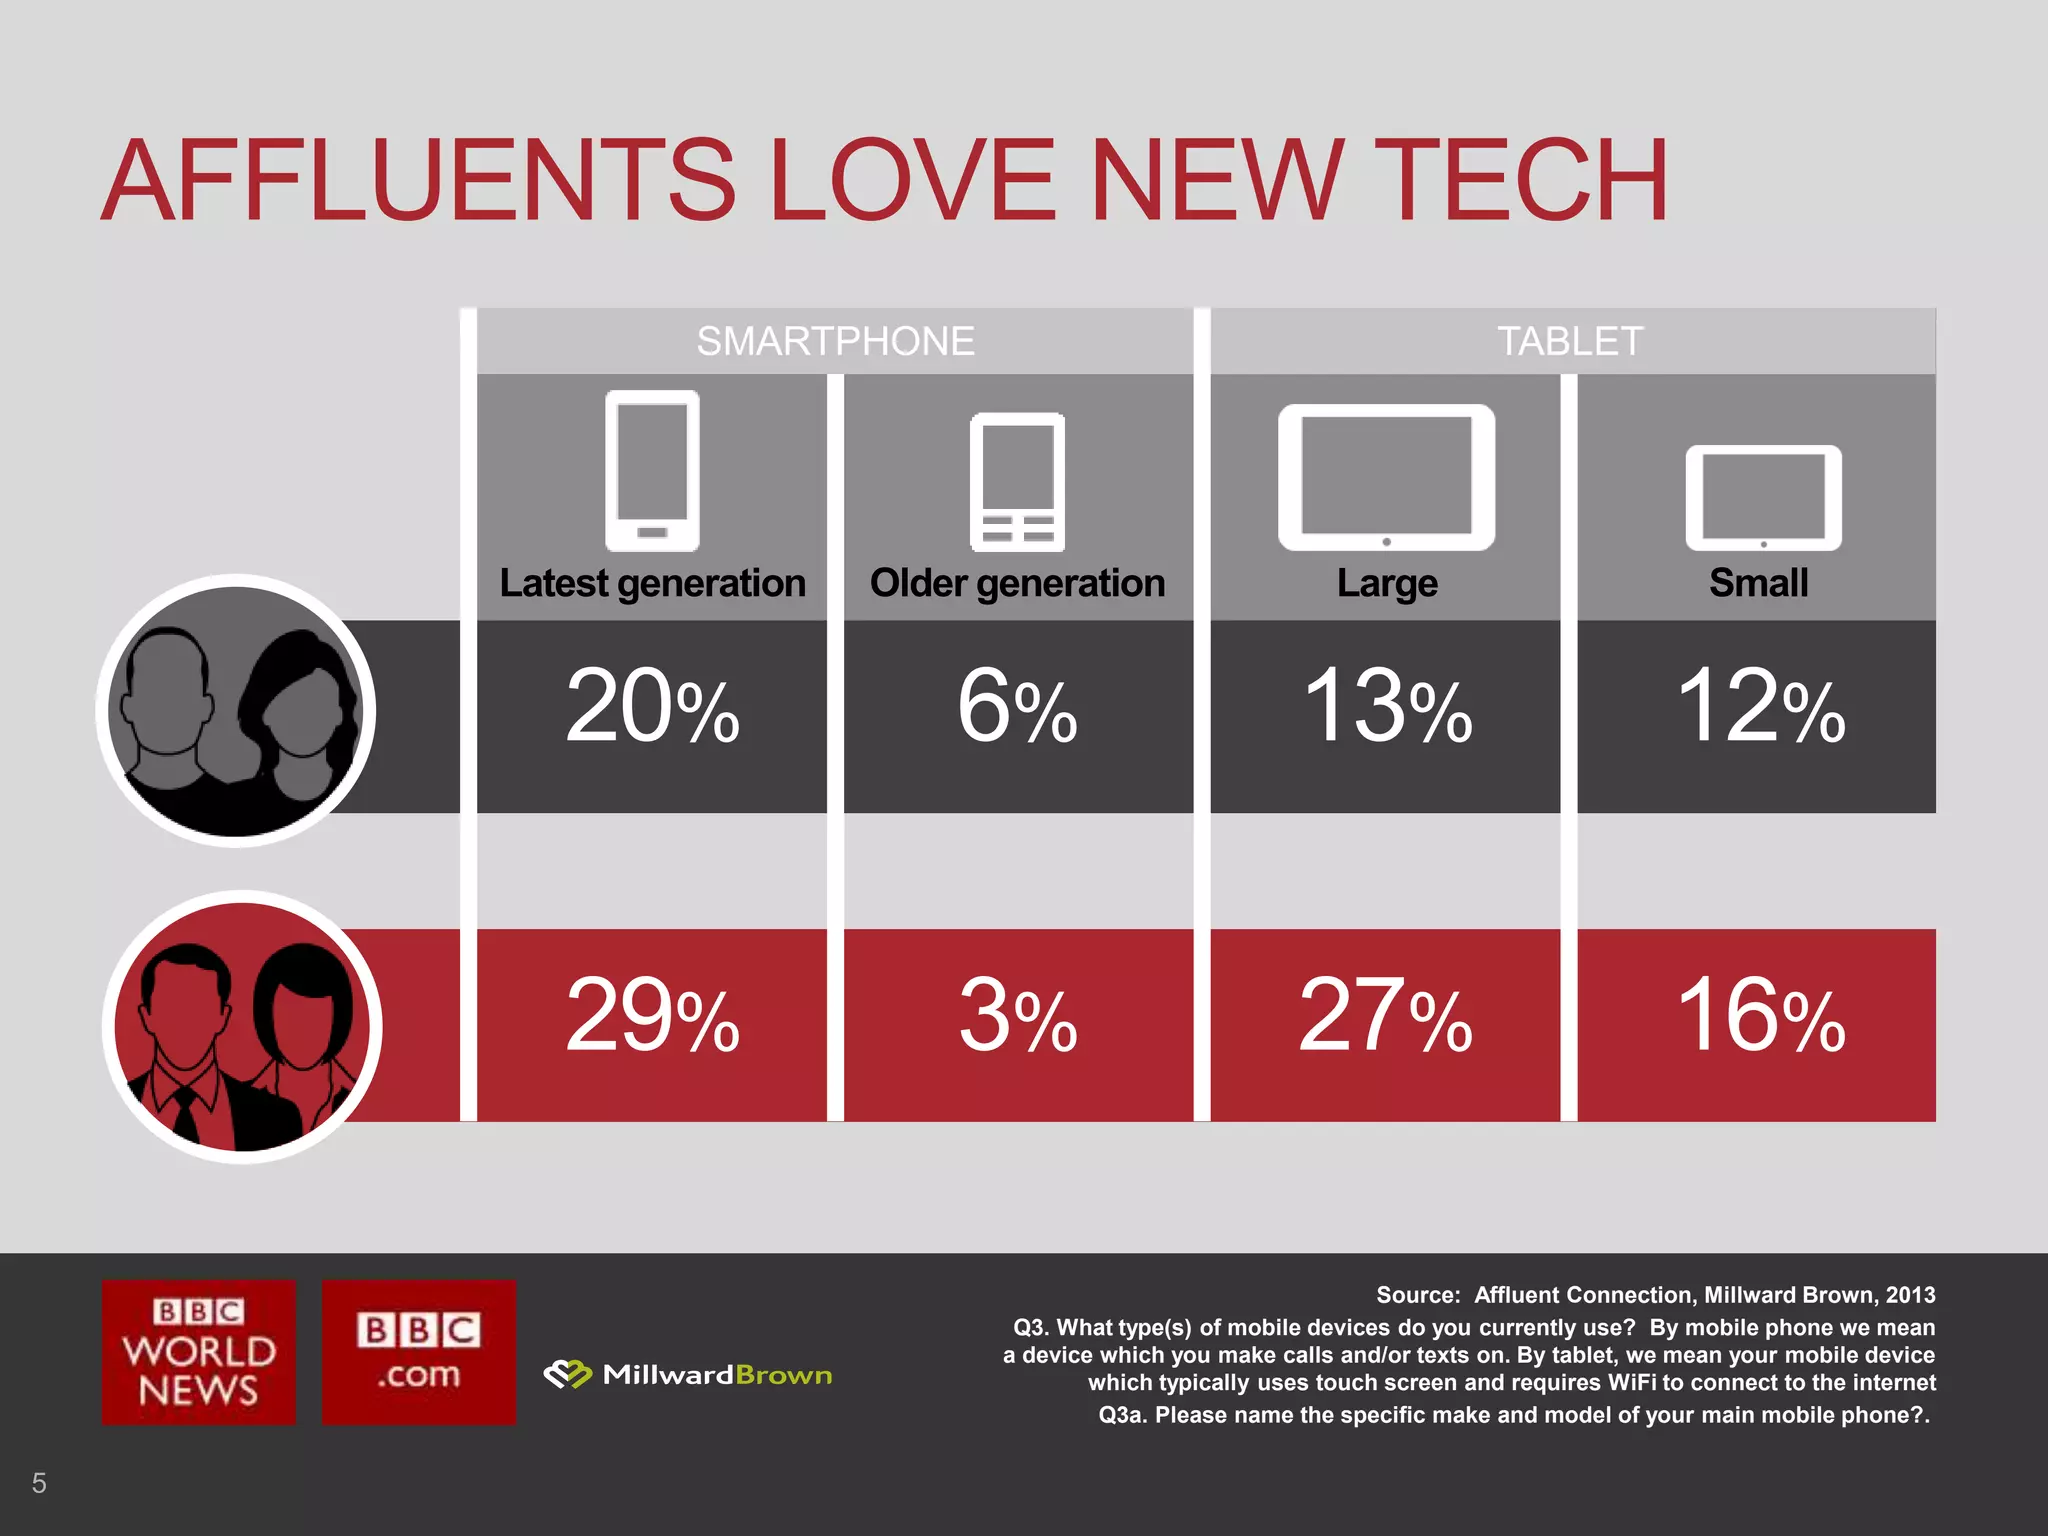
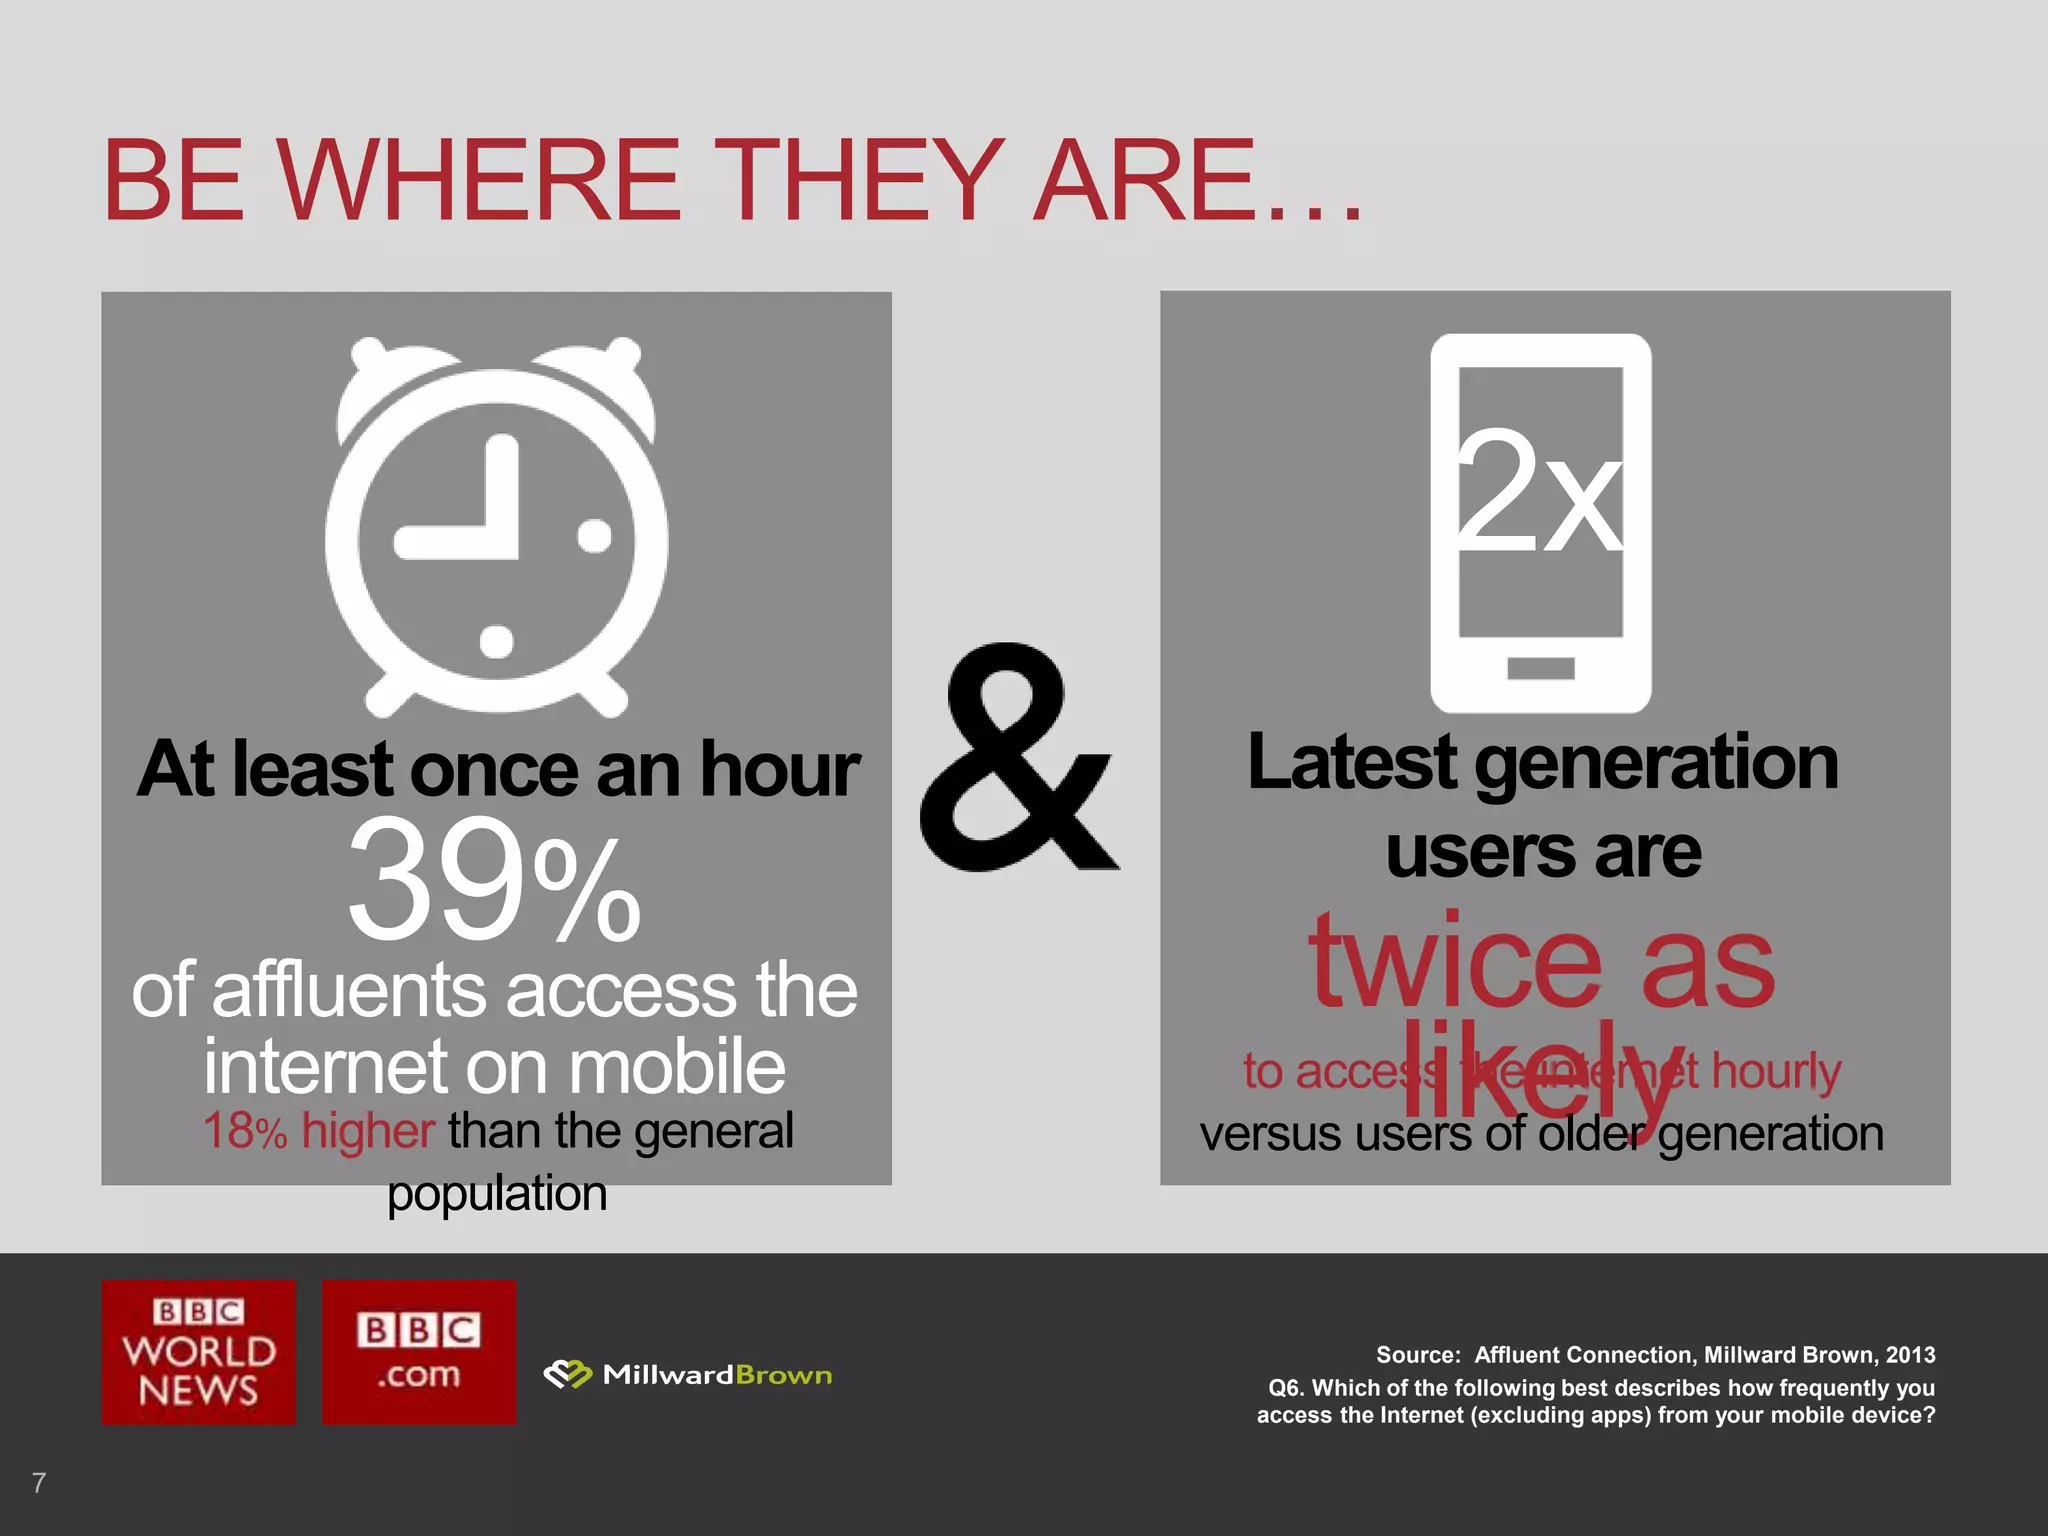
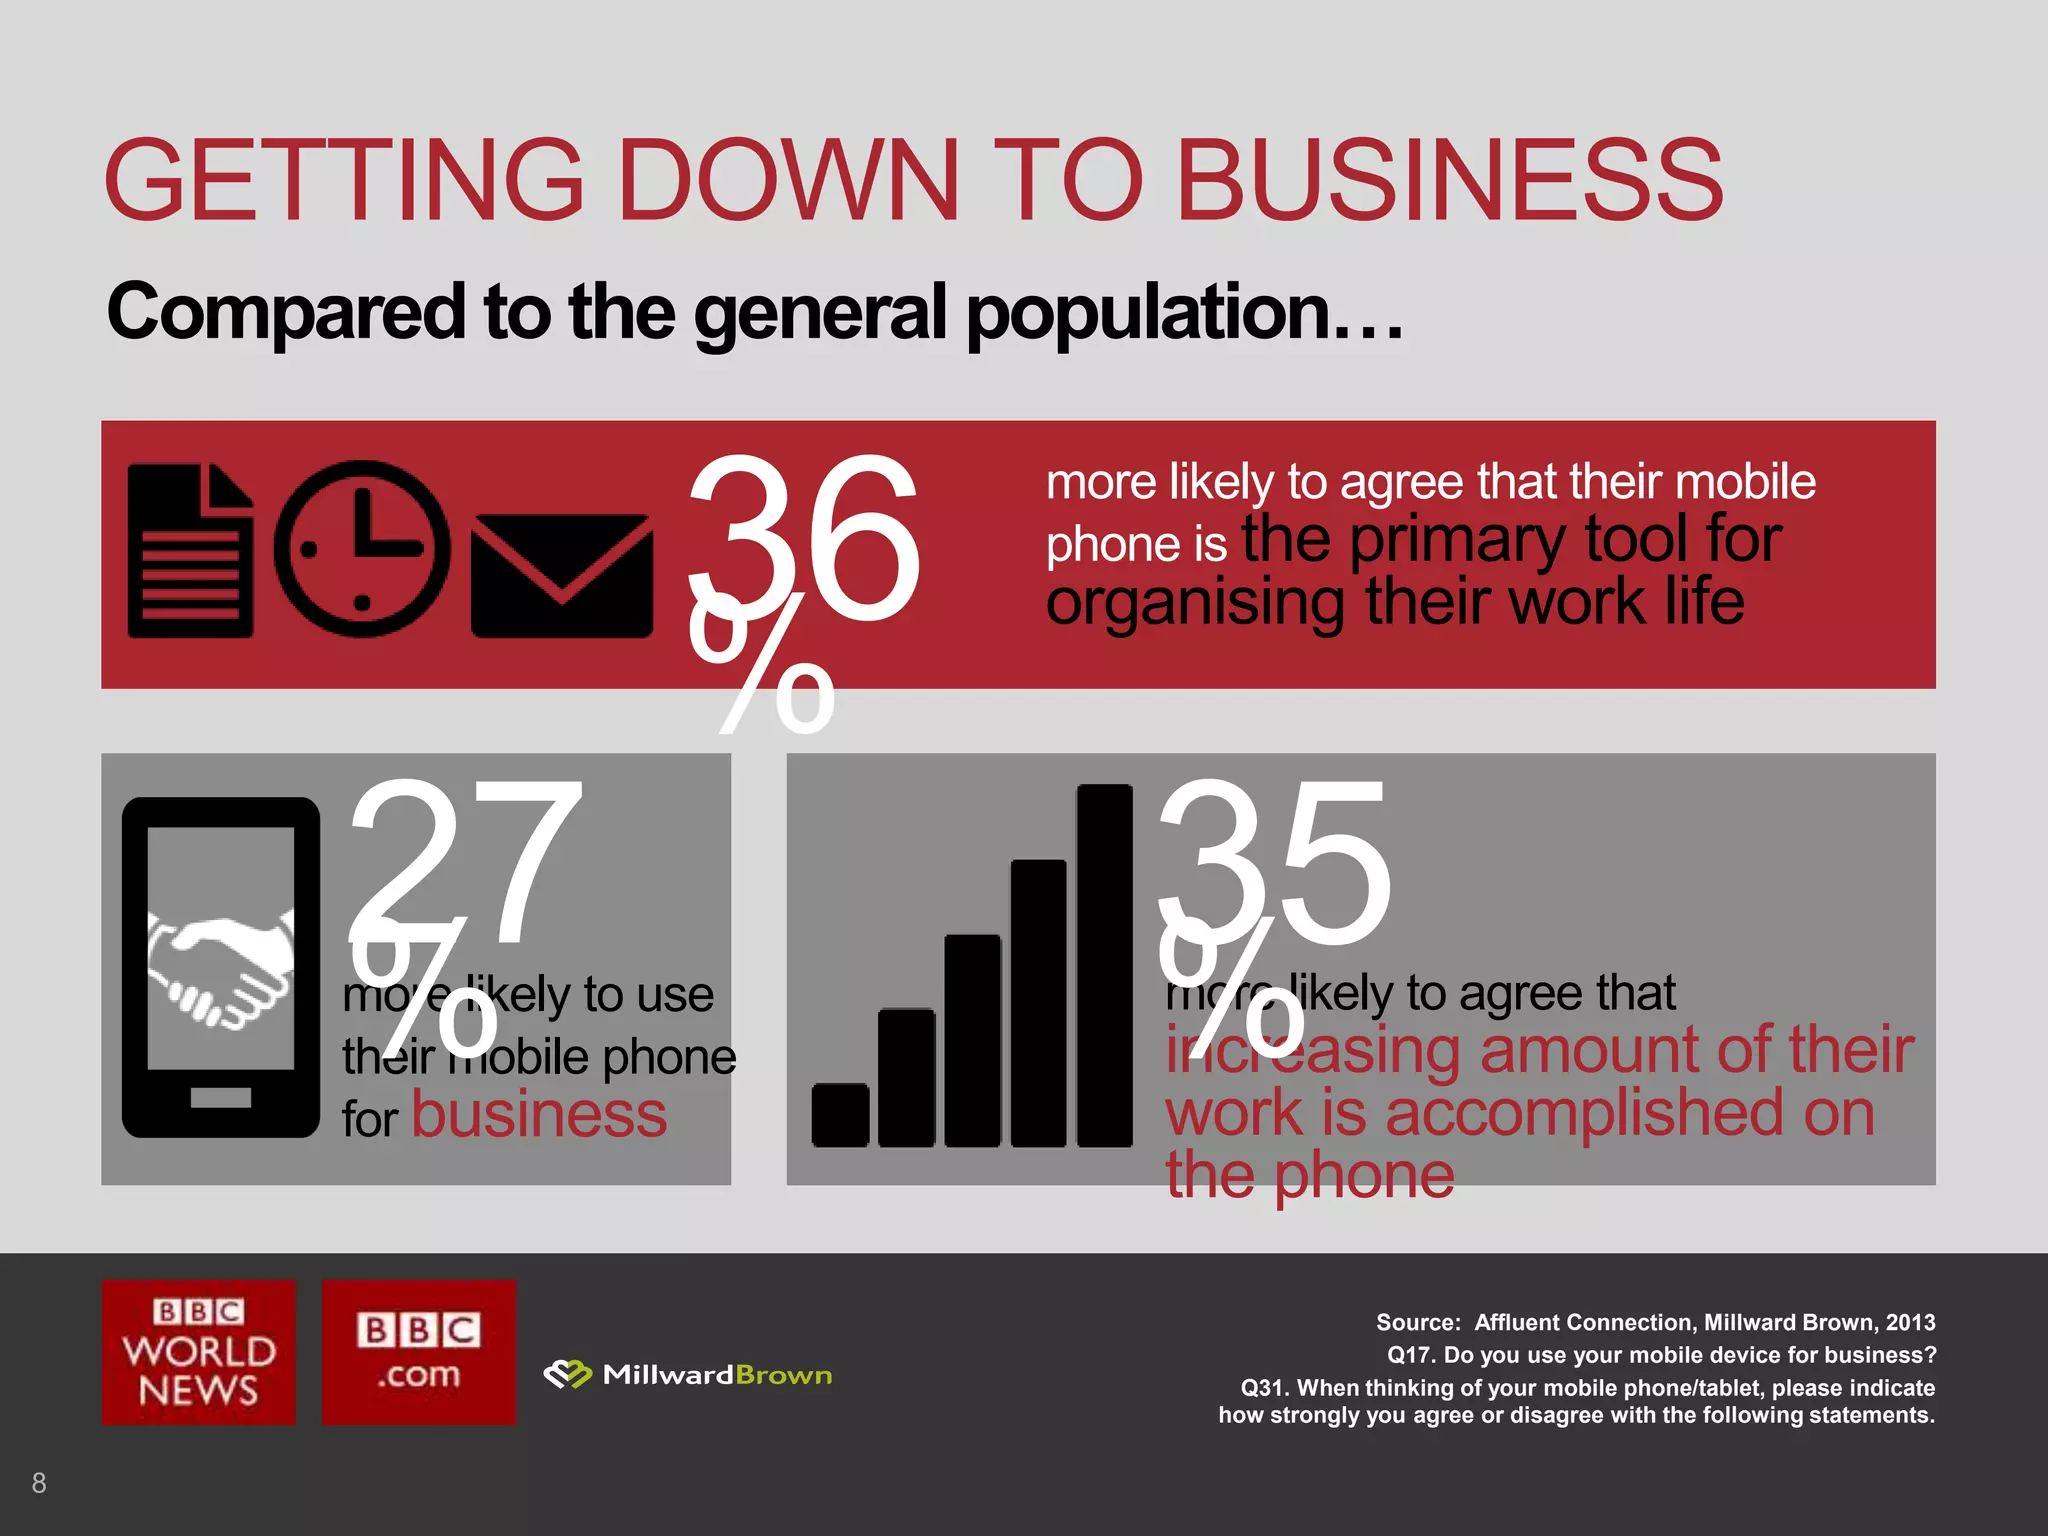
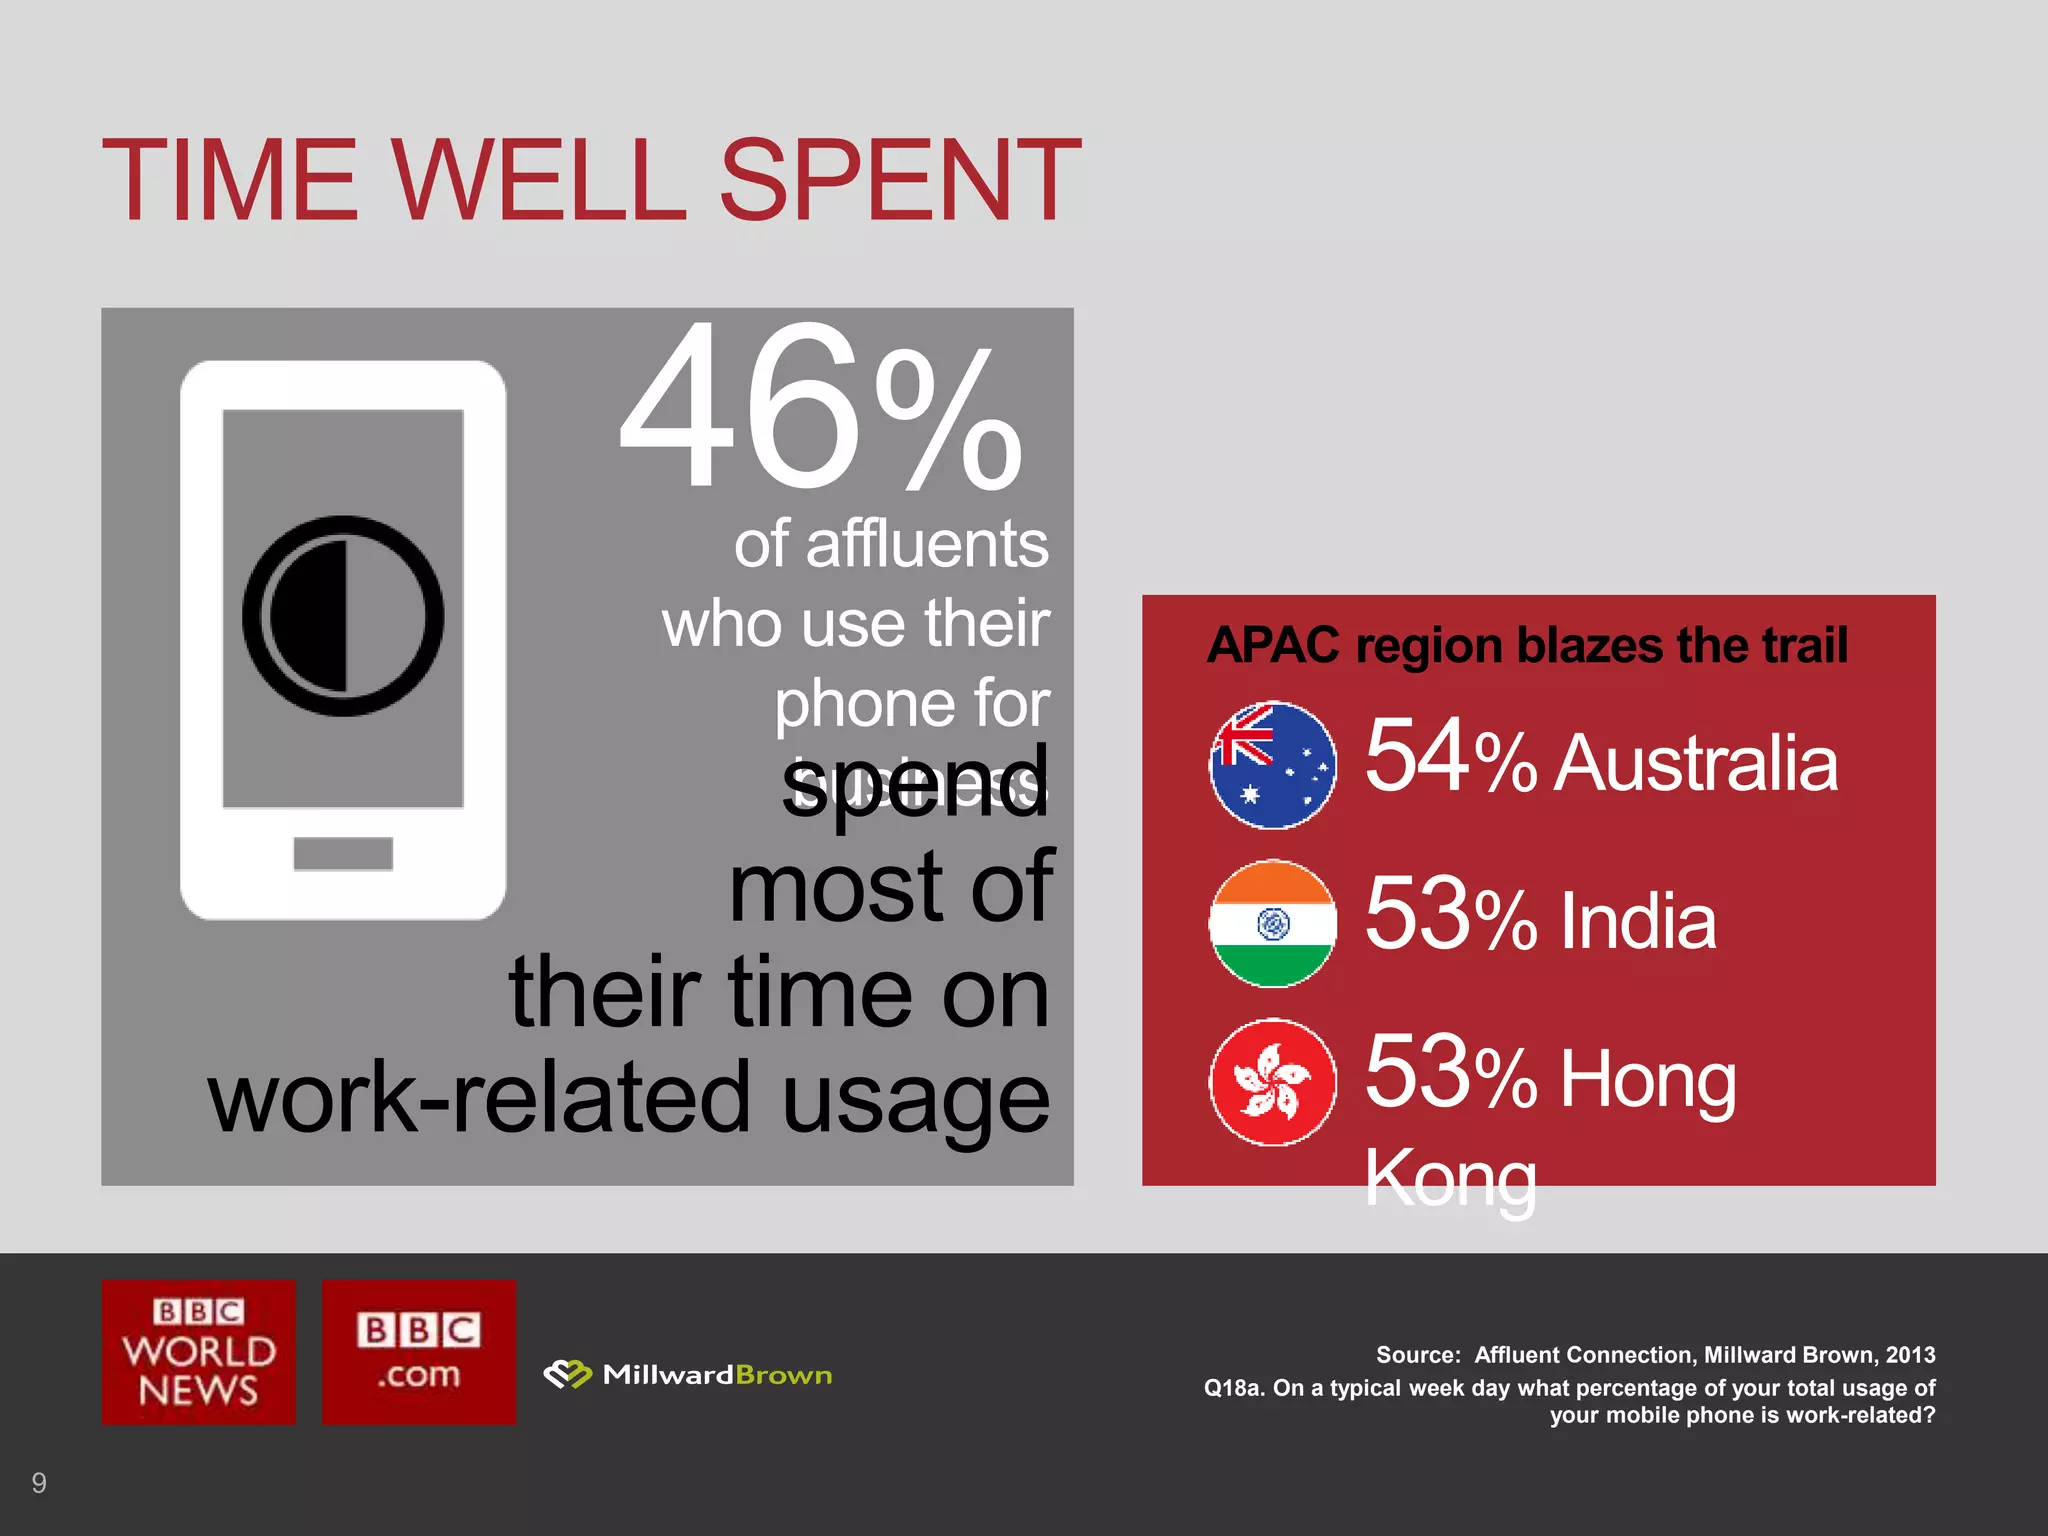
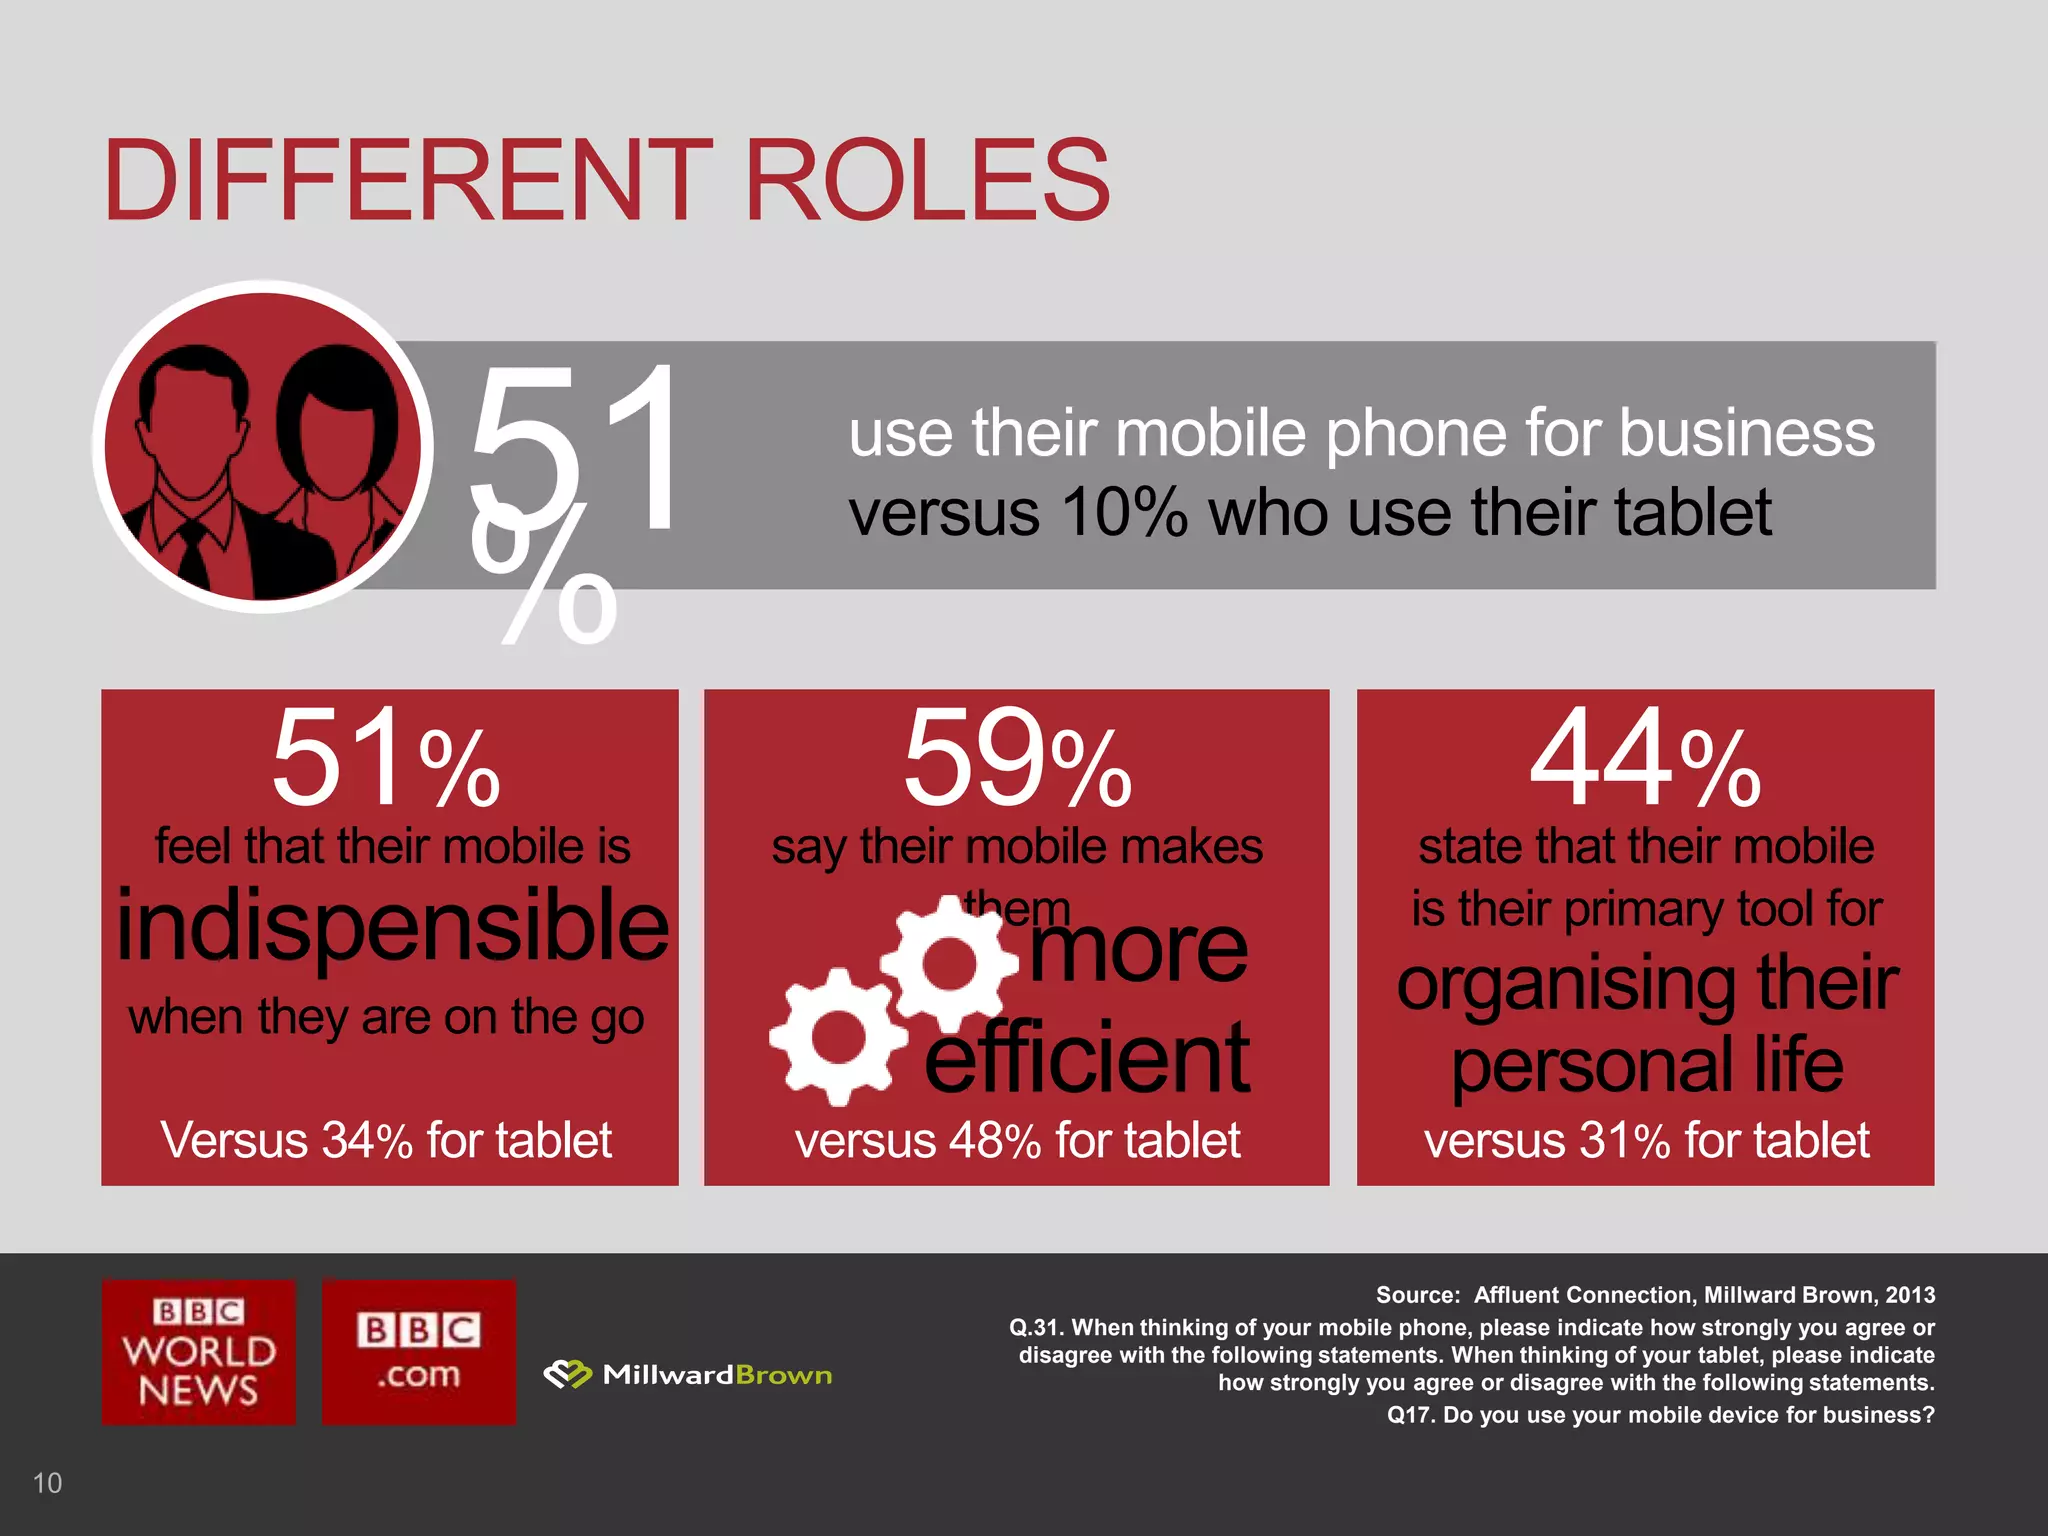
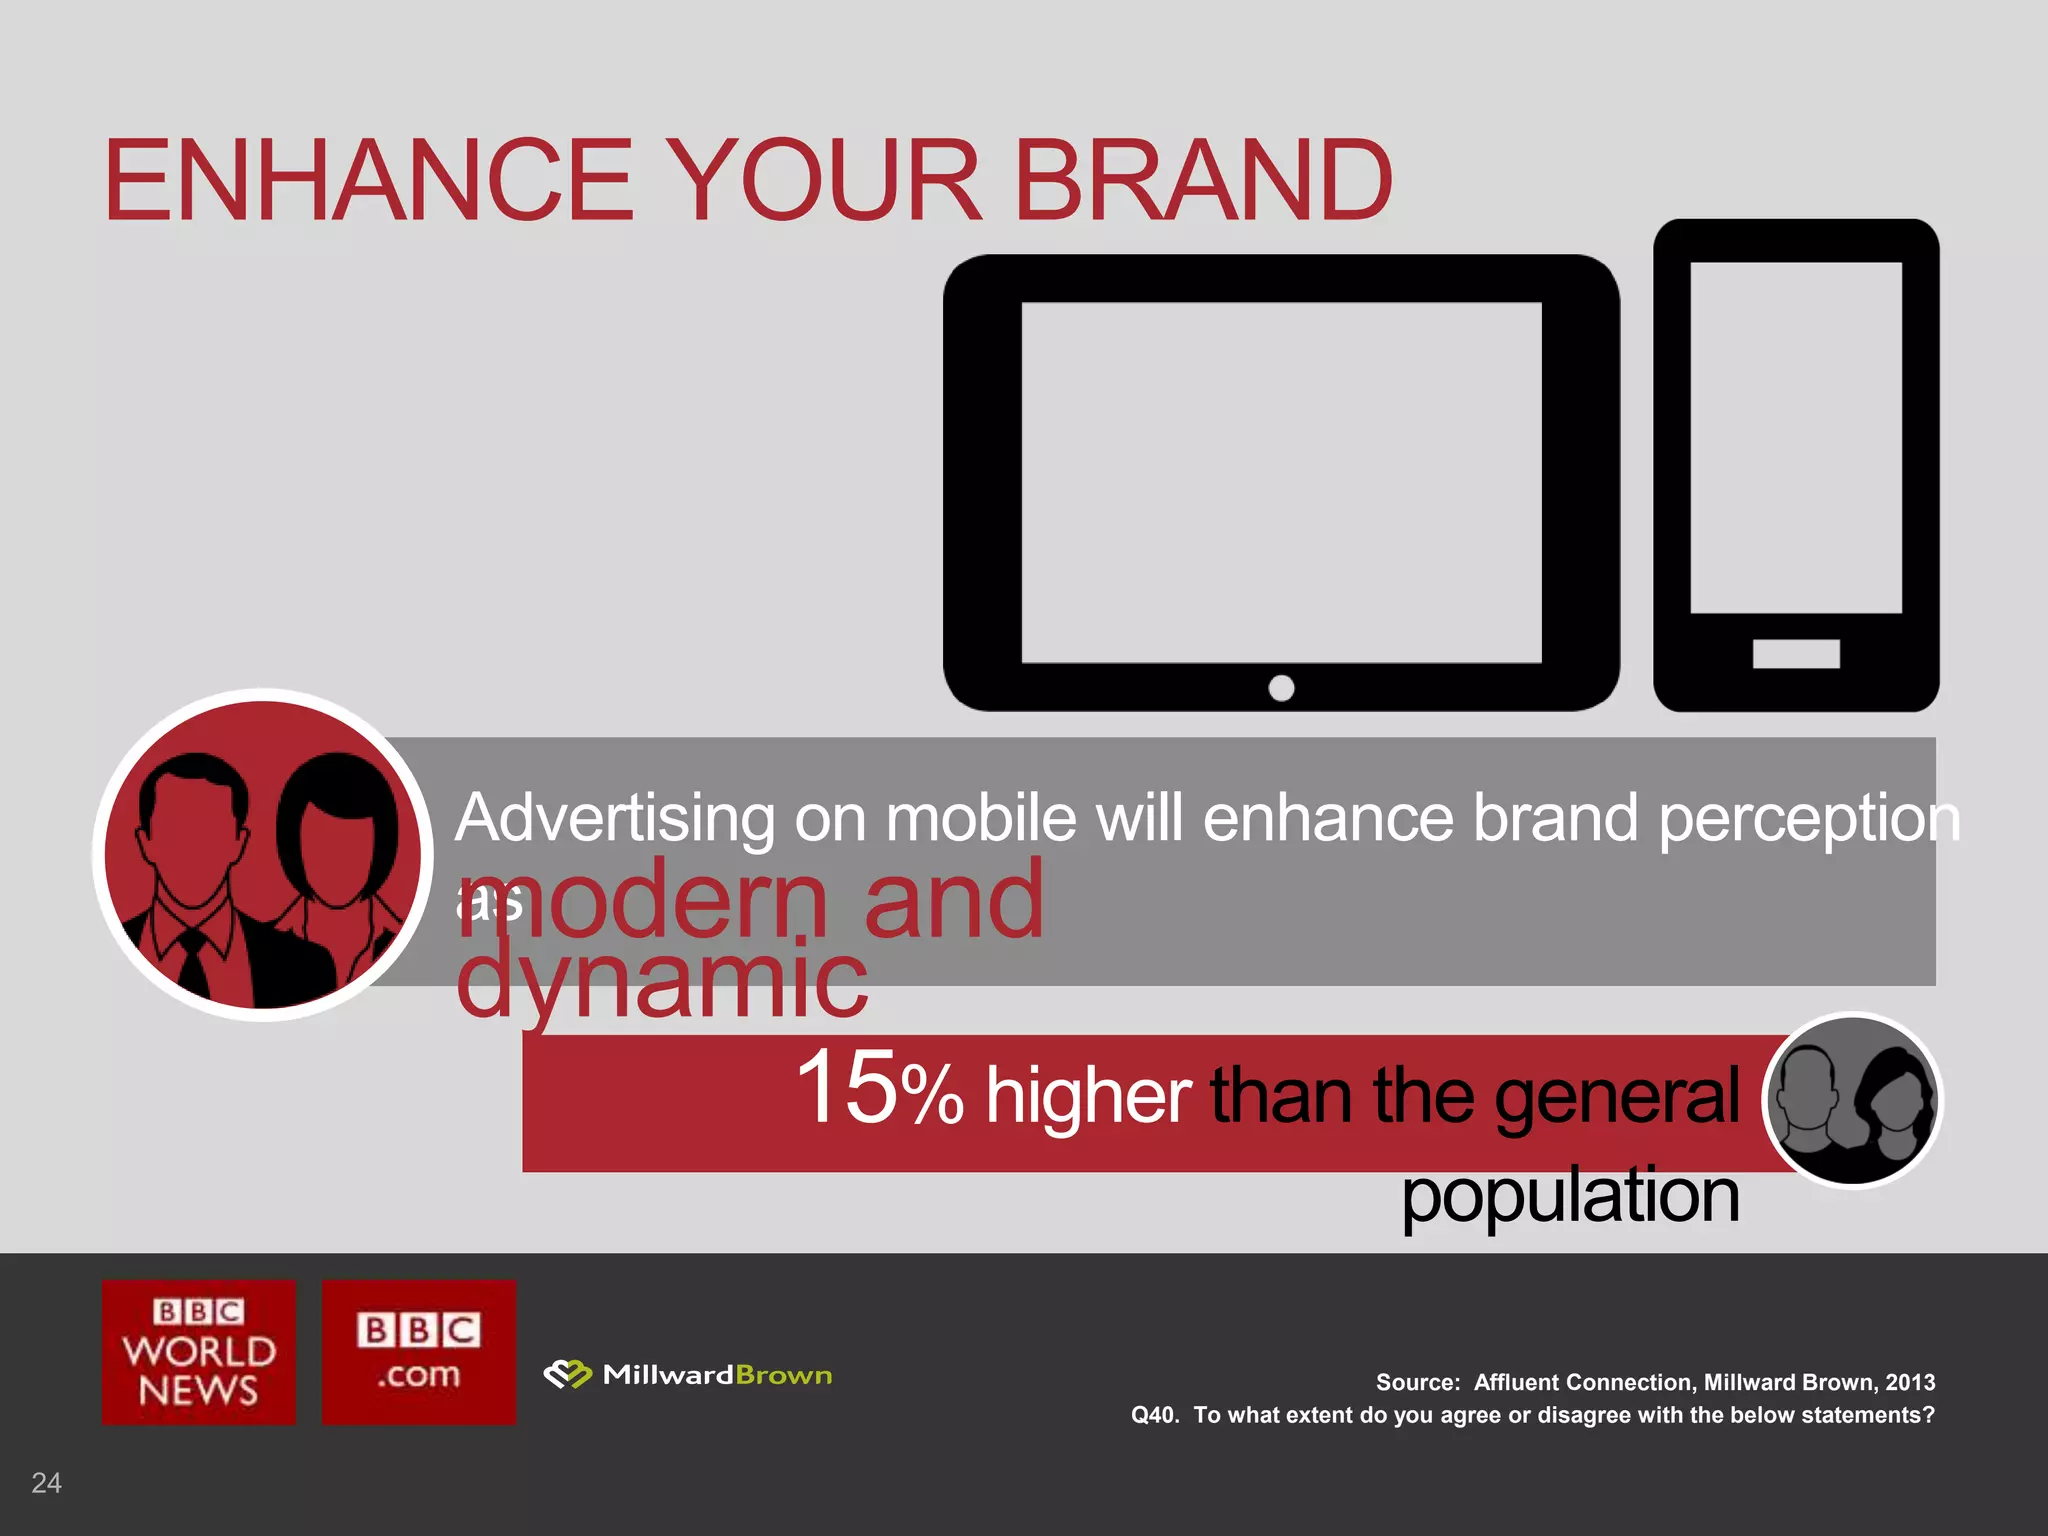
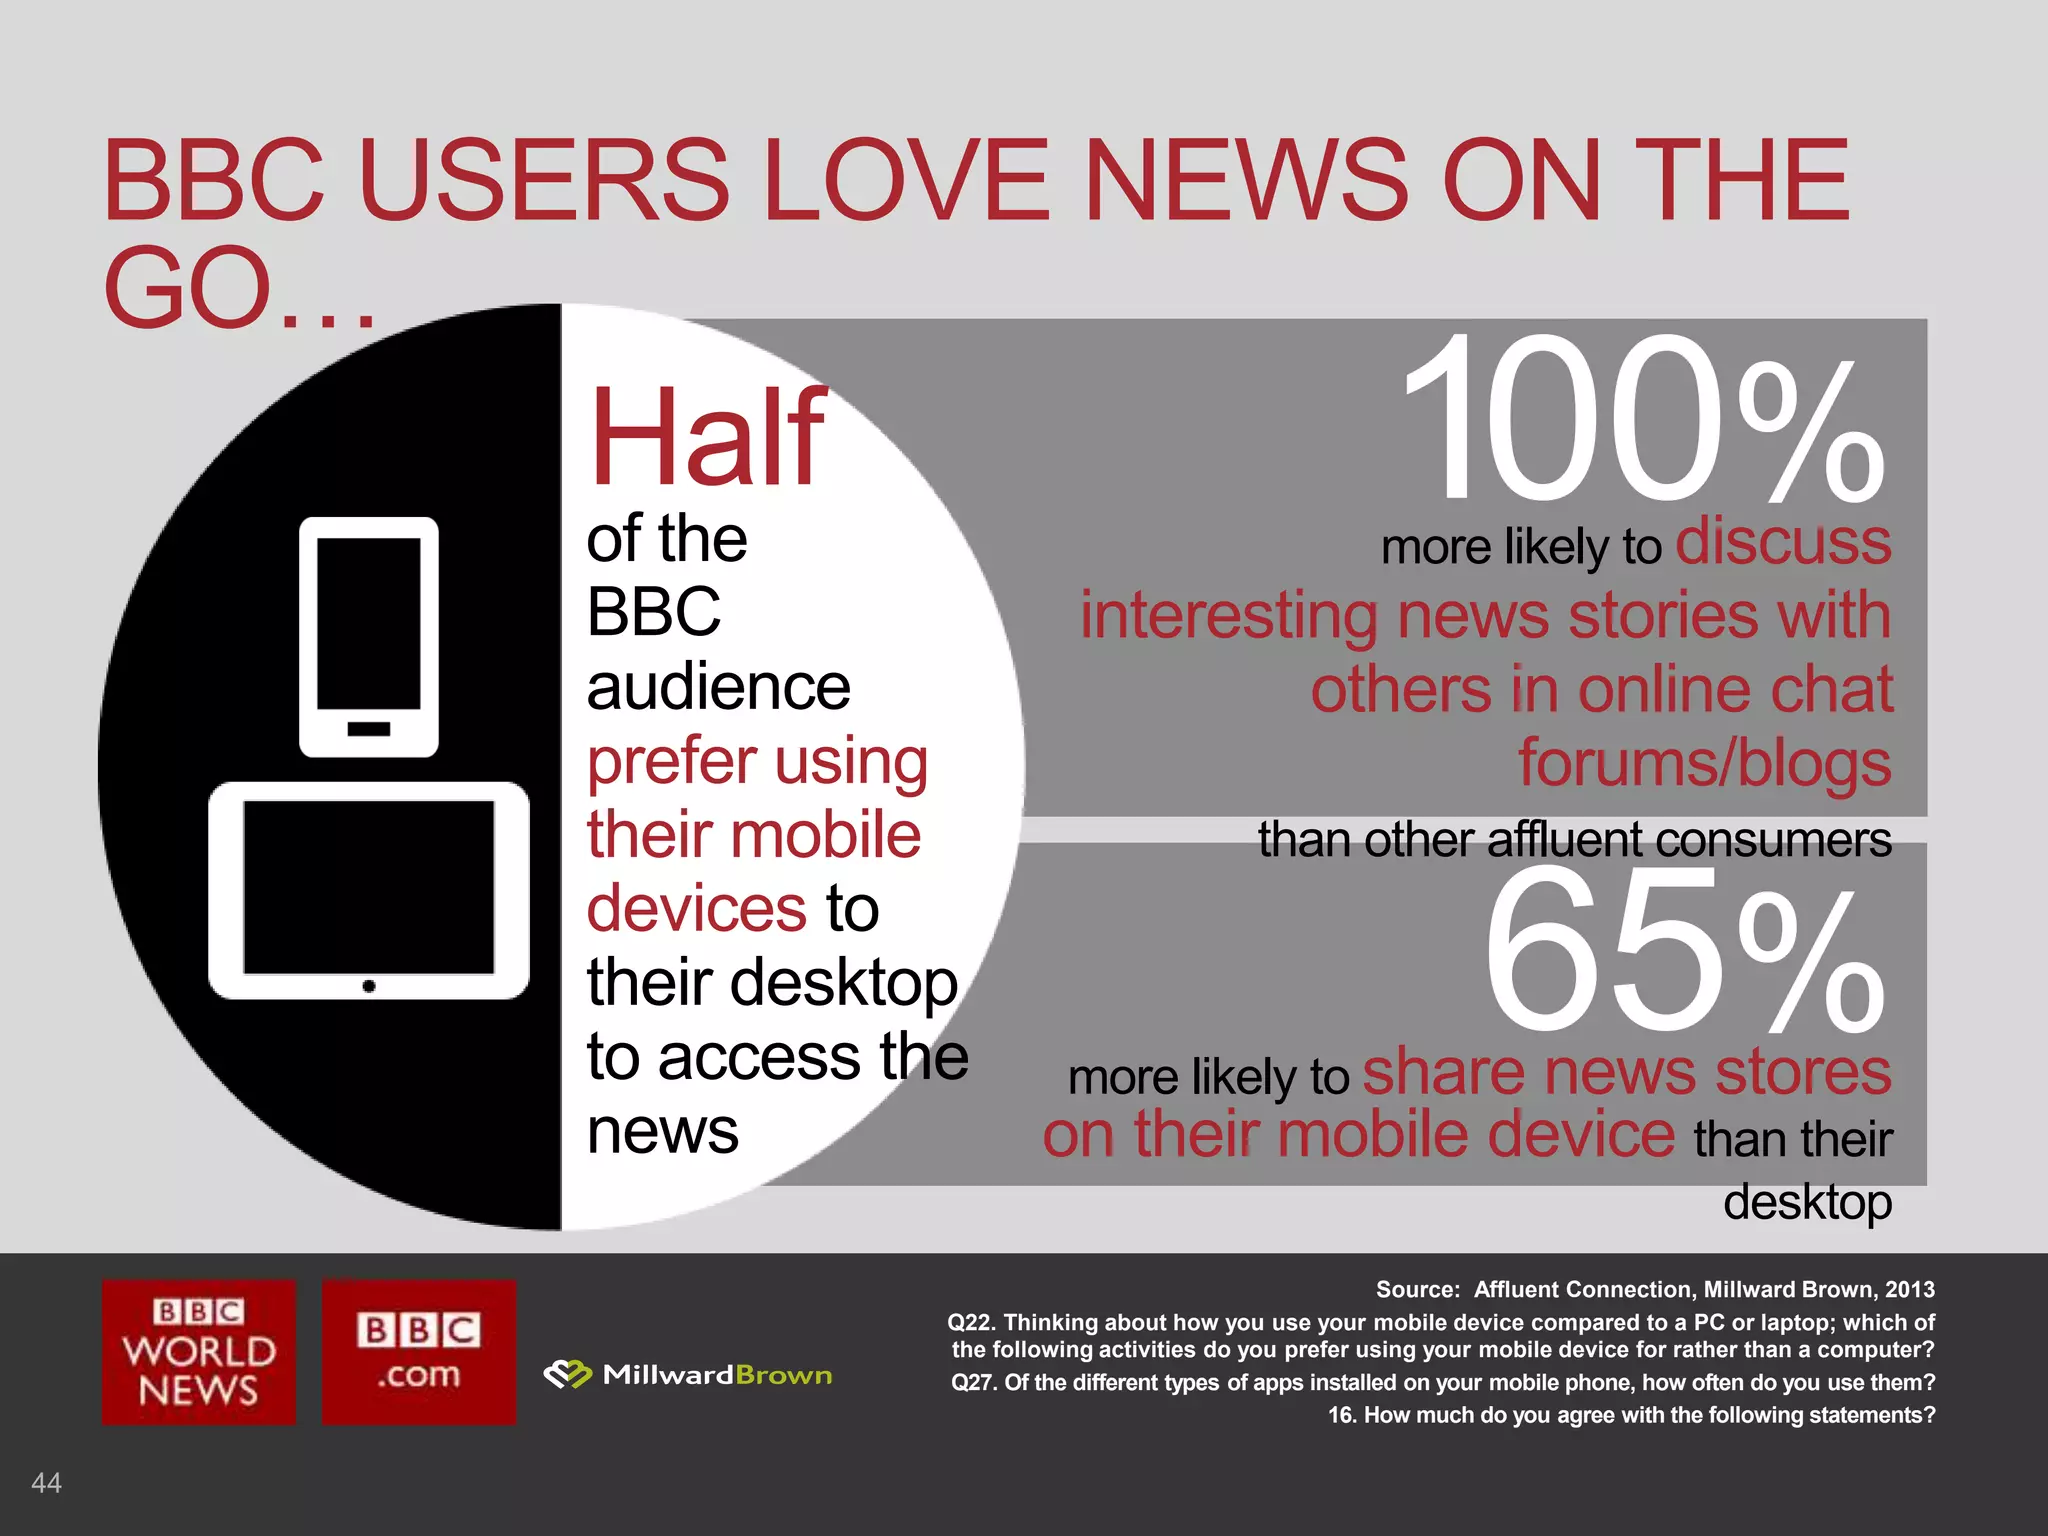
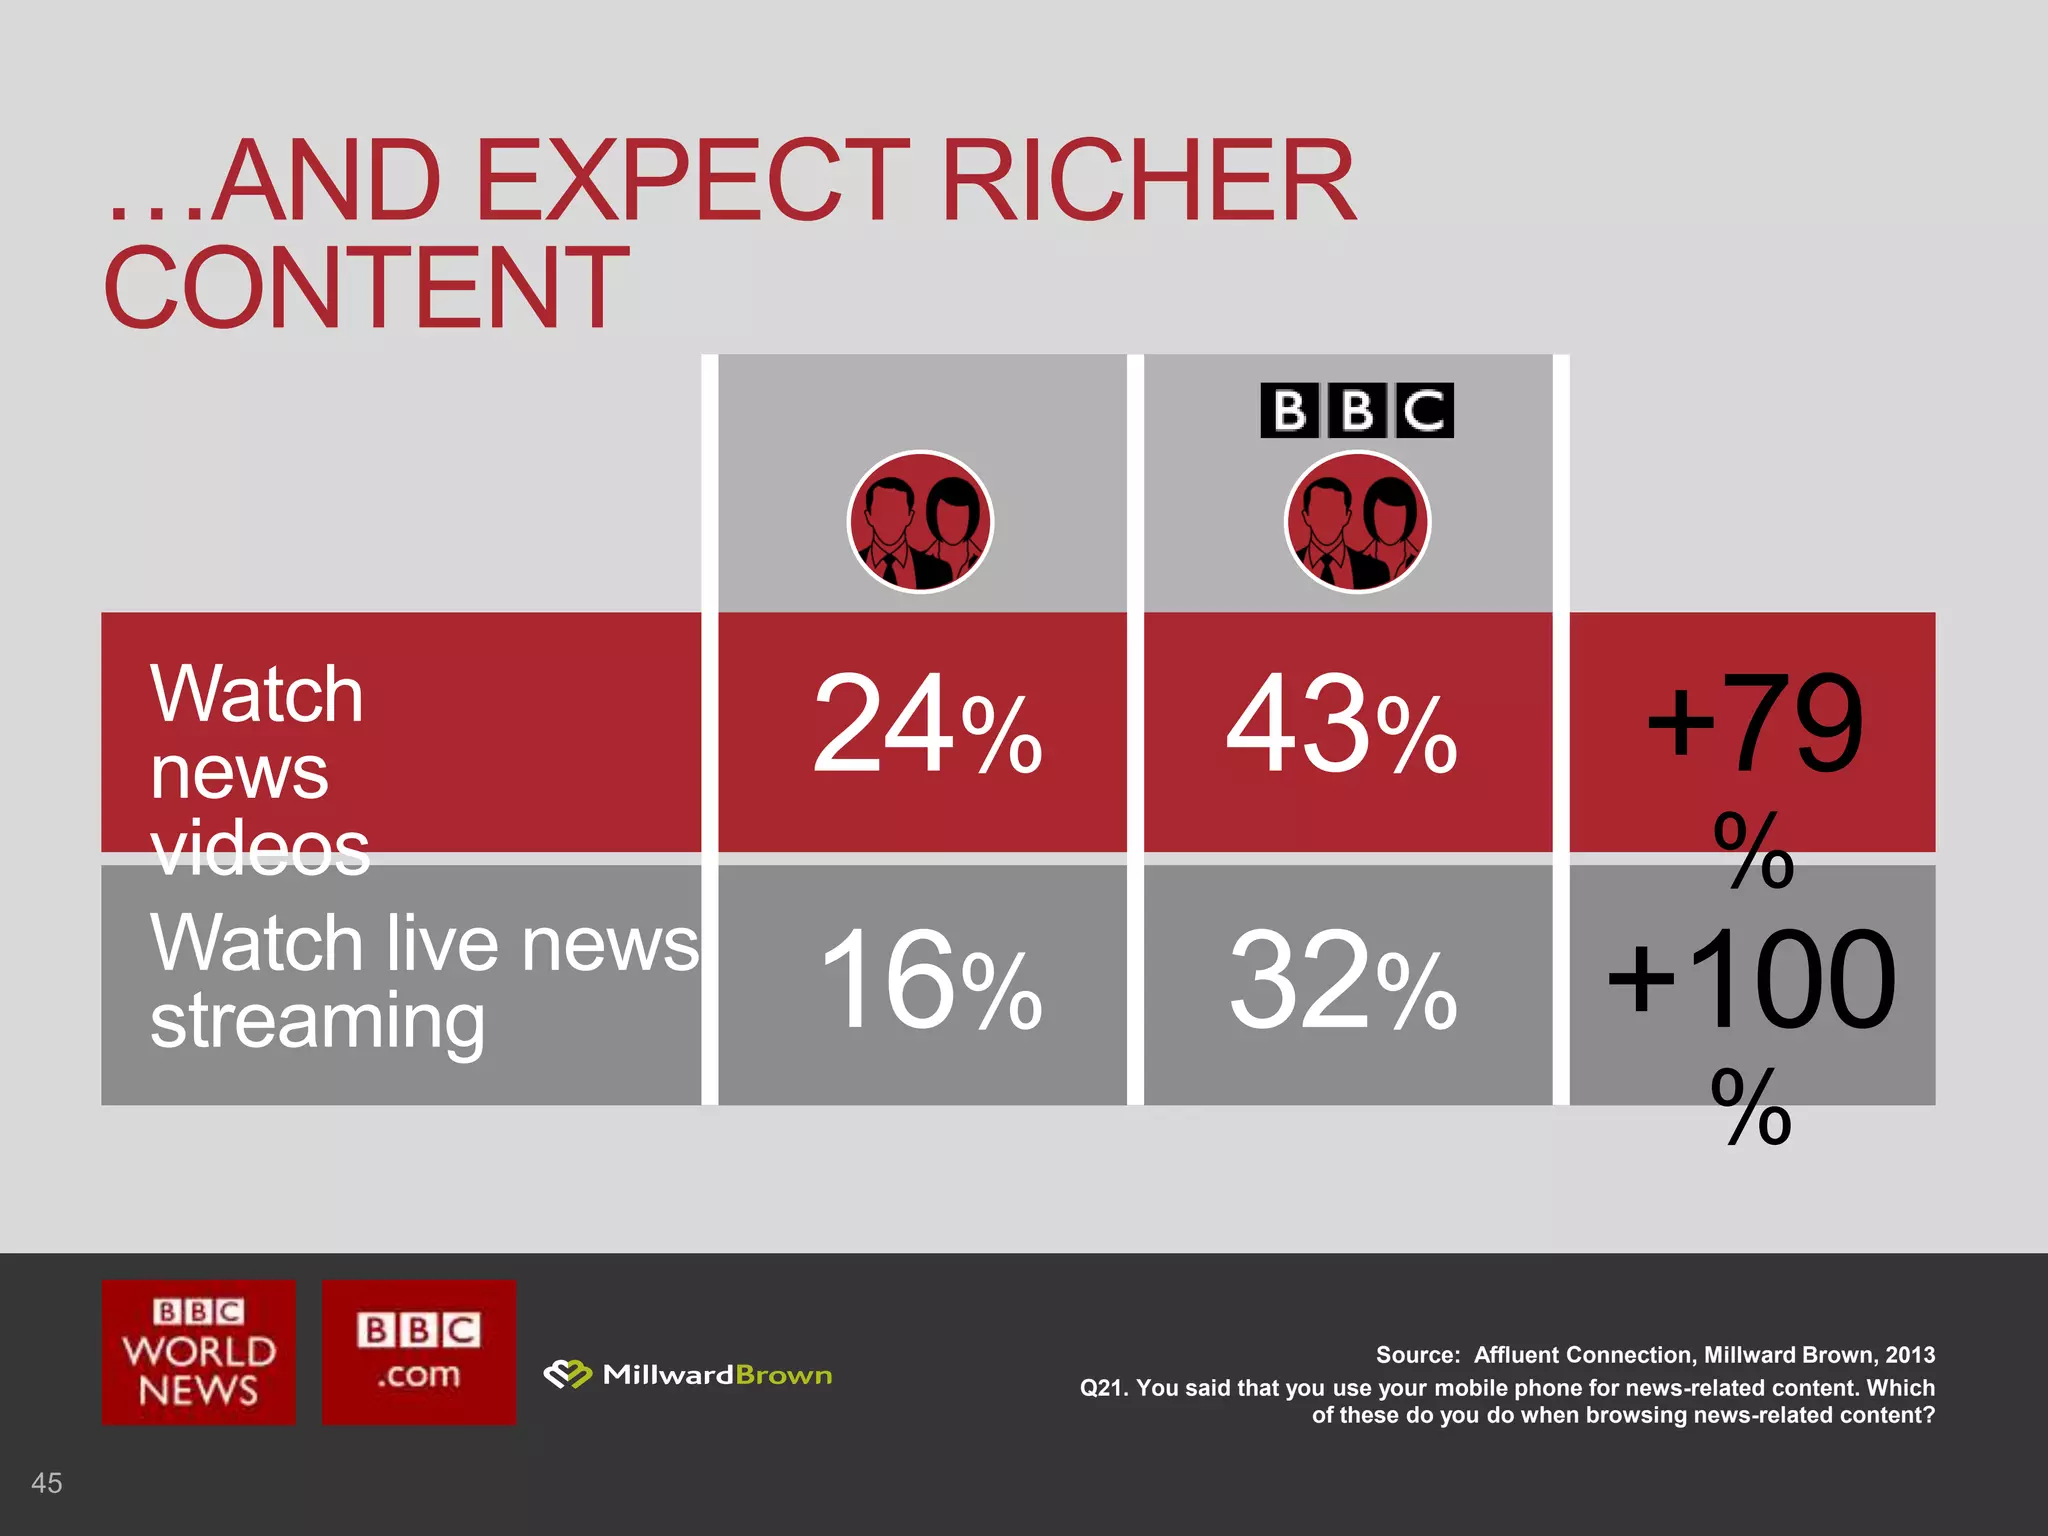
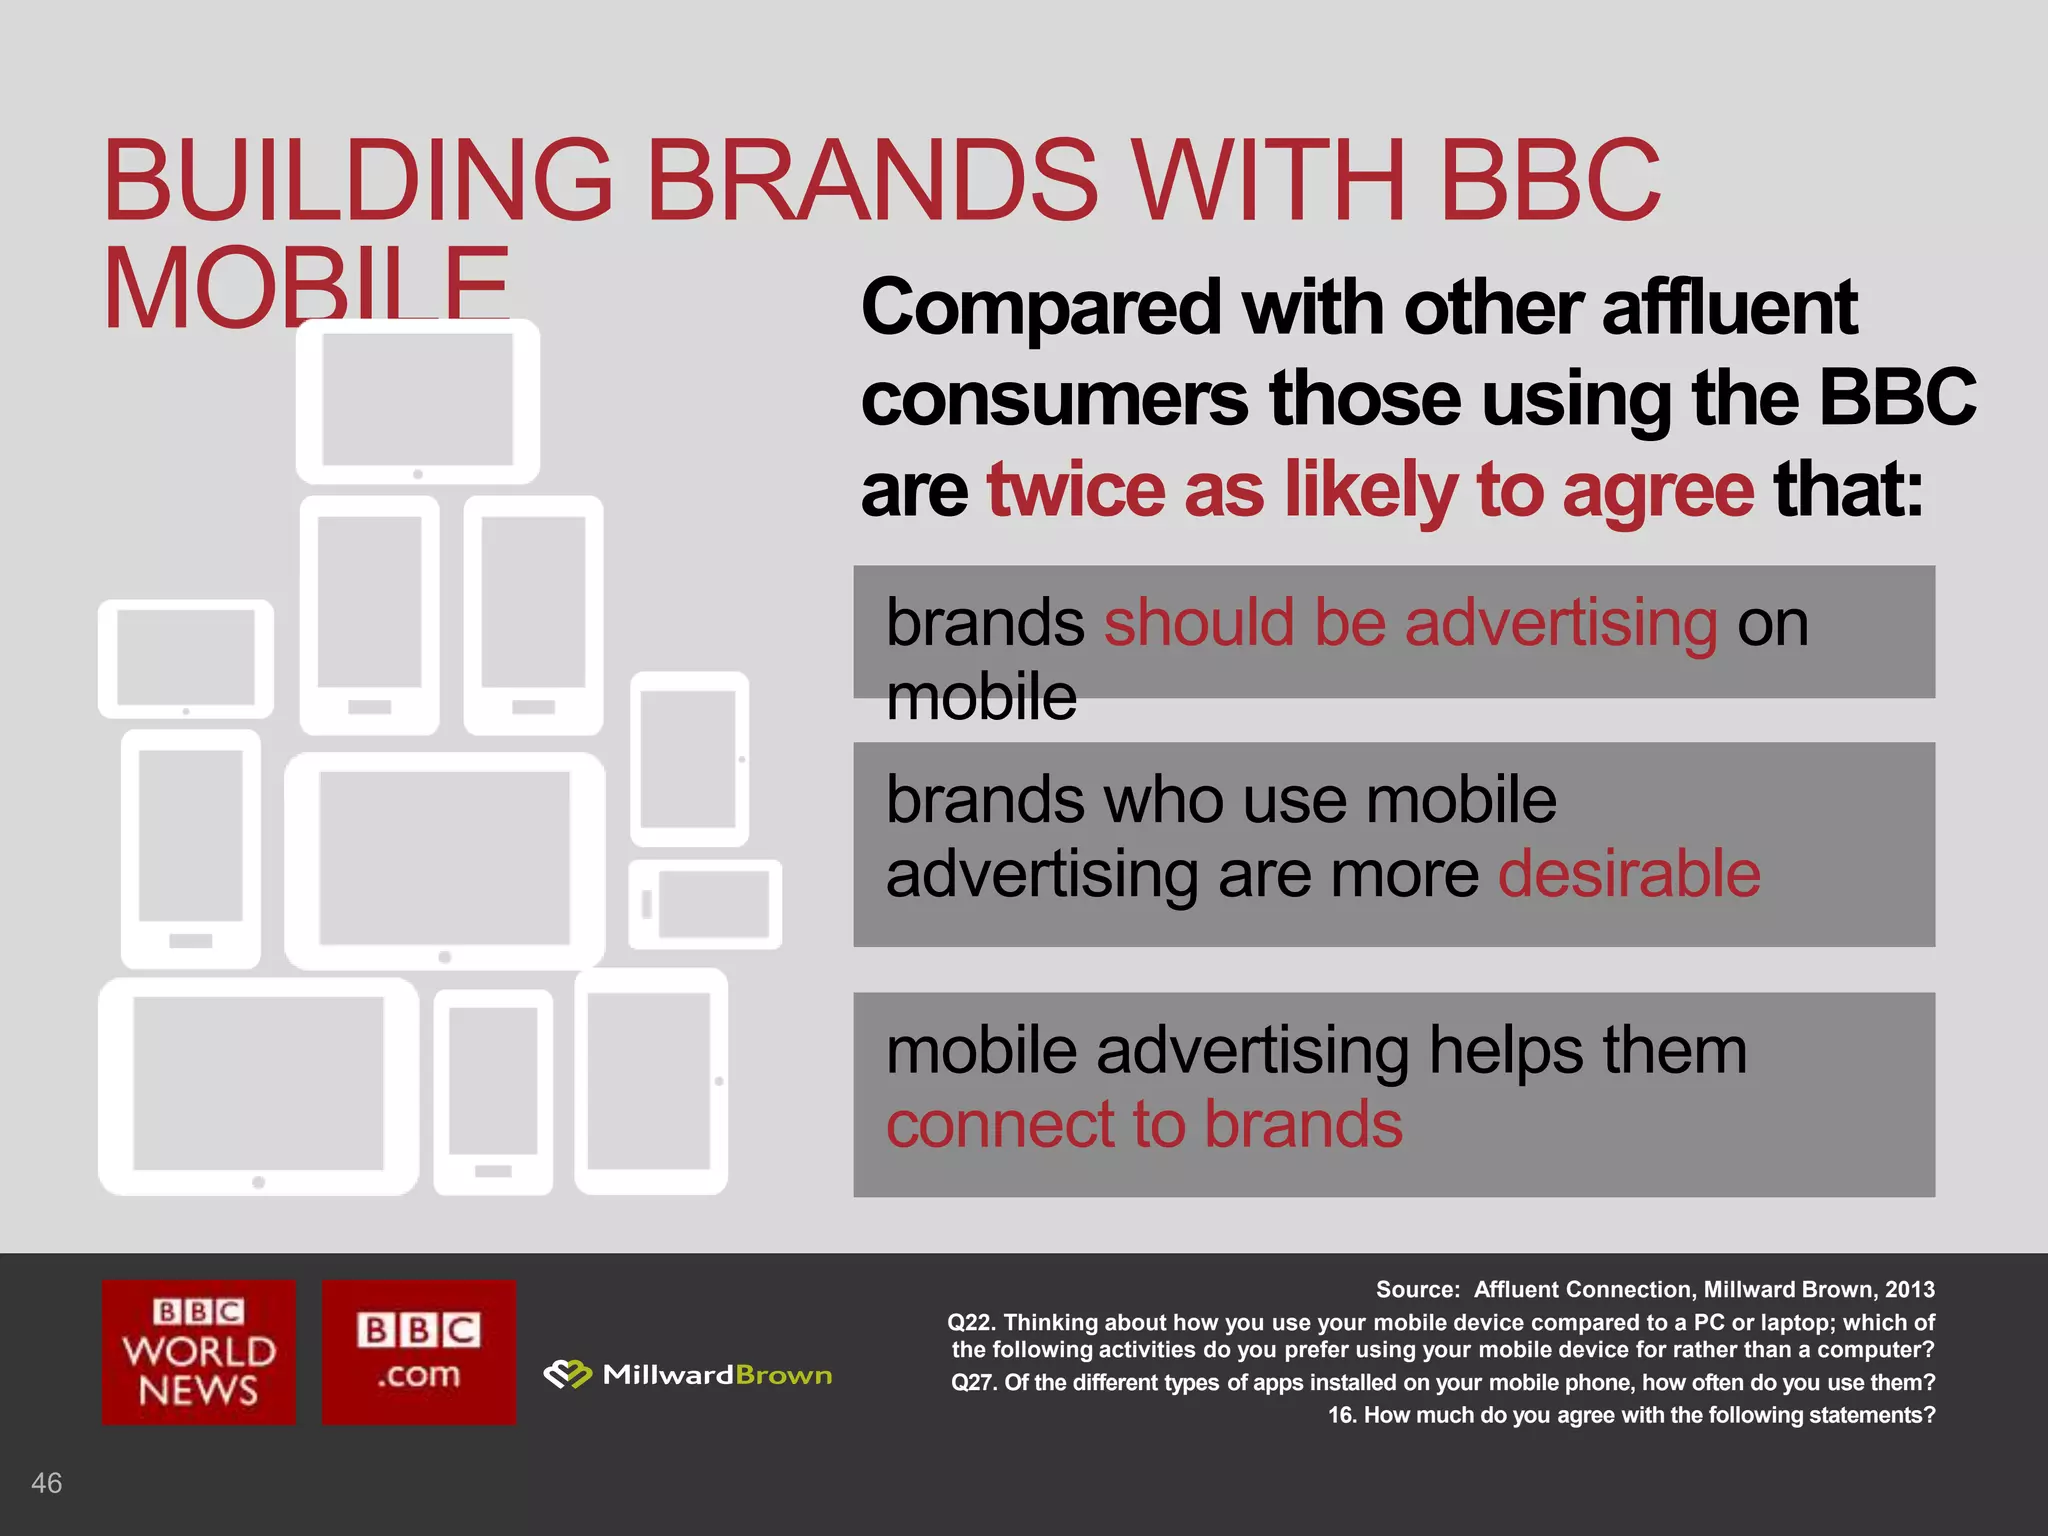
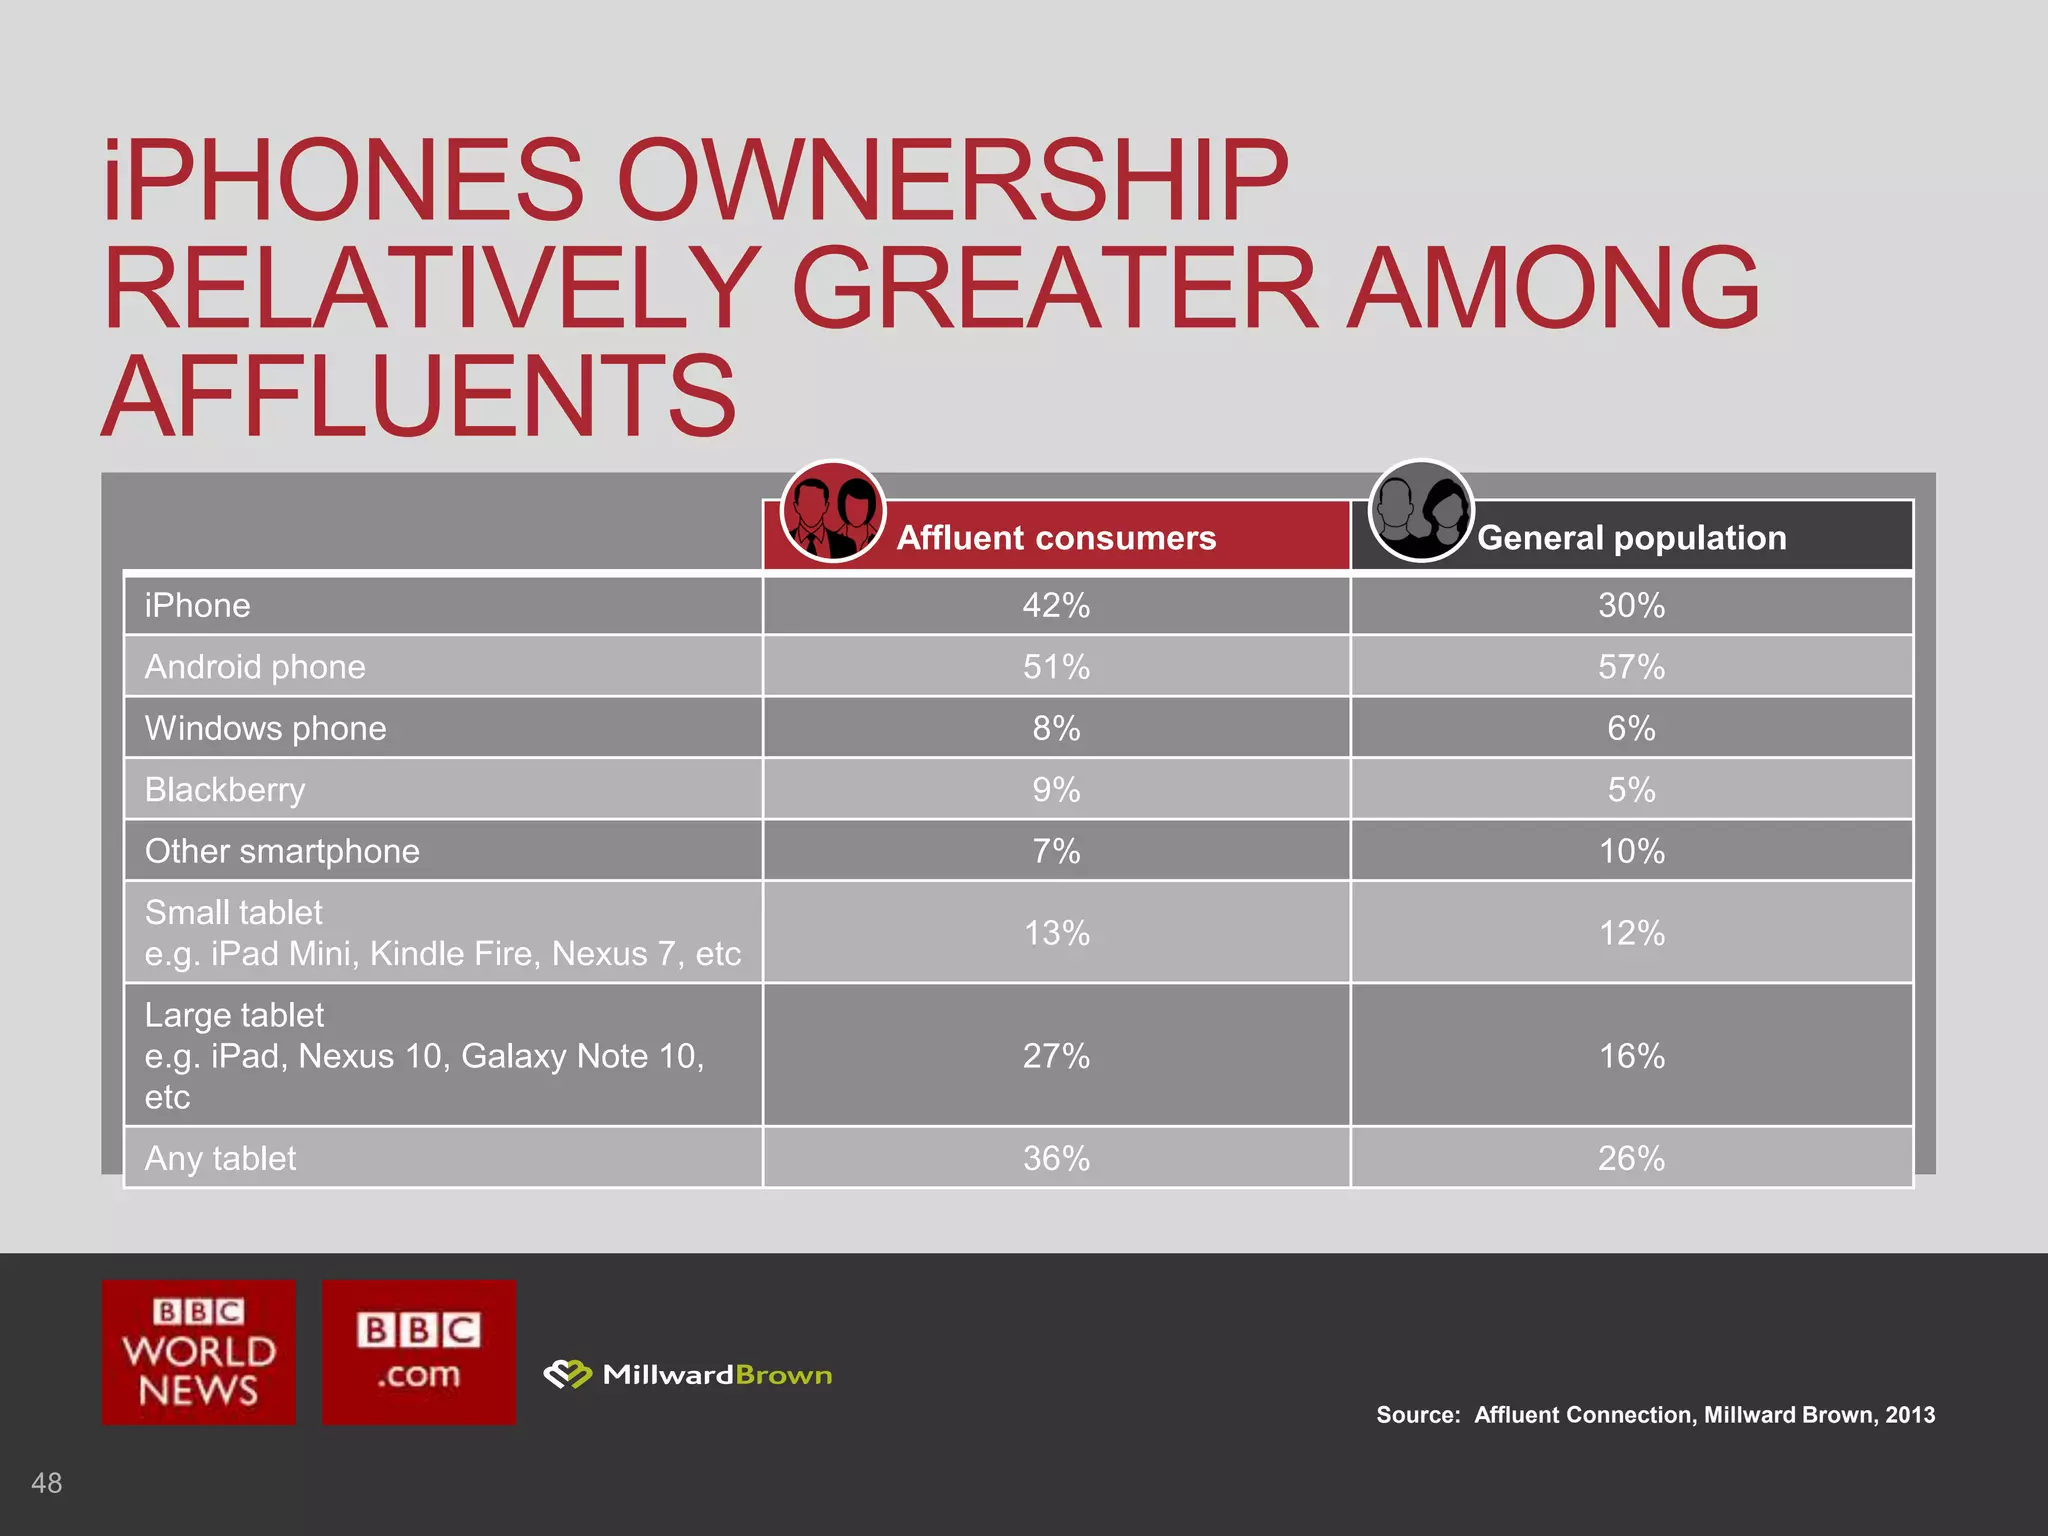
1. The document analyzes data from a study on smartphone and tablet usage among affluent consumers in several countries. It finds that affluent consumers use their mobile devices extensively and prefer them over desktop computers for many tasks like accessing news, social media, and work-related activities.
2. Affluent consumers, especially those with the latest generation of devices, are highly receptive to mobile advertising. They are willing to see ads if it means accessing free content and services, and feel mobile ads can help brands appear modern, innovative, and in touch with their needs.
3. The data shows affluent consumers spend significant time on their mobile devices each day accessing news apps and content, checking social media
The Treasure is in the Data - How Three International Brands Found Marketing Gold.
Alice Donaldson from Exponential, presented this deck at iMedia Brand Summits, Asia. #imbsummit
Consumers are in charge, and brands are in charge of ensuring they remain front and center along the consumer journey. To do that, they must understand the touchpoints that matter, enhance the targeting triple play, and ensure that the process is working properly. This requires understanding and quantifying consumer behavior. Thankfully, consumers in charge also means that consumers reveal a great deal—if you know where to look and don’t shy away from big data. This presentation looks across industries to reveal key tenets for how to make marketing remarkable.
What trends will shape the media, publishing and ad industry in 2016? The Guardian gives its perspective on subjects ranging from the adblockalypse to the rise of super apps, and from virtual reality to the power of emojis.
Be smart about smartphones analyses newsbrand reading behaviour tracked on smartphones over three months and explores how young people specifically weave newsbrands into their 24/7 mobile lives. We challenge assumptions, provide detailed insight into the smartphone day on newsbrands and suggest five key ways that will help clients and agencies to optimise campaign engagement.
The rise of Cross Platform Media Consumption in US : 70% of digital users ...Sumit Roy
Users are now moving across their digital screens, From PC to mobile to Gaming device to their Tablets or Kindle... The increasing duplication of users across devices .. is a huge challenge to Brands .The digital universe that accesses the internet via PC or mobile device has grown to over 200
million people in the U.S. alone. As the number of connected adults has grown, so have the amount of cross-screen users. In fact, 70% of digital users are now cross-device, up from 63% a year ago.% during the same period
State of the Media: Social Media Report Q3
Social media's popularity continues to grow, connecting people with just about everything they watch and buy.
The latest Nielsen insights provide some answers on exactly how powerful this influence is on consumer behavior, both online and off.
The value of the time consumers spend online and on social networks and blogs continues to grow, most visible through the influence on purchase decisions. For instance, 60 percent of people who use three or more digital means of research for product purchases learned about a specific brand or retailer from a social networking site.
As the influence of social media – and those using social media – continues to grow, it’s crucial for traditional media, retailers, brands and advertisers to understand how different consumer segments use and share content. Nielsen’s “State of the Media: The Social Media Report – Q3 2011” presents a snapshot of the current social media landscape and audiences in the U.S. and other major markets.
Como bien lo dice el título, es un estudio que hace eMarketer para conocer hábitos, comportamiento y consumo de medios digitales del segmento mejor definido como "millennial". Esta es su versión 2014.
Facebook might be the giant in social networking but WhatsApp has taken the lead in social messaging. It's not only WhatsApp thought - our smartphone users research in the US, Brazil, South Africa, Indonesia and China reveals some surprising numbers.
In 2011 Myanmar opened up to the world again and mobile ownership and internet usage finally started to climb.
We surveyed 550 mobile internet users in Myanmar for the first time ever.
Facebook Keynote for PhoCusWright India 2016Lee McCabe
Travel Redefined: Connecting with People in a Mobile first, Always on World. Keynote presentation made by Lee McCabe, Global Head of Travel Strategy at PhoCusWright India - March 2016
FT Innovate 2013 Keynote: Facebook - Navigating Travel in a Connected WorldLee McCabe
Large, people-based platforms allow for three things: inspiration, conversion, and retention. That's what Facebook is for travel marketers—and the most successful marketers incorporate all three.
SCREEN WARS: THE BATTLE FOR EYE SPACE IN A TV-EVERYWHERE WORLDAidelisa Gutierrez
While media fragmentation is happening across all formats, the “Screen Wars” report focuses on video programming, which we define as any type of content, such as TV, cable shows, professional video or user-generated content, that is watched on your TV, PC, mobile phone, tablet or e-reader device. The Nielsen Global Digital Landscape Survey polled 30,000 online respondents in 60 countries to understand how the changing digital landscape is affecting how, where and why we watch video programming. We also examine consumption preferences for video programming, including the devices most commonly used for selected genres and the devices used to view video at home and on the go.
http://www.nielsen.com/us/en/insights/reports/2015/screen-wars-the-battle-for-eye-space-in-a-tv-everywhere-world.html
There are 2.5 billion Millennials globally, today in 2015.
Millennials are the biggest consumer group of all. They are also driving change in every industry, especially mobile. From Twitter usage data to smartphone ownership, use these 15 statistics about the Millennial mobile owner in your next presentation.
All these statistics come from my new Total Youth Mobile Report 2015. Get a sneak peak here...
Live Webinar: Winning Affluent MillennialsLinkedIn
Affluent Millennials are on the brink of a massive generational transfer of personal wealth and, as one of the largest generations in history, this powerful demographic will command major changes within the finance industry. How can you help your Financial Services clients prepare for it?
Tune into this webinar where Emily Friedman, senior research consultant at LinkedIn, will present results from a global study conducted by LinkedIn and Ipsos of about 9200 Millennial and GenX Internet users to answer this question.
The Millennial Shift: Financial Services and the Digital GenerationLinkedIn
Maya Pope-Chappell, News Editor, LinkedIn
Theresa McLaughlin, CMO Canadian Banking, Auto, and Wealth, TD Bank
Denise Karkos, CMO, TD Ameritrade
Marty Willis, Chief Marketing Officer, OppenheimerFunds
Laura Desmond, CEO, Starcom MediaVest Group
Donna Sabino, SVP, Ipsos
Bill Sullivan, Head of Global Financial Services, Market Intelligence, Capgemini
Leslie Gillin, Managing Director and Chief Marketing Officer, Citi Global Consumer Bank
With one of the largest generations in history comes tremendous buying power: Millennials spend $1.3 to $1.7 trillion annually. In fact, this group of digital natives represents a lucrative market and the next generation of financial clients. To make inroads with Millennials, firms must appeal to their demand for services and experiences on par with those delivered by retail and other industries that have learned how to capitalize on consumer interactions in the digital era.
The world of Luxury is being challenged by a new set of ideals and behaviours as Millennials become increasingly powerful consumers. So what are the new Rules of Luxury that brands need to be aware of, and how are they adapting?
Luxury 2020: The Trends Shaping the Luxury Market of the FutureSeymourSloan
By 2020 we will see a different luxury market.
Luxury will not be immune to the businesss and external changes reshaping the world and these will create challenges that brands must be aware of and seek to maximise.
A piece I wrote for a talk on The New Culture of Luxury. Exploring how modern brands, platforms, and ideas are influencing the fashion and luxury category.
Watch the video here: http://blog.mindswarms.com/mindswarms-on-millennials-technology-and-the-new-luxury/
A top line report on how Millennials view Luxury differently from previous generations.
September 2013
The values of Millennial shoppers are changing how we define and sell luxury. Learn how this consumer has evolved, and which luxury brands are winning by offering meaningful experiences instead of just stuff.
This LinkedIn & Ipsos study provides actionable insights on:
• How Affluent Millennials are dramatically reshaping the future of the finance industry.
• How Affluent Millennials are preparing for tomorrow.
• What Affluent Millennials are looking for in a financial services provider and why it’s important to begin strengthening relationships with them today.
Understand the cross-device consumer in just 15 minutesJim Nichols
To get the most out of your marketing and advertising programs, it’s essential that you understand today’s consumer and the multi-device phenomenon of how they connect, communicate, shop and buy. Get the facts about cross-device consumer behaviors, and then four tips on how to use them to your brand advantage.
Cross-device usage
Mobile’s share of total connected time
The "mobile-only" and "mobile-mostly" connected consumer
Cross-device purchasing
Download this compelling information today so you can develop a cross-device strategy that delivers better ROI.
Understand the cross-device consumer in just 15 minutesConversant, Inc.
To get the most out of your marketing and advertising programs, it’s essential that you understand today’s consumer and the multi-device phenomenon of how they connect, communicate, shop and buy. Get the facts about cross-device consumer behaviors, and then four tips on how to use them to your brand advantage.
Cross-device usage
Mobile’s share of total connected time
The "mobile-only" and "mobile-mostly" connected consumer
Cross-device purchasing
Download this compelling information today so you can develop a cross-device strategy that delivers better ROI.
Consumers are in charge, and brands are in charge of ensuring they remain front and center along the consumer journey. To do that, they must understand the touchpoints that matter, enhance the targeting triple play, and ensure that the process is working properly. This requires understanding and quantifying consumer behavior. Thankfully, consumers in charge also means that consumers reveal a great deal—if you know where to look and don’t shy away from big data. This presentation looks across industries to reveal key tenets for how to make marketing remarkable.
Now in its fifth year, the Adobe Mobile Consumer Survey aims to not only give digital marketers insight into
how consumers are using their smartphones and tablet devices, but also provide guidance in how to identify
the most valuable customer segments. In conjunction with the Adobe Digital Index (ADI), which publishes
research on the latest digital marketing trends and insights across channels and industries, results from the
Adobe 2014 Mobile Consumer Survey helps digital marketers identify which target segments are spending the
most time on apps versus websites, as well as hone in on mobile habits within those segments that are
spending the most money.
South African Mobile Phone Use and Attitudes Report 2016Raymond Buckle
A Survey of Internet User’s Attitudes and Uses of Mobile Phones compared to those of Feature Phone users. Published February 2016 by Effective Measure in partnership with SilverstoneCIS and the IAB and MMA South Africa.
Effective Measure, a leading provider of digital audience, brand and advertising measurement together with SilverstoneCIS, a mobile first audience marketing and solutions group, surveyed 2,299 mobile Internet users in South Africa (between November and December, 2015).
Topics covered a range of areas including but not limited to users’ manufacturer preference, time on device, use of device and internet usage.
The survey was conducted across smartphones and feature
phones to highlight the differences in user consumption across the two types of mobile Internet connections.
Australian Media Consumption Trends 2015 - Created by Ryan Northover - Ninja Digital 2015.
How Are Australians consuming media in 2015? How is the media influencing buying behavior? How can brands get insight into the way we consume and are influenced by media in 2015? A report for brands in Western Australia and Australia.
Using mobile sites, apps, and emerging technologies to build loyalty.
1. Survey of mobile users
2: Key insights and findings
3: Conclusion
4: Best practices
Bluelight Mobile DigiPharm presentation Sam Walmsley
Mobile presentation from Bluelight Digipharm pre-workshop. Covering why pharma should be thinking about creating seamless digital experiences that work across all devices. Healthcare and patient stats on mobile usage. Thoughts on whether to create mobile content or develop apps.
How Second Screens Are Transforming TV ViewingMARC USA
Mobile devices are becoming an increasingly common part of our daily TV routines. According to the latest Nielsen survey of connected device owners, nearly half of smartphone owners (46%) and tablet owners (43%) said they use their devices as second screens while watching TV every day.
Important statistics that every business should know about the direction of mobile. This slide deck takes you through 8 different things that will impact how businesses connect with their customers through iPhone and Android mobile apps. This presentation is provided by Copper Mobile, a Dallas TX based enterprise mobile application solutions company.
Mobileday 2016 - User behavior & Insight; How to surf the wave? - Phan Tuan AnhTuấn Anh Phan
In order to understand mobile user behavior & insight in Asean & Emerging Market in 2016.
Why mobile?
In fact, users think mobile is just mobile, their smartphone
08 critical points for each Marketer in order to develop mobile marketing strategy
The combination of: Mobile Connects Everything + Consumer Decision Journey + Gamification = Mobile Advocacy Journey
For mobile, it's all about interactive + relative
[Note: This is a partial preview. To download this presentation, visit:
https://www.oeconsulting.com.sg/training-presentations]
Sustainability has become an increasingly critical topic as the world recognizes the need to protect our planet and its resources for future generations. Sustainability means meeting our current needs without compromising the ability of future generations to meet theirs. It involves long-term planning and consideration of the consequences of our actions. The goal is to create strategies that ensure the long-term viability of People, Planet, and Profit.
Leading companies such as Nike, Toyota, and Siemens are prioritizing sustainable innovation in their business models, setting an example for others to follow. In this Sustainability training presentation, you will learn key concepts, principles, and practices of sustainability applicable across industries. This training aims to create awareness and educate employees, senior executives, consultants, and other key stakeholders, including investors, policymakers, and supply chain partners, on the importance and implementation of sustainability.
LEARNING OBJECTIVES
1. Develop a comprehensive understanding of the fundamental principles and concepts that form the foundation of sustainability within corporate environments.
2. Explore the sustainability implementation model, focusing on effective measures and reporting strategies to track and communicate sustainability efforts.
3. Identify and define best practices and critical success factors essential for achieving sustainability goals within organizations.
CONTENTS
1. Introduction and Key Concepts of Sustainability
2. Principles and Practices of Sustainability
3. Measures and Reporting in Sustainability
4. Sustainability Implementation & Best Practices
To download the complete presentation, visit: https://www.oeconsulting.com.sg/training-presentations
Digital Transformation and IT Strategy Toolkit and TemplatesAurelien Domont, MBA
This Digital Transformation and IT Strategy Toolkit was created by ex-McKinsey, Deloitte and BCG Management Consultants, after more than 5,000 hours of work. It is considered the world's best & most comprehensive Digital Transformation and IT Strategy Toolkit. It includes all the Frameworks, Best Practices & Templates required to successfully undertake the Digital Transformation of your organization and define a robust IT Strategy.
Editable Toolkit to help you reuse our content: 700 Powerpoint slides | 35 Excel sheets | 84 minutes of Video training
This PowerPoint presentation is only a small preview of our Toolkits. For more details, visit www.domontconsulting.com
LA HUG - Video Testimonials with Chynna Morgan - June 2024Lital Barkan
Have you ever heard that user-generated content or video testimonials can take your brand to the next level? We will explore how you can effectively use video testimonials to leverage and boost your sales, content strategy, and increase your CRM data.🤯
We will dig deeper into:
1. How to capture video testimonials that convert from your audience 🎥
2. How to leverage your testimonials to boost your sales 💲
3. How you can capture more CRM data to understand your audience better through video testimonials. 📊
B2B payments are rapidly changing. Find out the 5 key questions you need to be asking yourself to be sure you are mastering B2B payments today. Learn more at www.BlueSnap.com.
In the Adani-Hindenburg case, what is SEBI investigating.pptxAdani case
Adani SEBI investigation revealed that the latter had sought information from five foreign jurisdictions concerning the holdings of the firm’s foreign portfolio investors (FPIs) in relation to the alleged violations of the MPS Regulations. Nevertheless, the economic interest of the twelve FPIs based in tax haven jurisdictions still needs to be determined. The Adani Group firms classed these FPIs as public shareholders. According to Hindenburg, FPIs were used to get around regulatory standards.
Top mailing list providers in the USA.pptxJeremyPeirce1
Discover the top mailing list providers in the USA, offering targeted lists, segmentation, and analytics to optimize your marketing campaigns and drive engagement.
Event Report - SAP Sapphire 2024 Orlando - lots of innovation and old challengesHolger Mueller
Holger Mueller of Constellation Research shares his key takeaways from SAP's Sapphire confernece, held in Orlando, June 3rd till 5th 2024, in the Orange Convention Center.
3. 3
Source: Affluent Connection, Millward Brown, 2013
SMARTPHONE / TABLET
USERS SURVEYED
SWEDE
N
INDIA
GERMAN
Y
HONG KONG
AUSTRALIA
UNITED STATES
4. 4
CONNECTING TO THE AFFLUENT
Affluent consumers
The top 20% income
earners, mirroring Ipsos
PAX, EMS and
Mendelsohn surveys
General populationand we compared them to the
WE WORKED WITH THE BEST
Millward Brown
a leading research agency specialising in advertising, media, digital and brand equity
research
Source: Affluent Connection, Millward Brown, 2013
5. 5
AFFLUENTS LOVE NEW TECH
Source: Affluent Connection, Millward Brown, 2013
Q3. What type(s) of mobile devices do you currently use? By mobile phone we mean
a device which you make calls and/or texts on. By tablet, we mean your mobile device
which typically uses touch screen and requires WiFi to connect to the internet
Q3a. Please name the specific make and model of your main mobile phone?.
20%
Latest generation
6%
Older generation
13% 12%
29% 3% 27% 16%
Large Small
SMARTPHONE TABLET
7. 7
BE WHERE THEY ARE…
Source: Affluent Connection, Millward Brown, 2013
Q6. Which of the following best describes how frequently you
access the Internet (excluding apps) from your mobile device?
At least once an hour
18% higher than the general
population
39%
of affluents access the
internet on mobile
Latest generation
users are
twice as
likelyto access the internet hourly
versus users of older generation
2x
8. 8
GETTING DOWN TO BUSINESS
Source: Affluent Connection, Millward Brown, 2013
Q17. Do you use your mobile device for business?
Q31. When thinking of your mobile phone/tablet, please indicate
how strongly you agree or disagree with the following statements.
Compared to the general population…
more likely to use
their mobile phone
for business
27%
more likely to agree that their mobile
phone is the primary tool for
organising their work life36%
more likely to agree that
increasing amount of their
work is accomplished on
the phone
35%
9. 9
TIME WELL SPENT
Source: Affluent Connection, Millward Brown, 2013
Q18a. On a typical week day what percentage of your total usage of
your mobile phone is work-related?
46%of affluents
who use their
phone for
business
APAC region blazes the trail
53% India
54%Australia
53% Hong
Kong
spend
most of
their time on
work-related usage
10. 10
DIFFERENT ROLES
Source: Affluent Connection, Millward Brown, 2013
Q.31. When thinking of your mobile phone, please indicate how strongly you agree or
disagree with the following statements. When thinking of your tablet, please indicate
how strongly you agree or disagree with the following statements.
Q17. Do you use your mobile device for business?
51%
use their mobile phone for business
versus 10% who use their tablet
51%
indispensible more
efficient
organising their
personal life
feel that their mobile is
when they are on the go
Versus 34% for tablet
59%
say their mobile makes
them
versus 48% for tablet
44%
state that their mobile
is their primary tool for
versus 31% for tablet
11. 11
SO, WHAT IS A TABLET FOR…?
Source: Affluent Connection, Millward Brown, 2013
Q20 In a typical week, how many hours do you spend using a
tablet?
Around a quarter of
affluent consumers
spend over five
hours per week
playing games and
watching
entertainment
videos on their
tabletNearly a third spend over five
hours per week social networking
12. 12
THE MOBILE EVOLUTION
Source: Affluent Connection, Millward Brown, 2013
Q31. When thinking of your mobile phone, please indicate how
strongly you agree or disagree with the following statements.
10
20
30
40
50
60
70
General population Affluent consumers Latest generation
% agree with statement
Mobile phone makes me more
efficient
My mobile phone is indispensible
as I am always on the go
Mobile phone is primary tool for
organising personal life
Mobile phone is primary tool for
organising work life
14. 14
CLEAR PICTURE EMERGES IN
NEWS
Source: Affluent Connection, Millward Brown, 2013
Q16. How much do you agree with the following statements?
Q22. Thinking about how you use your mobile device compared to a
PC or laptop; which of the following activities do you prefer using
your mobile device for rather than a computer?
30%
prefer mobile devices to their
desktop for accessing news
Compared to the general population…
“My mobile gives me
news quickly and
instantly without having
to switch on the PC.
The size of the screen
means it's easy to read,
too.”
MALE, 28, GERMANY
15%
more likely to
share news
stories on a
mobile than
desktop
28% for business/finance
news
for consuming current
affairs or breaking news
11%more likely to prefer using
mobile devices than
desktop
15. 15
DIGITAL NEWS CONSUMPTION IS
CHANGING
Sources: Affluent Connection, Millward Brown, 2013
and Connecting The Story, InSites Consulting, 2012
Samples: 1,908 (InSites Consulting) and 3,000 (Millward Brown)
Q15. If you could only use one device to consume news, which would it be?
“I’ve always got my
phone on me and I
always keep up-to-
date.”
FEMALE, 27,
GERMANY
“If you could only use one device to consume news”
YoY2012/13
+15
%mobile
phones
+9%
tablets
-17%
desktop
16. 16
ENGAGING THE AUDIENCE
Sources: Affluent Connection, Millward Brown, 2013
and Connecting The Story, InSites Consulting, 2012
Samples: 1,908 (InSites Consulting) and 3,000 (Millward Brown)
Q.14. How would you describe the way you consume news on each device?
2012
37%Skim or
scan the
headlines
2013
32% -13%
13% 16% +21
%
Read / watch
in depth
“How you consume news on mobile phones”
17. 10
15
20
25
30
35
General population Affluent consumers Latest generation
% preference for different news types on mobile versus
desktop
Current affairs/breaking news
Business/finance news
Sports news
17
GROWING PRERENCE FOR NEWS
ON THE GO
Source: Affluent Connection, Millward Brown, 2013
Q22. Thinking about how you use your mobile device compared to a
PC or laptop; which of the following activities do you prefer using
your mobile device for rather than a computer?
18. 10
20
30
40
50
60
70
80
General population Affluent consumers Latest generation
% consuming different news formats on mobile phone
Browse news headlines
Read news articles
Read articles connected to the
main article
18
DIGGING DEEPER
Source: Affluent Connection, Millward Brown, 2013
Q21. You said you use your mobile phone for news-related content.
Which of these do you do when browsing news-related content?
19. 19
AFFLUENTS LOVE NEWS APPS
Source: Affluent Connection, Millward Brown, 2013
Q27. Of the different types of apps installed on your mobile phone, how often do you use
them?
Q28. Of the different types of apps installed on your tablet, how often do you use them?
Q29: You said you have a news app installed on your mobile device. Which method of
accessing the news do you prefer?
access news apps at least once a day – 13% more
than the general population41
%
Travel, business and finance are also more important for
affluents
News Most
used
apps
Social
networking
20. 20
AFFLUENTS LOVE EFFICIENCY
Source: Affluent Connection, Millward Brown, 2013
Q30: Which of the following best describes why you prefer to use an
application rather than your browser?
“I can easily access
news apps – it’s
faster than browsing
websites on your
computer.”
MALE, 22, INDIA
“It is easier to get news
on my mobile device
via the app and the
app alerts me to
breaking news.”
MALE, 31, USA
Reasons they prefer apps
over browsers…
Efficiency
57%
Speed 20%
Tailored look and feel
11%
21. 21
OPENING UP A WHOLE
NEW WORLD
Source: Affluent Connection, Millward Brown, 2013
Q21. You said that you use your mobile phone for news-related content. Which
of these do you do when browsing news-related content?
34%Watch
news
videos
31% +10
%
Watch live news
streaming
Latest generation Older generation
23% 21% +10
%
22. 22
AND IT’S THE BEST OF
BOTH WORLDS
Source: Connecting The Story, InSites Consulting, 2012
Q: For each device you have access to, please tell me, for a typical 24-hour
period, when you would use it to access the news or consume the news during
the week? Base: Tablet users: 2,014 / Non Tablet users: 1,596
NON
TABLET
USERS
TABLET
USERS`
% using smartphone to access news across the day
35
30
25
20
15
10
5
0
24. 24
ENHANCE YOUR BRAND
Source: Affluent Connection, Millward Brown, 2013
Q40. To what extent do you agree or disagree with the below statements?
15% higher than the general
population
Advertising on mobile will enhance brand perception
asmodern and
dynamic
25. 25
AND MAKE IT PERSONAL
Source: Affluent Connection, Millward Brown, 2013
Q38. Please select how much you agree or disagree with the below statements.
Seeing an ad on my mobile device for a brand makes me think that the brand is
Seeing an ad on my mobile device makes
me think the brand is...
Latest generation Older generation
Trustworthy 29% 23%
Appealing 32% 25%
In touch with my needs 32% 27%
For someone like me 31% 24%
High quality 29% 23%
Desirable 29% 25%
Innovative 33% 24%
Reputable 29% 24%
26. 26
READY TO RECEIVE
Source: Affluent Connection, Millward Brown, 2013
Q.31 When thinking of your mobile phone, please indicate how strongly you agree or disagree
with the following statements.
I am willing to see ads on mobile websites as long as the websites are free to access
I am willing to share my location to get more relevant services and offers on my mobile phone.
content is
free
41%of affluents are
happy to see ads
on mobile websites
as long as the
Free content: Relevance:
18%
Affluents are
more likely to
share their
location to get
relevant services than the
general population
27. 27
MOBILE IS NOW AS
ACCEPTED AS DESKTOP
Source: Affluent Connection, Millward Brown, 2013
Q32. And how would you characterize your attitude towards each of the
following types of advertising?
uplift compared to the general
population
+27
%% affluents have a positive attitude towards advertising
18% 19% 20%
32. 33
…FOUR TIMES AMONG AFFLUENTS
Source: MarketNorms for Desktop, last 3 years, N=941 campaigns
AdIndex for Mobile Norms;, last 3 years, N=114, campaigns,
Change = Exposed-Control
Average brand metric changes for top 20% income earners: mobile vs. desktop campaigns
+4.7%
+71.4%
+63.2%
+12.5%
+16.8%
Aided Brand
Awareness
Brand
Favourability
Purchase
Intent
Ad
Awareness
Message
Association
+12.7
%
+2.4%
+16.2%
+3.3%
+2.7%
%
33. %
34
MOBILE IS TWICE AS IMPACTFUL
AMONG AFFLUNTS
Source: MarketNorms for Desktop, last 3 years, N=941 campaigns
AdIndex for Mobile Norms;, last 3 years, N=114, campaigns,
Change = Exposed-Control
Average brand metric changes for mobile campaigns: top 20% vs. rest of population
Aided Brand
Awareness
Brand
Favourability
Purchase
Intent
+4.7%
+71.4%
+63.2%
Ad
Awareness
Message
Association
+12.5%
+16.8%
+49.1
%
+4.5%
+32.4%
+3.4%
+4.7%
35. 36
THEY PAY ATTENTION
Source: Affluent Connection, Millward Brown, 2013
Q.45 How much attention did you pay to the advert?
Paid attention to the ad
Affluent
Consumers
% uplift vs general
population
MPU 80% +1%
Full-Page Interstitial 79% +3%
Pre-roll 76% -5%
Sponsorship Button 70% +6%
Banner 69% +1%
36. 37
AFFLUENTS SEE
ADVERTISING FORMATS
MORE POSITIVELY
Source: Affluent Connection, Millward Brown, 2013
Q.44 Overall, how favourable was your experience with the above advertising?
Very favourable / somewhat
favourable
Affluent
Consumers
% uplift versus
general population
Pre-roll 40% -%
MPU 39% +15%
Full-Page Interstitial 32% +10%
Sponsorship Button 28% +22%
Banner 28% +22%
37. 38
AND TAKE POSITIVE ACTION
11%
more likely they would like,
follow or comment about the
brand on Facebook or Twitter
12% 21%
more likely to
visit the
brand’s
website
more likely to look for
the brand in a store or
purchase the product / use the
service
Source: Affluent Connection, Millward Brown, 2013
Q48. After viewing the ad, how likely are you to: Like, follow or
comment about the brand on Facebook or Twitter?
18%
more likely to
recommend a
brand to
friends/family
38. 39
IT’S WHAT YOU DO THAT COUNTS
Source: Affluent Connection, Millward Brown, 2013
Q35. More specifically, in the past 4 weeks, which of the following actions have you
taken as a result of seeing one of the below formats of advertising?
A third have interacted with a mobile ad in the last four weeks
Acted on seeing an ad on their mobile
phone in the last four weeks
Banner ads on mobile 29%
Full-screen ads on
mobile
28%
Video ads on mobile 29%
Acted on seeing an ad on their tablet in
the last four weeks
Banner ads on tablet 29%
Full-screen ads on
tablet
27%
Video ads on tablet 29%
39. 40
CATCH UP WITH YOUR
AUDIENCE…
Recognise the changing media habits of affluent consumers.
Understand how they spend their time now and be where they
are
Mobile advertising is effective, even more so among affluent
consumers
Affluent consumers engage and take action with mobile
advertising
Technology is driving the change - a faster adoption of the trend
is vital
41. 42
BBC USERS LOVE THEIR MOBILES
Source: Affluent Connection, Millward Brown, 2013
31. When thinking of your mobile phone, please indicate how
strongly you agree or disagree with the following statements.
10
20
30
40
50
60
70
80
General
population
Affluent
consumers
Top-end
handsets
BBC General
population
BBC Affluent
consumer
% agreeing with statement
Mobile phone makes me more
efficient
Mobile phone is indispensible as I
am always on the go
Mobile phone is primary tool for
organising personal life
Mobile phone is primary tool for
organising work life
BBC audience is 31% more likely to own
the latest handsets
42. 43
GETTING THE JOB DONE
Source: Affluent Connection, Millward Brown, 2013
Q.6. Which of the following best describes how frequently you
access the Internet (excluding apps) from your mobile devices?
Q17. Do you use your mobile device for business?
Q31. When thinking of your mobile phone/tablet, please indicate
how strongly you agree or disagree with the following statements.
Compared with other affluent consumers they are:
more likely
to use their
phone for
work
37% 70%
more likely to
agree that an
increasing amount
of work isaccomplished on
the phone
43. 44
BBC USERS LOVE NEWS ON THE
GO…
Source: Affluent Connection, Millward Brown, 2013
Q22. Thinking about how you use your mobile device compared to a PC or laptop; which of
the following activities do you prefer using your mobile device for rather than a computer?
Q27. Of the different types of apps installed on your mobile phone, how often do you use them?
16. How much do you agree with the following statements?
65%
Half
of the
BBC
audience
prefer using
their mobile
devices to
their desktop
to access the
news
more likely to discuss
interesting news stories with
others in online chat
forums/blogs
than other affluent consumers
more likely to share news stores
on their mobile device than their
desktop
100%
44. 45
…AND EXPECT RICHER
CONTENT
Source: Affluent Connection, Millward Brown, 2013
Q21. You said that you use your mobile phone for news-related content. Which
of these do you do when browsing news-related content?
24%Watch
news
videos
43% +79
%
Watch live news
streaming 16% 32% +100
%
45. 46
BUILDING BRANDS WITH BBC
MOBILE
Source: Affluent Connection, Millward Brown, 2013
Q22. Thinking about how you use your mobile device compared to a PC or laptop; which of
the following activities do you prefer using your mobile device for rather than a computer?
Q27. Of the different types of apps installed on your mobile phone, how often do you use them?
16. How much do you agree with the following statements?
brands should be advertising on
mobile
Compared with other affluent
consumers those using the BBC
are twice as likely to agree that:
brands who use mobile
advertising are more desirable
mobile advertising helps them
connect to brands
47. 48
iPHONES OWNERSHIP
RELATIVELY GREATER AMONG
AFFLUENTS
Source: Affluent Connection, Millward Brown, 2013
Affluent consumers General population
iPhone 42% 30%
Android phone 51% 57%
Windows phone 8% 6%
Blackberry 9% 5%
Other smartphone 7% 10%
Small tablet
e.g. iPad Mini, Kindle Fire, Nexus 7, etc
13% 12%
Large tablet
e.g. iPad, Nexus 10, Galaxy Note 10,
etc
27% 16%
Any tablet 36% 26%
48. iPhone 54% 32%
Android 45% 54%
Windows 5% 6%
Blackberry 2% 7%
Other 8% 8%
Tablet 43% 30%
Large 37% 21%
Small 9% 11%
iPhone 21%
Android 69%
Windows 17%
Blackberry 24%
Tablet 30%
Large 19%
Small 14%
iPhone 57%
Android 63%
Windows 14%
Blackberry 11%
Tablet 41%
Large 34%
Small 18%
iPhone 47%
Android 40%
Windows 7%
Blackberry 4%
Tablet 37%
Large 30%
Small 12%
49
Source: Affluent Connection, Millward Brown, 2013
Base: all affluent consumers (3,000)
…BUT VARIES BY COUNTRY
SWEDE
N
INDIA
GERMAN
Y
HONG KONG
AUSTRALIA
iPhone 46%
Android 40%
Windows 5%
Blackberry 7%
Other 5%
Tablet 35%
Large 23%
Small 16%
UNITED STATES
49. 50
MOBILE DRIVES BRAND
AWARENESS AND POSITIVE
PERSUASION
Source: AdIndex for Mobile Norms through Q4/2012; Overall Mobile N=114,
campaigns, Sample = 436,016
Change = Exposed-Control
Average change in metrics per mobile campaign among all respondents globally
45.1
50.8
17.8
59.6
20.5
48.9
53.9
26.3
61.4
32.7
Purchase Intent
Brand Favourability
Message Association
Aided Brand Awareness
Ad Awareness
Expose
d
TOTAL POPULATION MOBILE
+59.5
%
+7.9%
+47.7
%
+6.1%
+8.4%
51. %
52
TWICE THE POWER
FOR AFFLUENTS
Source: MarketNorms for Desktop, last 3 years, N=941 campaigns
AdIndex for Mobile Norms;, last 3 years, N=114, campaigns,
Change = Exposed-Control
Average brand metric changes for mobile and online campaigns
21.4
57.2
17.6
46.7
42.7
31.9
59.8
23.3
48.3
44.7
Exposed
Control
Aided Brand
Awareness
Brand
Favourability
Purchase
Intent
+4.7%
+71.4%
+63.8%
Ad
Awareness
Message
Association
+12.5%
+16.8%
38.4
22.4
43.2
66.2
17.4
28.4
63.2
37.5
38.4
32.1
+49.0
%
+4.7%
+32.9%
+3.4%
+4.7%
52. 37.0
46.1
14.2
78.6
29.1
38.0
47.6
16.5
80.5
32.8
Exposed
Control
%
53
FOUR TIMES THE
POWER OF
DESKTOP
Source: MarketNorms for Desktop, last 3 years, N=941 campaigns
AdIndex for Mobile Norms;, last 3 years, N=114, campaigns,
Change = Exposed-Control
Average brand metric changes for top 20% mobile vs. Top 20% online income earners
Aided Brand
Awareness
Brand
Favourability
Purchase
Intent
+4.7%
+71.4%
+63.8%
Ad
Awareness
Message
Association
+12.5%
+16.8%
38.4
22.4
43.2
66.2
17.4
28.4
63.2
37.5
38.4
32.1
+12.7
%
+2.4%
+15.5%
+3.3%
+2.4%
Editor's Notes
The drive behind this research was the belief that the advertising industry understands mobile consumption, including mobile advertising, fairly well. But that the mobile behaviour of affluent consumers globally may differ from that of the general population.
Millward Brown’s award winning research – AdReaction – released last year contained some powerful insights into consumers’ mobile behaviour but did not look deeper into demographic differences.
Fieldwork: conducted online: 20th September – 14th October 2013
For this project we surveyed 6,000 smartphone owners aged 18+ – almost a third of whom also owned a tablet. Obtained 1,000 sample from each country – selecting a diverse range of countries hoping for some interesting national differences but found a fairly uniform story globally.
BBC users fell out naturally within the sample. Over 1/3 of affluents use the BBC mobile news sites or news app at least once a month
And this top 20% are a third more likely (32%) to visit the BBC weekly compared to the bottom 80%.
Our audience – and those of our competitors like CNN – are measured on EMS, PAX and Mendelsohn which cover approximately the most affluent 20% of consumers in each country. We achieved a 50/50 split in all 6 countries between affluent consumers and the rest of the population (less affluent 80%).
BBC users fell out naturally within the sample. Over 1/3 of affluents use the BBC mobile news sites or news app at least once a month
And this top 20% are a third more likely (32%) to visit the BBC weekly compared to the bottom 80%.
Earnings of Affluent sample:
Germany €36,000+
HK HK$40,000+
Sweden SEK480,000+
Australia A$90,000+
USA $70,000+
India R600,000+
Millward Brown
IAB Award for AdReaction, 2013 Research.
Over 400 mobile research studies and their global study of mobile advertising
In addition to analysing differences by income we also looked at the type of handset owned to determine what effect this has on owners’ mobile habits and attitudes to advertising on their handset. Predictably, with the cost, the latest handsets were most likely to be owned by affluent consumers (29%) vs 20% of the rest of the population. iPhone 5s twice as prevalent among affluents while iPhone 3s twice as likely to be owned by general population.
In terms of definition: Latest generation – post Sept 2013; Older generation pre October 2011 e.g. iPhone 4s/5 vs iPhone 3
Latest – iPhone 5, Blackberry Z10, HTC One, Nokia Lumia 925, Samsung Galaxy S4, Sony Xperia Z
Older – Apple iPhone 3, Samsung Galaxy Y, ZTE Blade
Large – iPad, Google Nexus 10, Samsung Galaxy Note 10, Microsoft Surface
Small – iPad Mini, Kindle Fire, Google Nexus 7
Q3: What type(s) of mobile devices do you currently use? By mobile phone we mean a device which you make calls and/or texts on. By tablet, we mean your mobile device which typically uses touch screen and requires WiFi to connect to the internet.
(1)Blackberry
(2)iPhone
(3) Windows Phone
(4)Android phone
(5) Symbian
(6)Other Smart Phone
(7) Simple Phone with no internet connection(e.g. not smartphone) -CLOSE
(8) Small tablet (eg: Kindle Fire, iPad mini, Nexus 7 etc)
(9)Large tablet (eg: iPad, Windows 8, Nexus 10, Galaxy note 10)
2011 e.g. iPhone 4s/5 vs iPhone 3
Affluent consumers are very heavy users of their mobile devices (phones and tablets) – more so even than the general population. 39% of affluents are online via mobile devices at least once an hour in a typical day. Not surprisingly, those who own the latest generation of handsets are online the most. It is mutually reinforcing: those who want to use their phones a lot for the internet will buy the latest handsets while those with these handsets will use them more to go online anyway as it is a better experience than was possible only a few years ago.
Q 6 Which of the following best describes how frequently you access the Internet (excluding apps) from your mobile devices?
Several times an hour or more often
Hourly
Several times a day
Daily
A few times per week
Less than once per week
Never
Q7 Which of the following best describes how frequently you access apps from your mobile devices?
Several times an hour or more often
Hourly
Several times a day
Daily
A few times per week
Less than once per week
Never
The key difference between affluent consumers and the rest of the population is the mobile phone’s role in their business lives. Affluents are 27% more likely to use their phone for business and 36% more likely to agree that it is the primary tool for organising their work lives. Clearly mobile phones are growing in importance in the business environment...
Q 17 Do you use your mobile devices for business?
Yes I use my mobile phone for business
Yes I use my tablet for business
No
Q31 mobile statements:
An increasing amount of my work is accomplished through my mobile phone
My mobile phone is my primary tool for organizing my work life
...in fact, most of their time on the phone is for work for almost half of affluent consumers – and over half in the APAC region.
Q17. Do you use your mobile device for business?
Q18a. On a typical week day what percentage of your total usage of your mobile phone is work-related?
Q18b On a typical week day what percentage of your total usage of your tablet is work-related?
Nearly half of affluents spend 50% or more of their time on their mobile phones for business – the APAC region is particularly significant
Business usage is very much restricted to mobile phones – only 10% of affluents use their tablets in this role. The phone is, compared with the tablet, indispensible, making users more efficient and helping organise their personal as well as professional lives. It plays such an important role in managing the lives of affluent consumers that it is unsurprising that they are more likely to own the latest handsets.
Q31 mobile statements:
My mobile phone is indispensable because I’m always on the go
Having a mobile phone makes me more efficient
My mobile phone is my primary tool for organizing my personal life
While mobile phones are increasingly important in the business lives of affluent consumers the other major mobile device – tablets – are very much a leisure tool. Around a quarter spend over 5 hours per week playing games and watching entertainment videos and nearly a third social networking.
Q20 In a typical week how many hours do you spend...
Going online on a laptop or desktop visiting websites while at work, home, or other locations
SOCIAL: Using a mobile phone to read or send texts and e-mails
SOCIAL: Using a mobile phone for social networking e.g. Facebook, Twitter or Instagram
BUSINESS NEWS: Using a mobile phone for business/finance news
NEWS: Using a mobile phone for news , e.g. current affairs or breaking news
NEWS: Using a mobile phone for sports news
ENTERTAINMENT: Watching an entertainment video on a mobile phone
ENTERTAINMENT: Playing games on a mobile phone
To sum up this introduction to mobile usage we can see the level of agreement with 4 statements about mobile usage which clearly show the key trends. So across the six countries – and there was relatively little variation – mobile phones are more important to the lives of affluent consumers than the rest of the population, and ownership of the latest handsets tends to raise their role even higher.
Q31 mobile statements:
My mobile phone is indispensable because I’m always on the go
Having a mobile phone makes me more efficient
My mobile phone is my primary tool for organizing my personal life
My mobile phone is my primary tool for organizing my work life
Have a few findings around news consumption – one of the major uses of mobiles today.
Q22 Thinking about how you use your mobile device compared to a pc or laptop; which of the following activities do you prefer using your mobile device for rather than a computer?
To read or send e-mails
For social networking e.g. Facebook, Twitter or Instagram
For business/finance news
For news, e.g. current affairs or breaking news
For sports news
Watching an entertainment video
Playing games
None of the above
Q15 If you could only use one of these devices to consume news which would it be? 2012 2013Laptop/PC 38% 31%Mobile phone 13% 15%Tablet 11% 12%
Question only asked among top 20% in India, Australia, USA and Germany as these countries were common to both countries.
Another area that is changing rapidly is the way that news is consumed on mobile phones. Traditionally news on the mobile has been restricted to scanning headlines – reading the actual articles of interest when they were indoors and had access to a desktop PC. That appears to be changing quickly – consumers are becoming far more engaged with news on the go now.
Q14 How would you describe the way you consume news on each device?
2012 2013
Just read /watch the top stories 31% 32%
Skim or scan the headlines 37% 32%
Read/watch in depth 13% 16%
Question only asked among top 20% in India, Australia, USA and Germany as these countries were common to both countries.
When questioned about what types of news respondents preferred to consume on mobile rather than desktop, affluent consumers were relatively more likely to prefer all genres on mobile compared with the rest of the population. Most answers were neutral – people showed no preference – but there is a clear movement towards mobile news consumption by affluents with fewer preferring desktop. That preference was even more pronounced among those with the newer handsets.
Q22. Thinking about how you use your mobile device compared to a pc or laptop; which of the following activities do you prefer using your mobile device for rather than a computer?
To read or send e-mails
For social networking e.g. Facebook, Twitter or Instagram
For business/finance news
For news, e.g. current affairs or breaking news
For sports news
Watching an entertainment video
Playing games
None of the above
There was a similar story when we looked at how news was consumed on mobile. Whether it is headline skimming, article reading and the digging deeper by reading stories connected to the article they have just read, all forms of news consumption on mobiles were noticeably higher among affluents - for who news is more of a priority.
But the newer handsets are also impacting on how news is consumed by simply enabling the process to be easier and of a higher quality...
Q21. You said you use your mobile phone for news-related content. Which of these do you do when browsing news-related content?
Use news apps
Browse news headlines
Read news articles
Read articles connected to the main article
Watch news videos
Watch live news streaming
Comment on news articles
Share news stories on social media sites
Affluents are more likely to use news apps than the rest of the population: put simply, news apps are the most used type of app for affluents whereas social networking are the most used apps for the general population. Travel, business and finance apps also tend to be more frequently accessed by affluents.
Prefer apps to browser: Affluents 40% Gen pop 34% (+18%)
Q27/28 Of the different types of apps installed on your mobile phone/tablet, how often do you use them?
Gaming
News
Social Networking
Travel
Finance
Business
Lifestyle (Hobbies/Personal Interest)
Other
More than 4 times a day
1-3 times a day
At least once a day
A few times a week
Once a week
A few times a month
Less than once a month
Never
I do not have this type of app on my mobile phone
Q29. You said you have a news app installed on your mobile device. Which method of accessing the news do you prefer?
Via app
Via web browser like Google or Safari
No preference
(Programmer note: radio button; static)
To get an idea of how quickly the news consumption landscape is changing we repeated some of the questions from last year’s Connecting The Story project and compared the results from the most affluent 20% of the population. Over 12 months the proportion who would choose desktop if they only had one device to consumer news fell 17%, in contrast there were significant increases in the proportion who would choose mobile devices: tablets up 9% and mobile phones 15%.
2012 2013Laptop/PC 38% 31%Mobile phone 13% 15%Tablet 11% 12%
Question only asked among top 20% in India, Australia, USA and Germany as these countries were common to both countries.
...for example, watching video on your mobile or live news screening is only practical on handsets that have come onto the market in the last few years, hence the growth of this type of news consumption a mongthose with newer handsets. About a third watch news video on their phones and a quarter live news streaming.
Q21 You said you use your mobile phone for news-related content. Which of these do you do when browsing news-related content?
Use news apps
Browse news headlines
Read news articles
Read articles connected to the main article
Watch news videos
Watch live news streaming
Comment on news articles
Share news stories on social media sites
Tablet ownership doesn’t affect the likelihood to consume news on mobile phones. The chart compares news consumption throughout the day on mobiles for tablets owners compared with non-tablet owners – effectively there is no difference.
Q. For each device you have access to, please tell me, for a typical 24-hour period, when you would use it to access the news or consume the news during the week?
So we have seen how mobile phones occupy a more central role or affluent consumers than for the rest of the population, especially within the news environment. Now we have some findings relating to their attitudes towards advertising on their mobile handsets.
Fundamentally, affluent consumers tend to be more positive about mobile advertising: partly due to better handsets (ads don’t slow the screen loading as they might on an older phone) so that they feel more positively about brands advertising on their handsets than most of the population. Modern & dynamic is quite obvious for a relatively new advertising medium but it is the same across a range of attributes...
Q40 to what extent do you agree with the below statements:
To be seen as modern and dynamic a brand needs to be on mobile
To be seen as modern and dynamic a brand needs to be on mobile - Affluents: 31% Gen pop 27% ie. +15%
Innovative similarly you would expect association with mobile advertisers but more interesting for an advertiser is that almost a third of affluent consumers associate brands advertising on mobile as “for someone like me” and “in touch with my needs”. The personal nature of mobiles can transfer to brands advertising on them.
Q38 Please select how much you agree or disagree with the below statements
Trustworthy
Appealing
In touch with my needs
For someone like me
High quality
Desirable
Innovative
Reputable
Q40 statements:
Mobile advertising helps you connect and identify more strongly with brands
Brands should be advertising on mobile devices
Some of the most innovative advertising I have seen recently is on mobile
To be seen as modern and dynamic a brand needs to be on mobile
My mobile/tablet is my main way of staying up to date with my favourite brands
I identify most with brands that I see when using my mobile device
I prefer mobile ads that help me find out more about the brand rather than purchasing
To be seen as modern and dynamic a brand needs to be on mobile - Affluents: 31% Gen pop 27%
Mobile Ad Statements: Innovative (Smartphone): Affluents: 28%
For someone like me (Smartphone): Affluents: 10%; Gen pop 8%
Mobile ad trustworthy: Affluents: 23%
BBC Trustworthy: Affluents: 31%
Modern & dynamic
20% 80% 20%BBC Dev’d Dev’ing
31 27 50 21 45
Another reason for affluents to be more positive about mobile advertising – in addition to better handsets – is a recognition of the quid pro quo relationship between advertising and free content. 41% agree with the rest more likely to be neutral than disagree.
Geo-targeting was slightly less welcome but even here affluents were more positive than negative (38% positive vs 31% disasgree) and again were more positive than the rest of the population.
Q.31 When thinking of your mobile phone, please indicate how strongly you agree or disagree with the following statements
Mobile phone Statements: I am willing to see ads on mobile websites as long as the websites are free to access (Smartphone):
Mobile phone Statements: I am willing to share my location to get more relevant services and offers on my mobile phone:
Top 20: 39%; Bottom 80: 33%
There has been a lot of hesitancy among clients to adopt mobile advertising – understandable when you consider the quality of delivery on earlier handsets. But attitudes among affluent consumers at least are changing. While most remain unconvinced or opposed to advertising mobile advertising at least is as accepted now as ‘traditional’ desktop advertising – and is ahead of some other digital advertising: only 16% were positive about ads when listening to music players like Pandora or Spotify for example.
Q32. And how would you characterize your attitude towards each of the following types of advertising
72% = desktop/laptop
So affluent consumers are relatively positive about mobile advertising but to what extent is that converted into results. To what extent can mobile advertising drive brand perceptions, push consumers towards purchase?
Overall affluent consumers were more positive towards the 5 tested formats. Pre-roll was seen as the most favourable format for both the affluent and general population
Q.44 Overall, how favourable was your experience with the above advertising?
Very favourable
Somewhat favourable
Neutral
Somewhat unfavourable
Not at all favourable
Standard banners are the least impactful mobile format. Consumers may have trained their eyes to view below the masthead (Millward Brown AdReaction)
Handset age not likely to be a driver of differences.
Newer phones Older phones
Not at all favourable/somewhat 16% 18%
Neutral 48% 45%
Very/somewhat favourable 36% 37%
Importantly the affluent consumers’ more positive reaction to mobile advertising does lead to action.
Compared to the general population there are more likely to follow or comment on a brand on social media having seen mobile advertising. As well as recommend a brand to friends or family and crucially they are more likely to look for the advertised brand in store or purchase the product.
Q48 After viewing the ad, how likely are you to: Like, follow or comment about the brand on Facebook or Twitter
Like, follow or comment about the brand on Facebook or Twitter – affluents 20% Gen pop 18%
Affluent consumers do take action after seeing mobile advertising. They are just as likely to react to advertising on mobile as they are on tablet.
Q35 More specifically, in the past 4 weeks, which of the following actions have you taken as a result of seeing one of the below formats of advertising?
Net of:
Clicked on or interacted with the ad
Searched for the brand on the Internet
Looked for the brand in a store or purchased the product/used the service
Visited the brand’s website
Recommended the brand to friends/family
Like, follow or comment about the brand on Facebook or Twitter
It is time for advertisers to recognise that mobiles play an increasingly central role in affluent consumers’ media consumption. Affluents spend more and more of their time using their phones, especially to enhance their effectiveness in the work environment.
Advertising on mobile represents an opportunity to reach affluent consumers when they are genuinely engaged on a device that is important to them. Affluents recognise that advertising enables them to enjoy the benefits of the connected world and this makes them more positive than the general population towards mobile advertising. This attitude, coupled with the advances in handset technology which mean that ads load quickly without slowing up the user experience, have made affluent consumers more responsive to mobile advertising. Millward Brown’s work in this area, based on numerous case studies and 100,000s of respondents, shows overwhelmingly that mobile is working even harder for advertisers than the long-proven desktop medium, especially among affluent consumers...
OK so there is a very compelling story for advertisers to use mobile to reach and engage with consumers, especially affluent ones. But we also have some additional data on BBC mobile users as MB included standard media usage questions on the survey.
BBC users were included naturally within the sample. In fact over 1/3 of affluents use the BBC mobile news sites or news app at least once a month: the most affluent top 20% are a third more likely (32%) to visit the BBC weekly than the rest of the population.
We have used this slide before but now with BBC users added.
The fact that even BBC users within the general population tend to be more active users of mobile even than the overall affluent population shows how when it comes to technology early adopting BBC users are globally. The data points for affluent users of the BBC are incredibly strong: almost two-thirds see their mobile as indispensible and the primary tool for organising their work lives.
BBC sample Gen pop = 300 and affluent 450.
Q31 mobile statements:
My mobile phone makes me feel more connected
My mobile phone is indispensable because I’m always on the go
Having a mobile phone makes me more efficient
An increasing amount of my work is accomplished through my mobile phone
My mobile phone is my primary tool for organizing my personal life
My mobile phone is my primary tool for organizing my work life
I find the mobile internet too slow
Now that I have my mobile phone, I don’t really need a computer
I’m willing to share my location to get more relevant services and offers on my mobile phone
I’m willing to see ads in my apps as long as the apps are free on my mobile phone
I’m willing to pay for an app as long as there are no ads in it on my mobile phone
I’m willing to see ads on mobile websites as long as the websites are free to access
I use my mobile device far less than I thought I would
Affluent BBC users (i.e. BBC users you would find on Mendelsohn, PAX or EMS) are 37% more likely use their mobile phone for work than other affluents and 70% more likely to agree that an increasing amount of their work is accomplished on it. Making BBC mobile a particularly effective means to reach audiences for B2B campaigns.
Q 6 Which of the following best describes how frequently you access the Internet (excluding apps) from your mobile devices?
Several times an hour or more often
Hourly
Several times a day
Daily
A few times per week
Less than once per week
Never
Q 17 Do you use your mobile devices for business?
Yes I use my mobile phone for business
Yes I use my tablet for business
No
Q31 mobile statements:
An increasing amount of my work is accomplished through my mobile phone
My mobile phone is my primary tool for organizing my work life
So we have already seen that affluents are relatively likely to prefer using mobile over desktop for news consumption. But even compared with other affluents BBC users show a strong preference for news consumption – half preferring mobile compared with 30% for other affluents.
BBC users particularly show a relative preference for sharing interesting news stories with others in their networks via mobile. They are twice as likely to prefer discussing news stories on online forums or blogs as other affluents.
Q22 Thinking about how you use your mobile device compared to a pc or laptop; which of the following activities do you prefer using your mobile device for rather than a computer?
To read or send e-mails
For social networking e.g. Facebook, Twitter or Instagram
For business/finance news
For news, e.g. current affairs or breaking news
For sports news
Watching an entertainment video
Playing games
None of the above
Of the different types of apps installed on your mobile phone, how often do you use them?
Gaming
News
Social Networking
Travel
Finance
Business
Lifestyle (Hobbies/Personal Interest)
Other
More than 4 times a day
1-3 times a day
At least once a day
A few times a week
Once a week
A few times a month
Less than once a month
Never
16. How much do you agree with the following statements?
I like to discuss interesting news stories with others in online chat forums / blogs
I often share interesting news stories on Facebook / Twitter
Reading about a news story in online chat forums / blogs helps me better understand what a story is about
I only share stories with friends from a source I trust
I only share news stories with friends once I have checked it on a professional news organisation
I am more likely to share stories on my phone/tablet rather than on my PC/laptop
News is clearly relatively more important to them. 43% watch news videos on their mobile (79% more likely than other affluents) and almost a third watch live news streaming (twice the affluent average). Video advertising on BBC if we had more?
Q21 You said you use your mobile phone for news-related content. Which of these do you do when browsing news-related content?
Use news apps
Browse news headlines
Read news articles
Read articles connected to the main article
Watch news videos
Watch live news streaming
Comment on news articles
Share news stories on social media sites
Finally, the BBC’s affluent users and mobile advertising. Just one slide as it is a simple story. Seen how they are much more likely to have newer handsets, are more reliant on that handset to organise their lives and compared with other affluents they are twice as likely to believe that brands should be advertising on mobile, that it makes these brands more appealing and builds a connection with them.
Q22 Thinking about how you use your mobile device compared to a pc or laptop; which of the following activities do you prefer using your mobile device for rather than a computer?
To read or send e-mails
For social networking e.g. Facebook, Twitter or Instagram
For business/finance news
For news, e.g. current affairs or breaking news
For sports news
Watching an entertainment video
Playing games
None of the above
Of the different types of apps installed on your mobile phone, how often do you use them?
Gaming
News
Social Networking
Travel
Finance
Business
Lifestyle (Hobbies/Personal Interest)
Other
More than 4 times a day
1-3 times a day
At least once a day
A few times a week
Once a week
A few times a month
Less than once a month
Never
16. How much do you agree with the following statements?
I like to discuss interesting news stories with others in online chat forums / blogs
I often share interesting news stories on Facebook / Twitter
Reading about a news story in online chat forums / blogs helps me better understand what a story is about
I only share stories with friends from a source I trust
I only share news stories with friends once I have checked it on a professional news organisation
I am more likely to share stories on my phone/tablet rather than on my PC/laptop