


![Jean Tirole – Nobel Winner in 2014
Nobel Prize for
Economics 2014
Is awarded to………….
Jean Tirole
• Important work on regulation and on competition policy
• Sometimes better to leave monopolies alone and allow them to work with
other firms
• Always a risk of government failure with intervention
• Sector-based analysis; price caps can work in some markets but not others
• Work also included reasons to end the bank bonus culture
• Won a prize of 8 million Kronor [£750, 000…]](https://image.slidesharecdn.com/monopolywebinar-150529100216-lva1-app6892/75/Basics-of-the-Economics-of-Monopoly-30-2048.jpg)


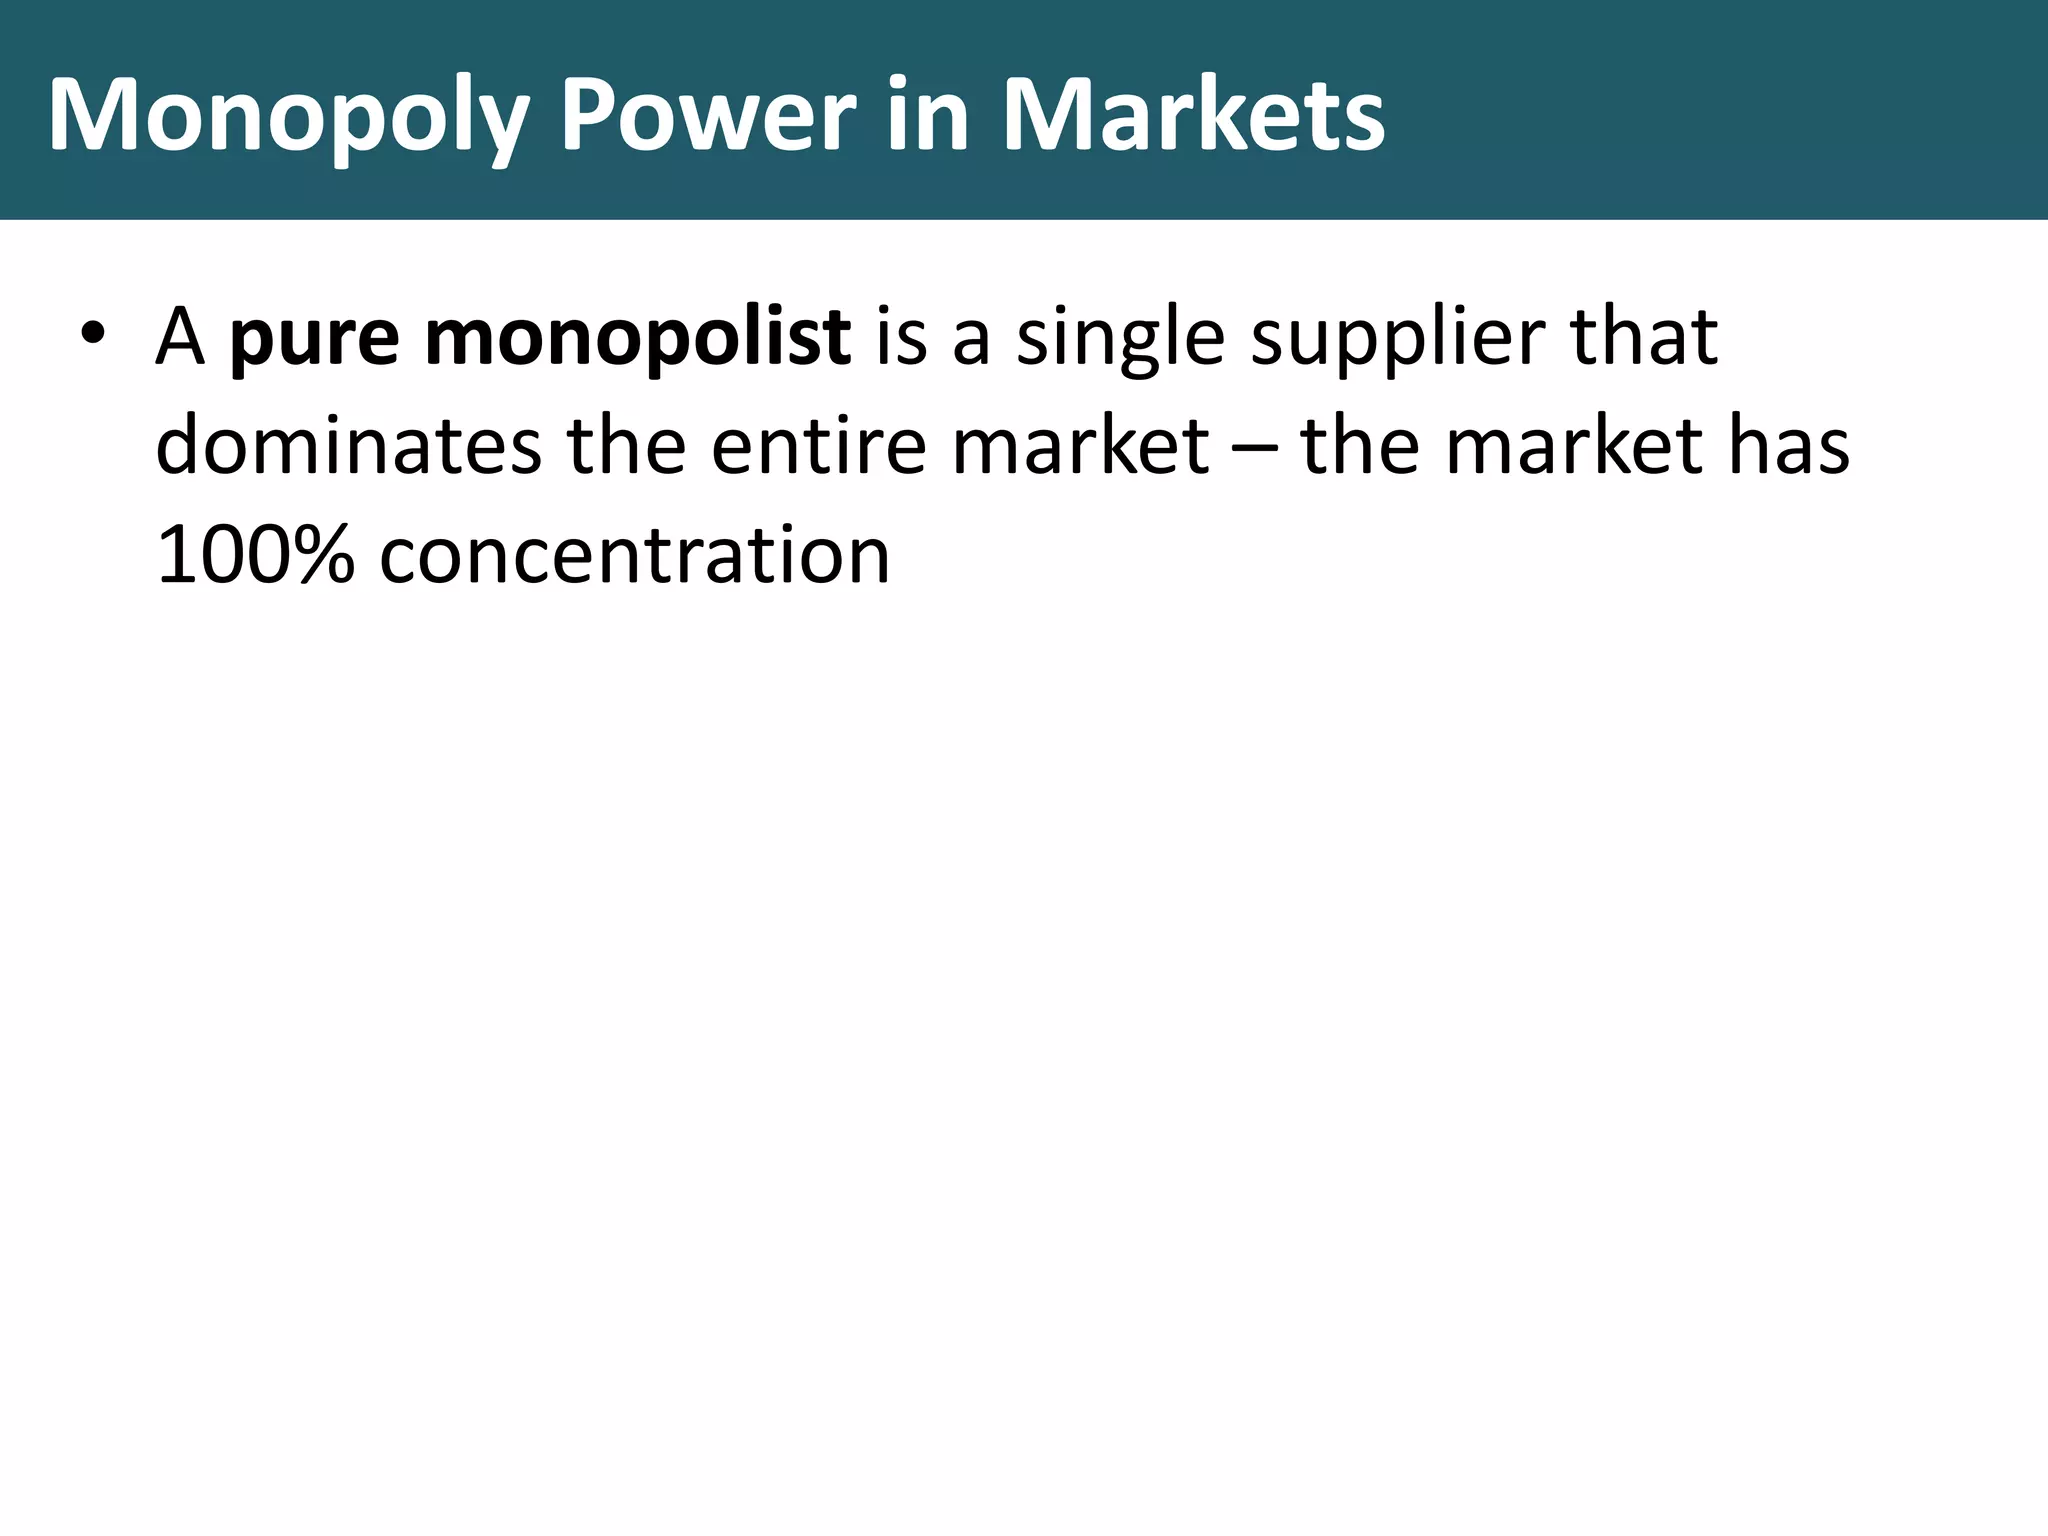
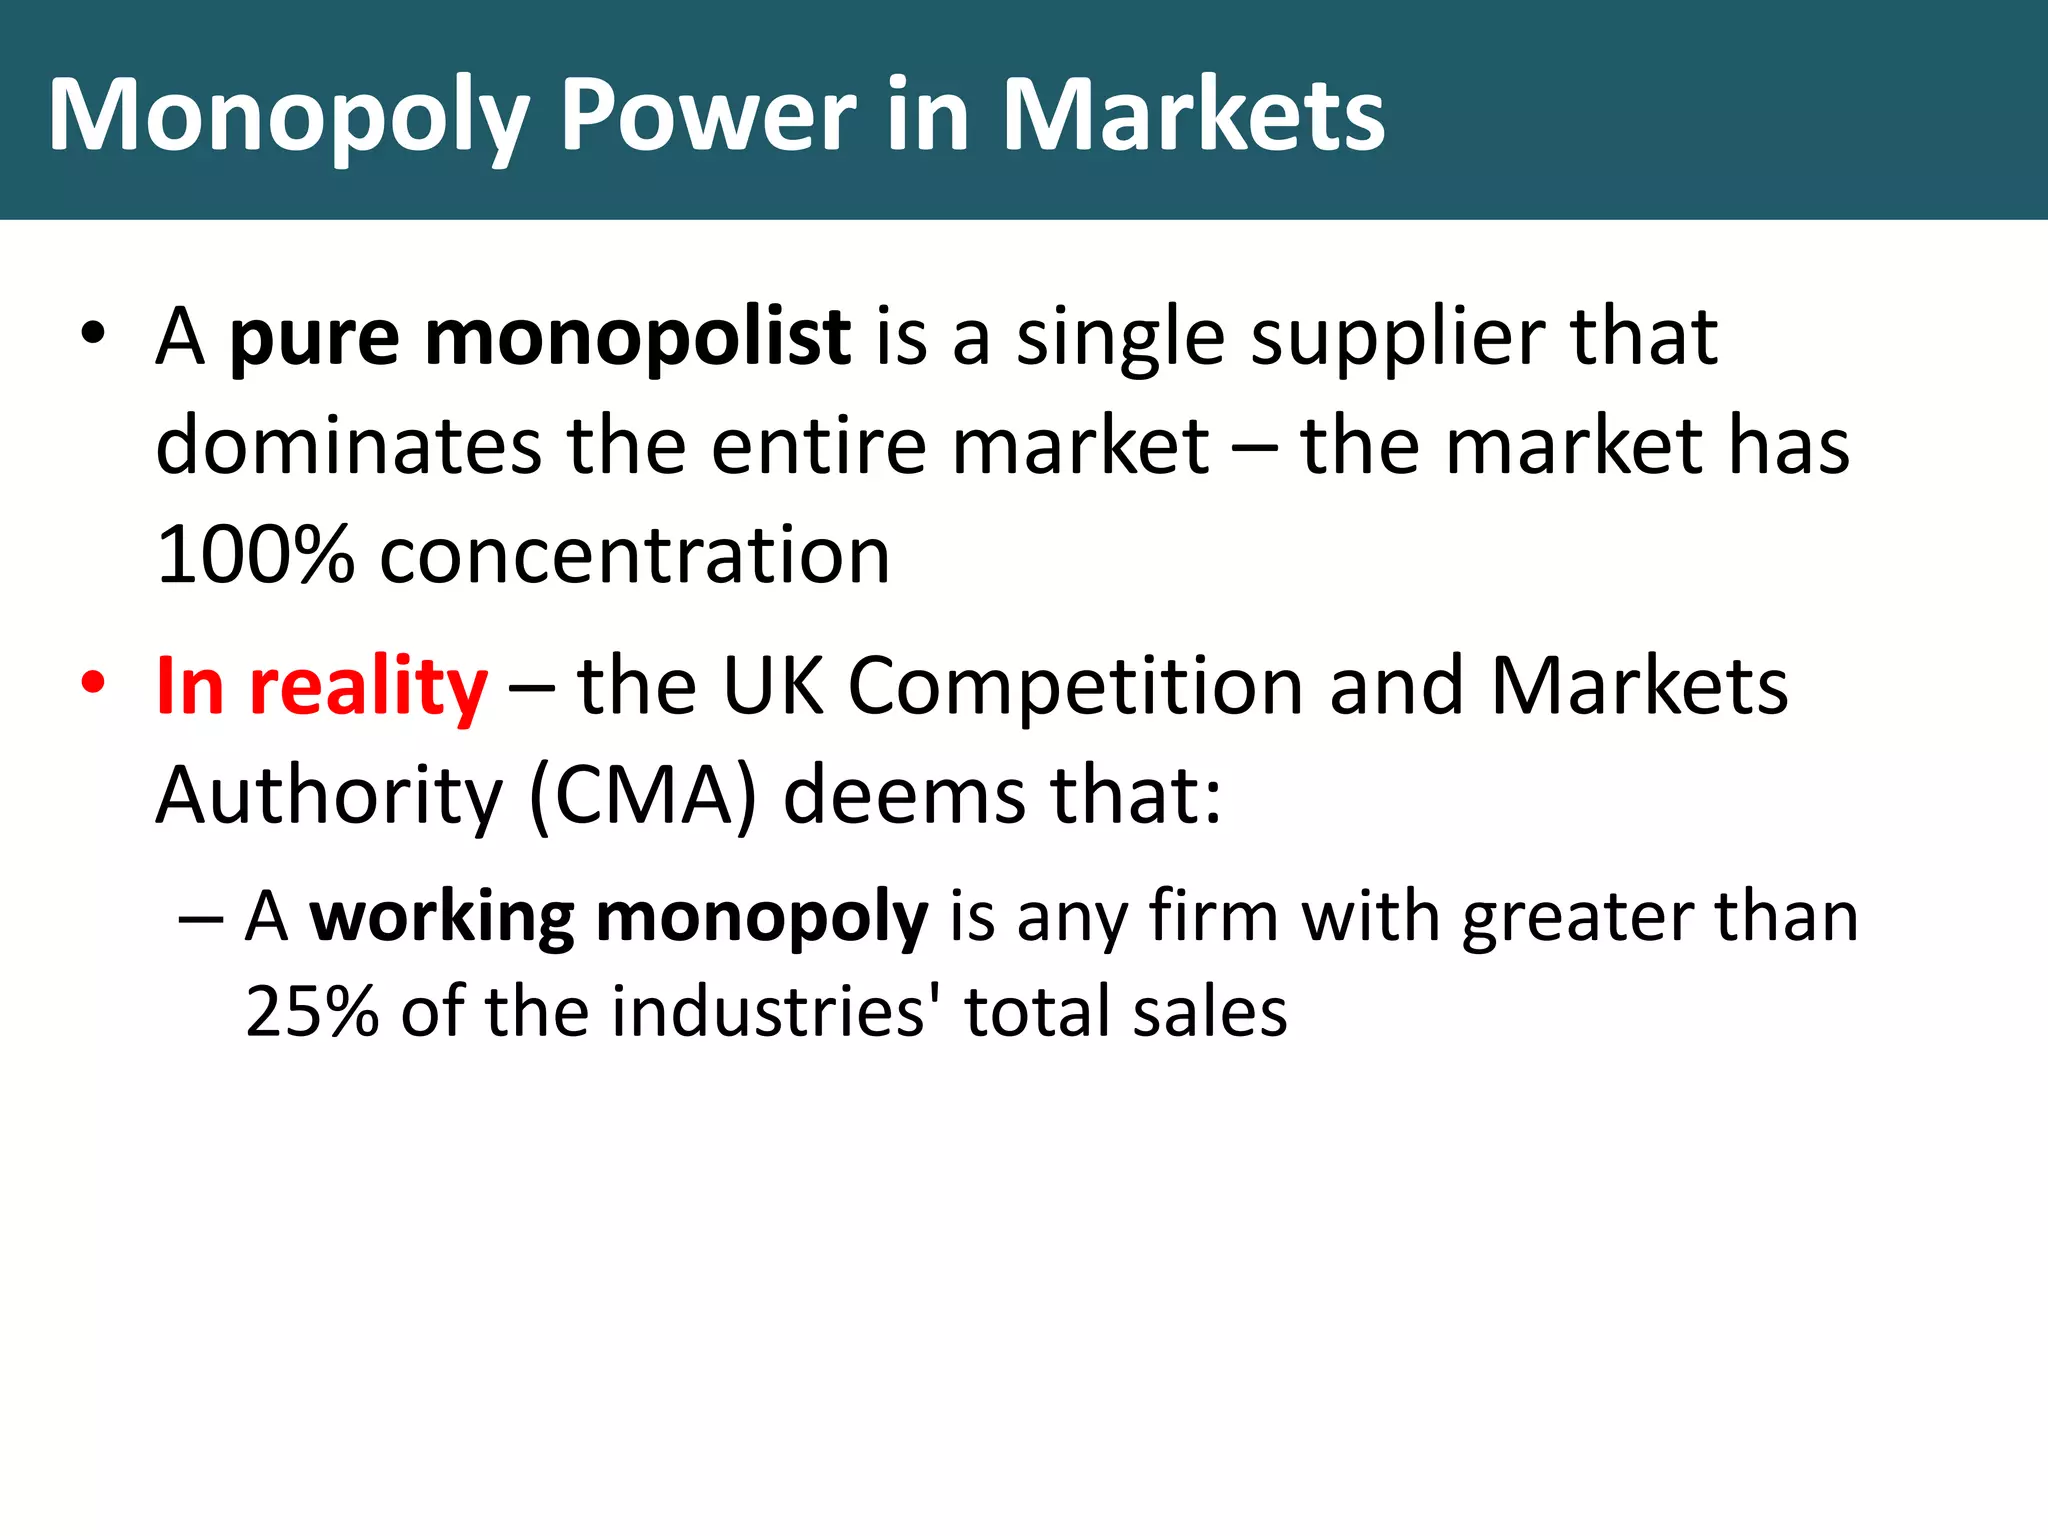
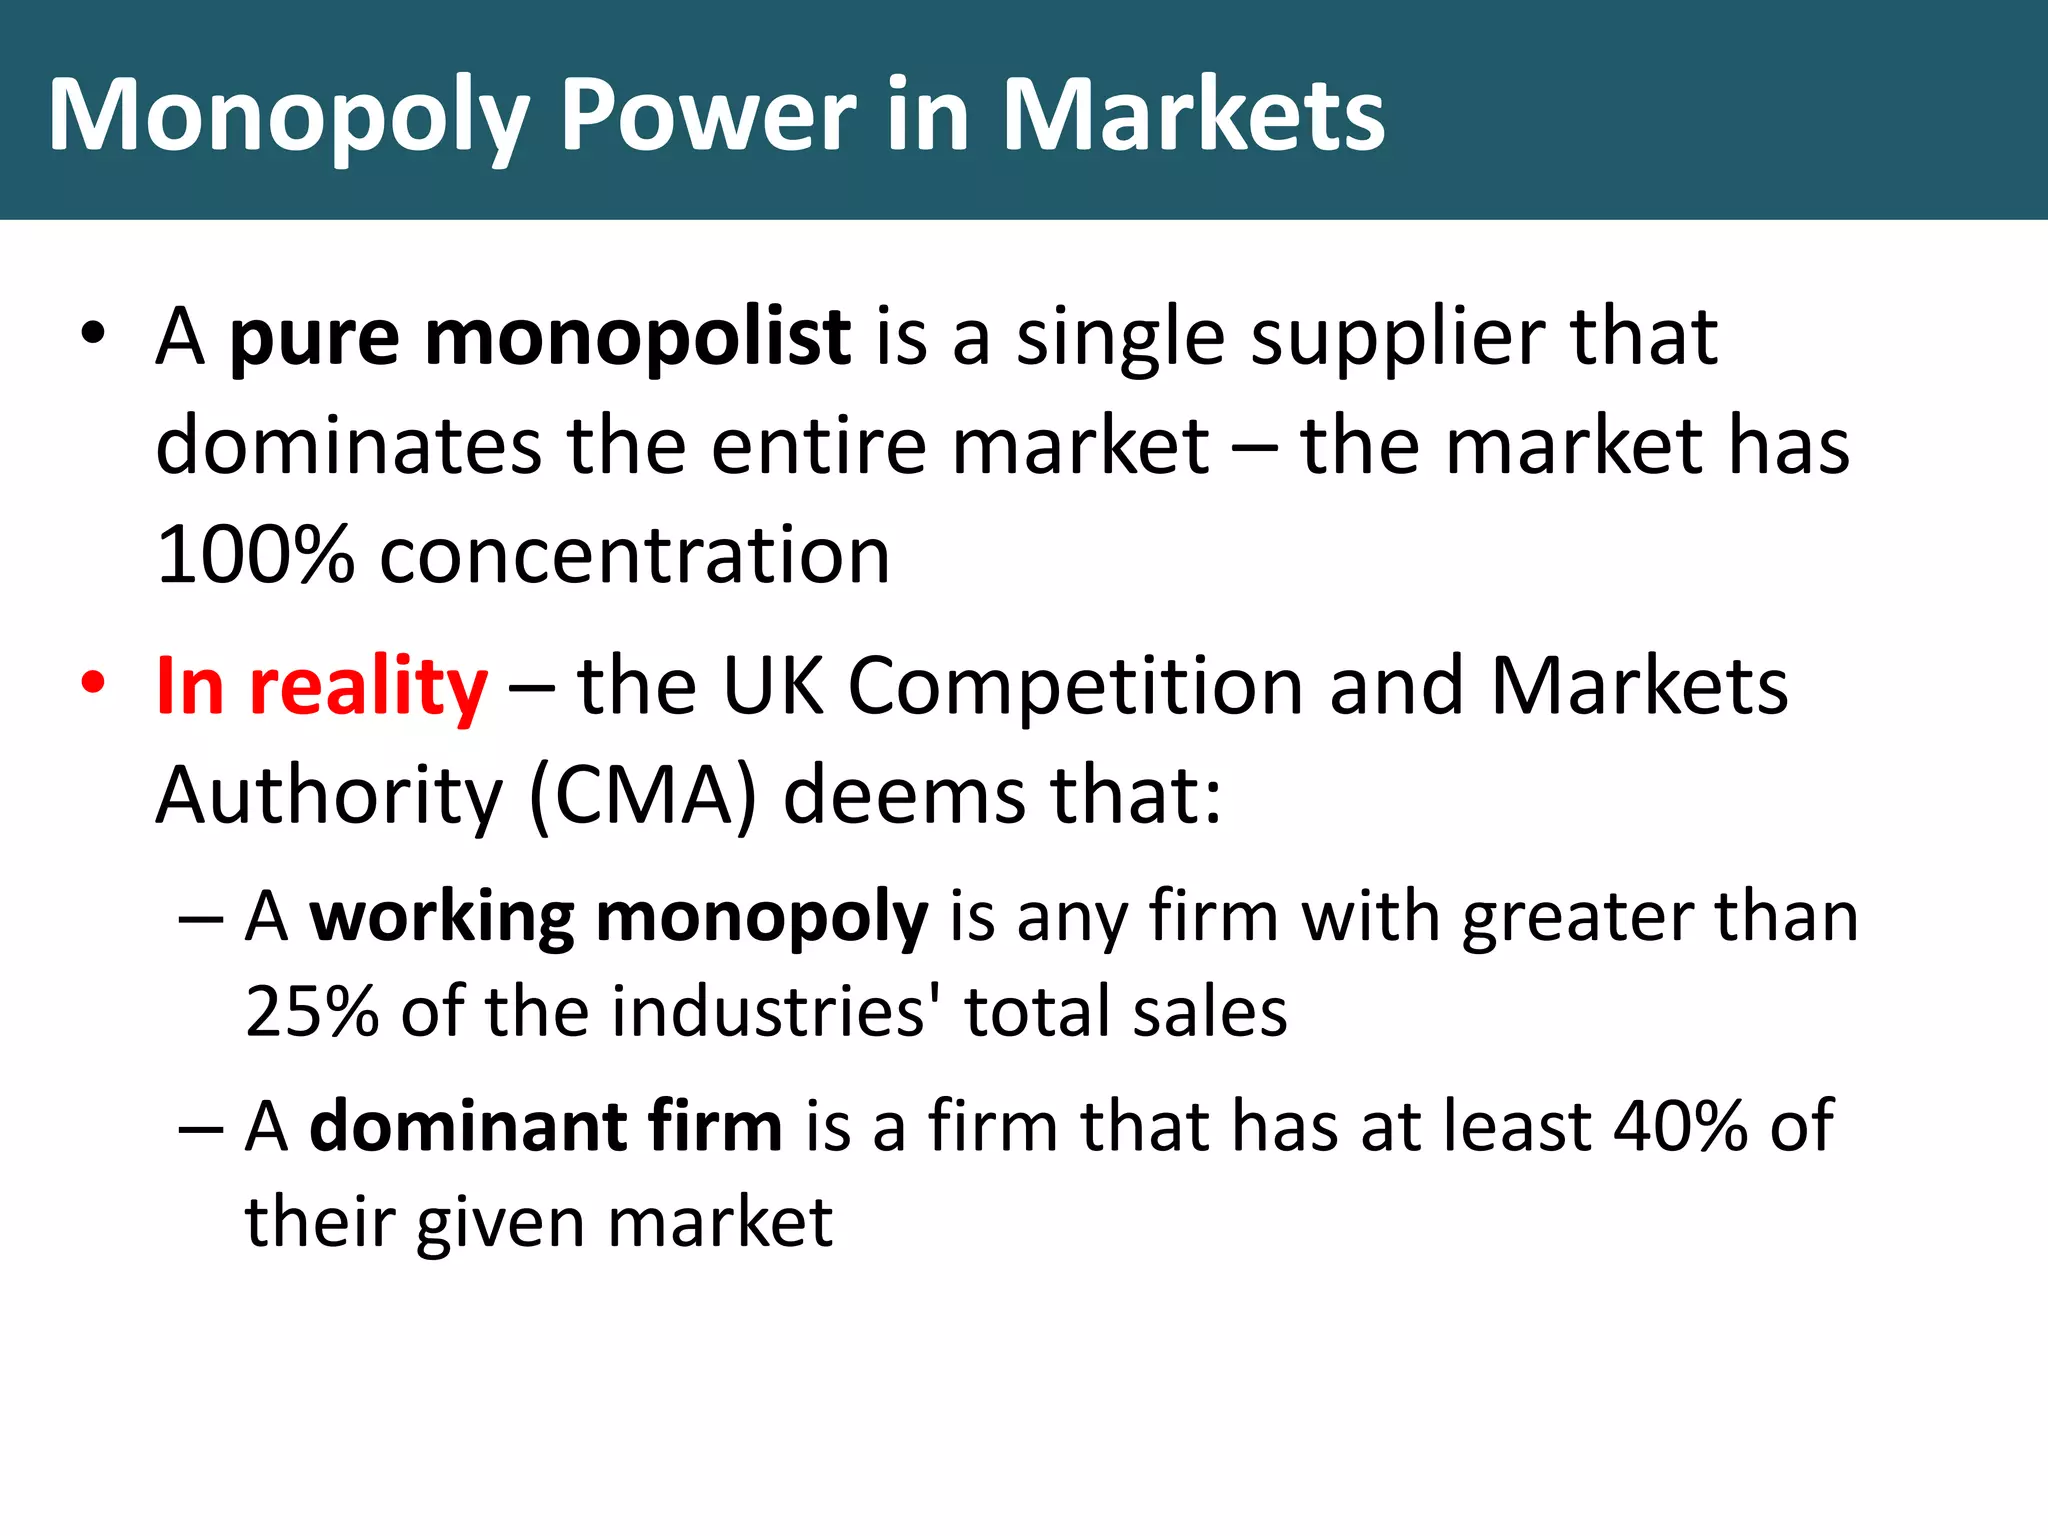
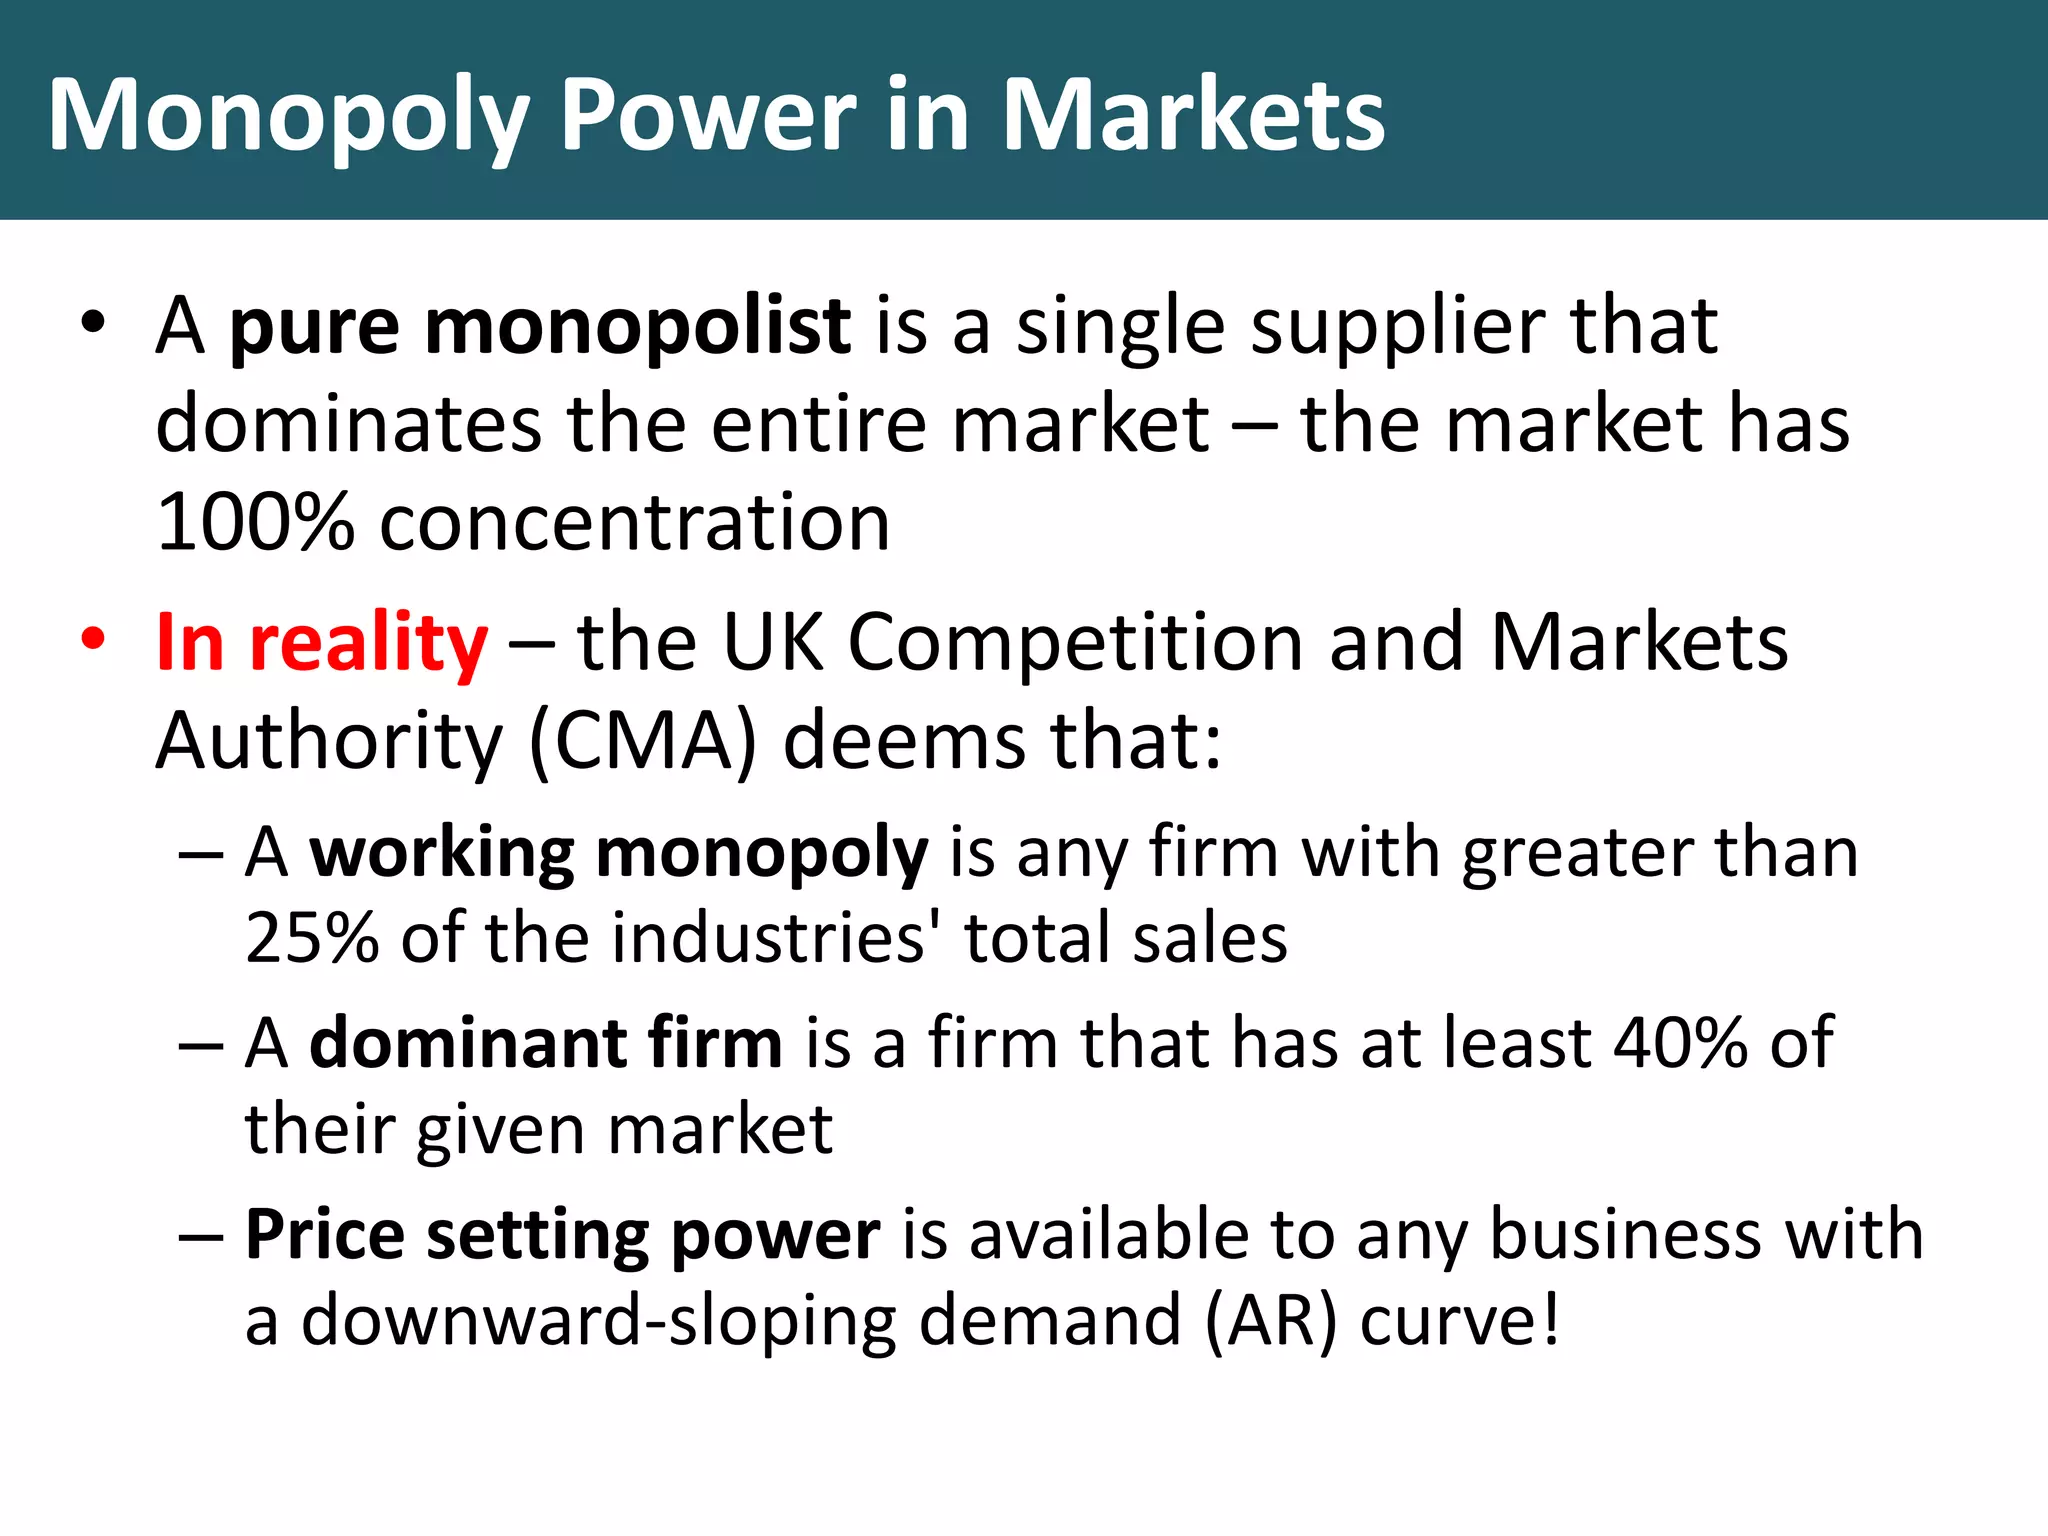
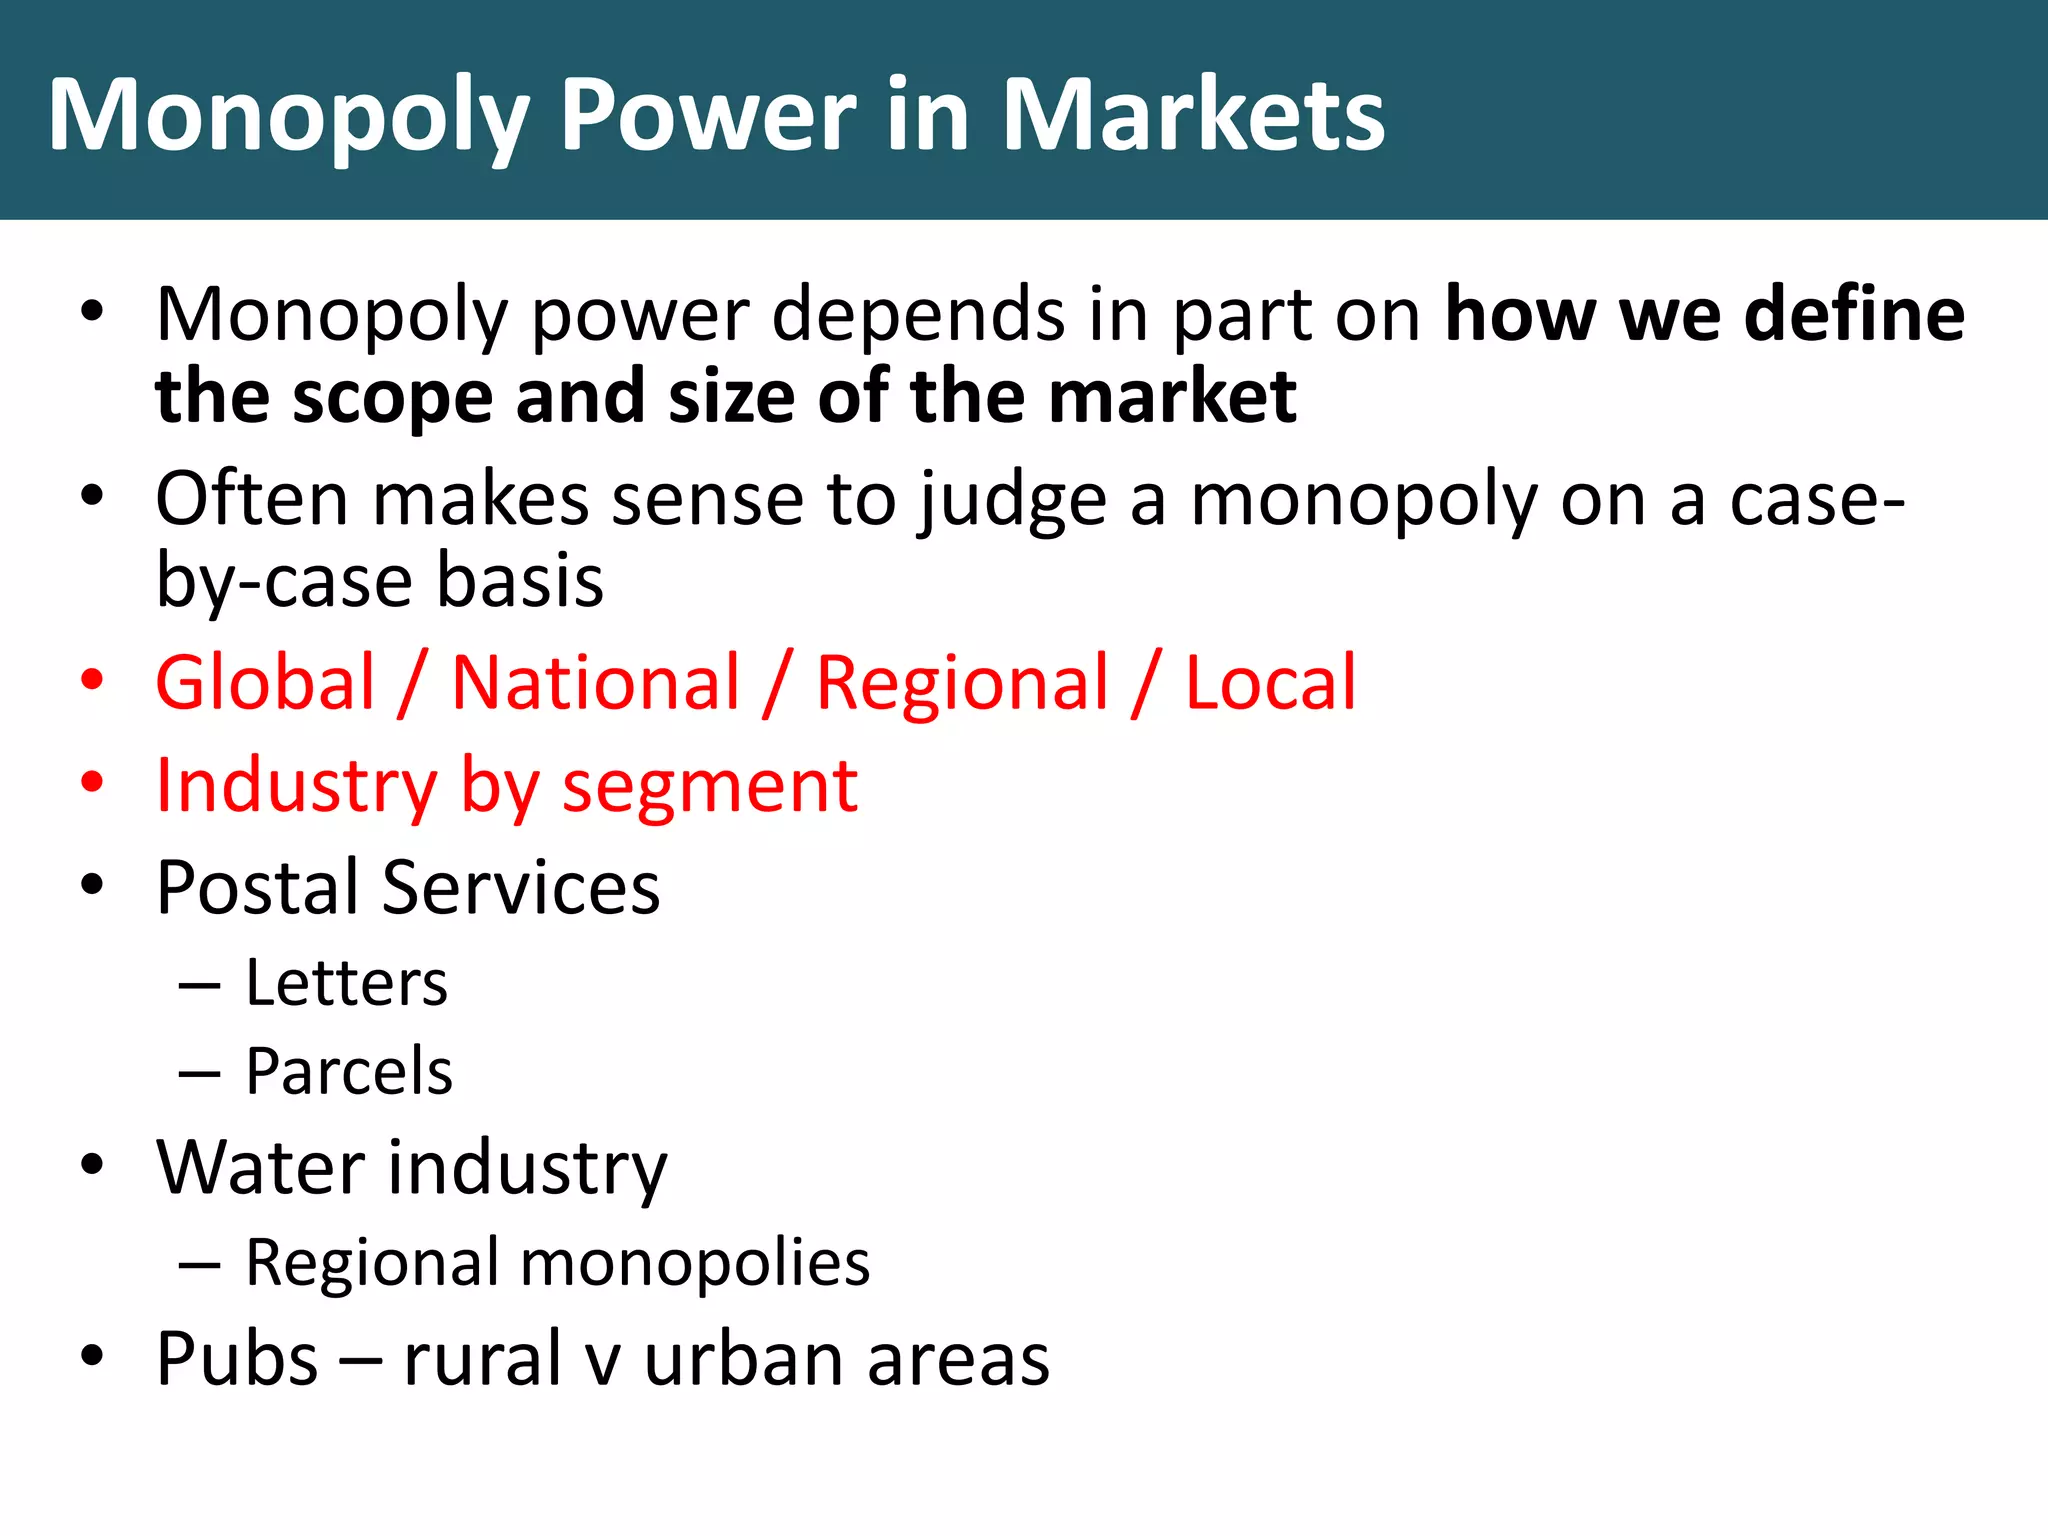
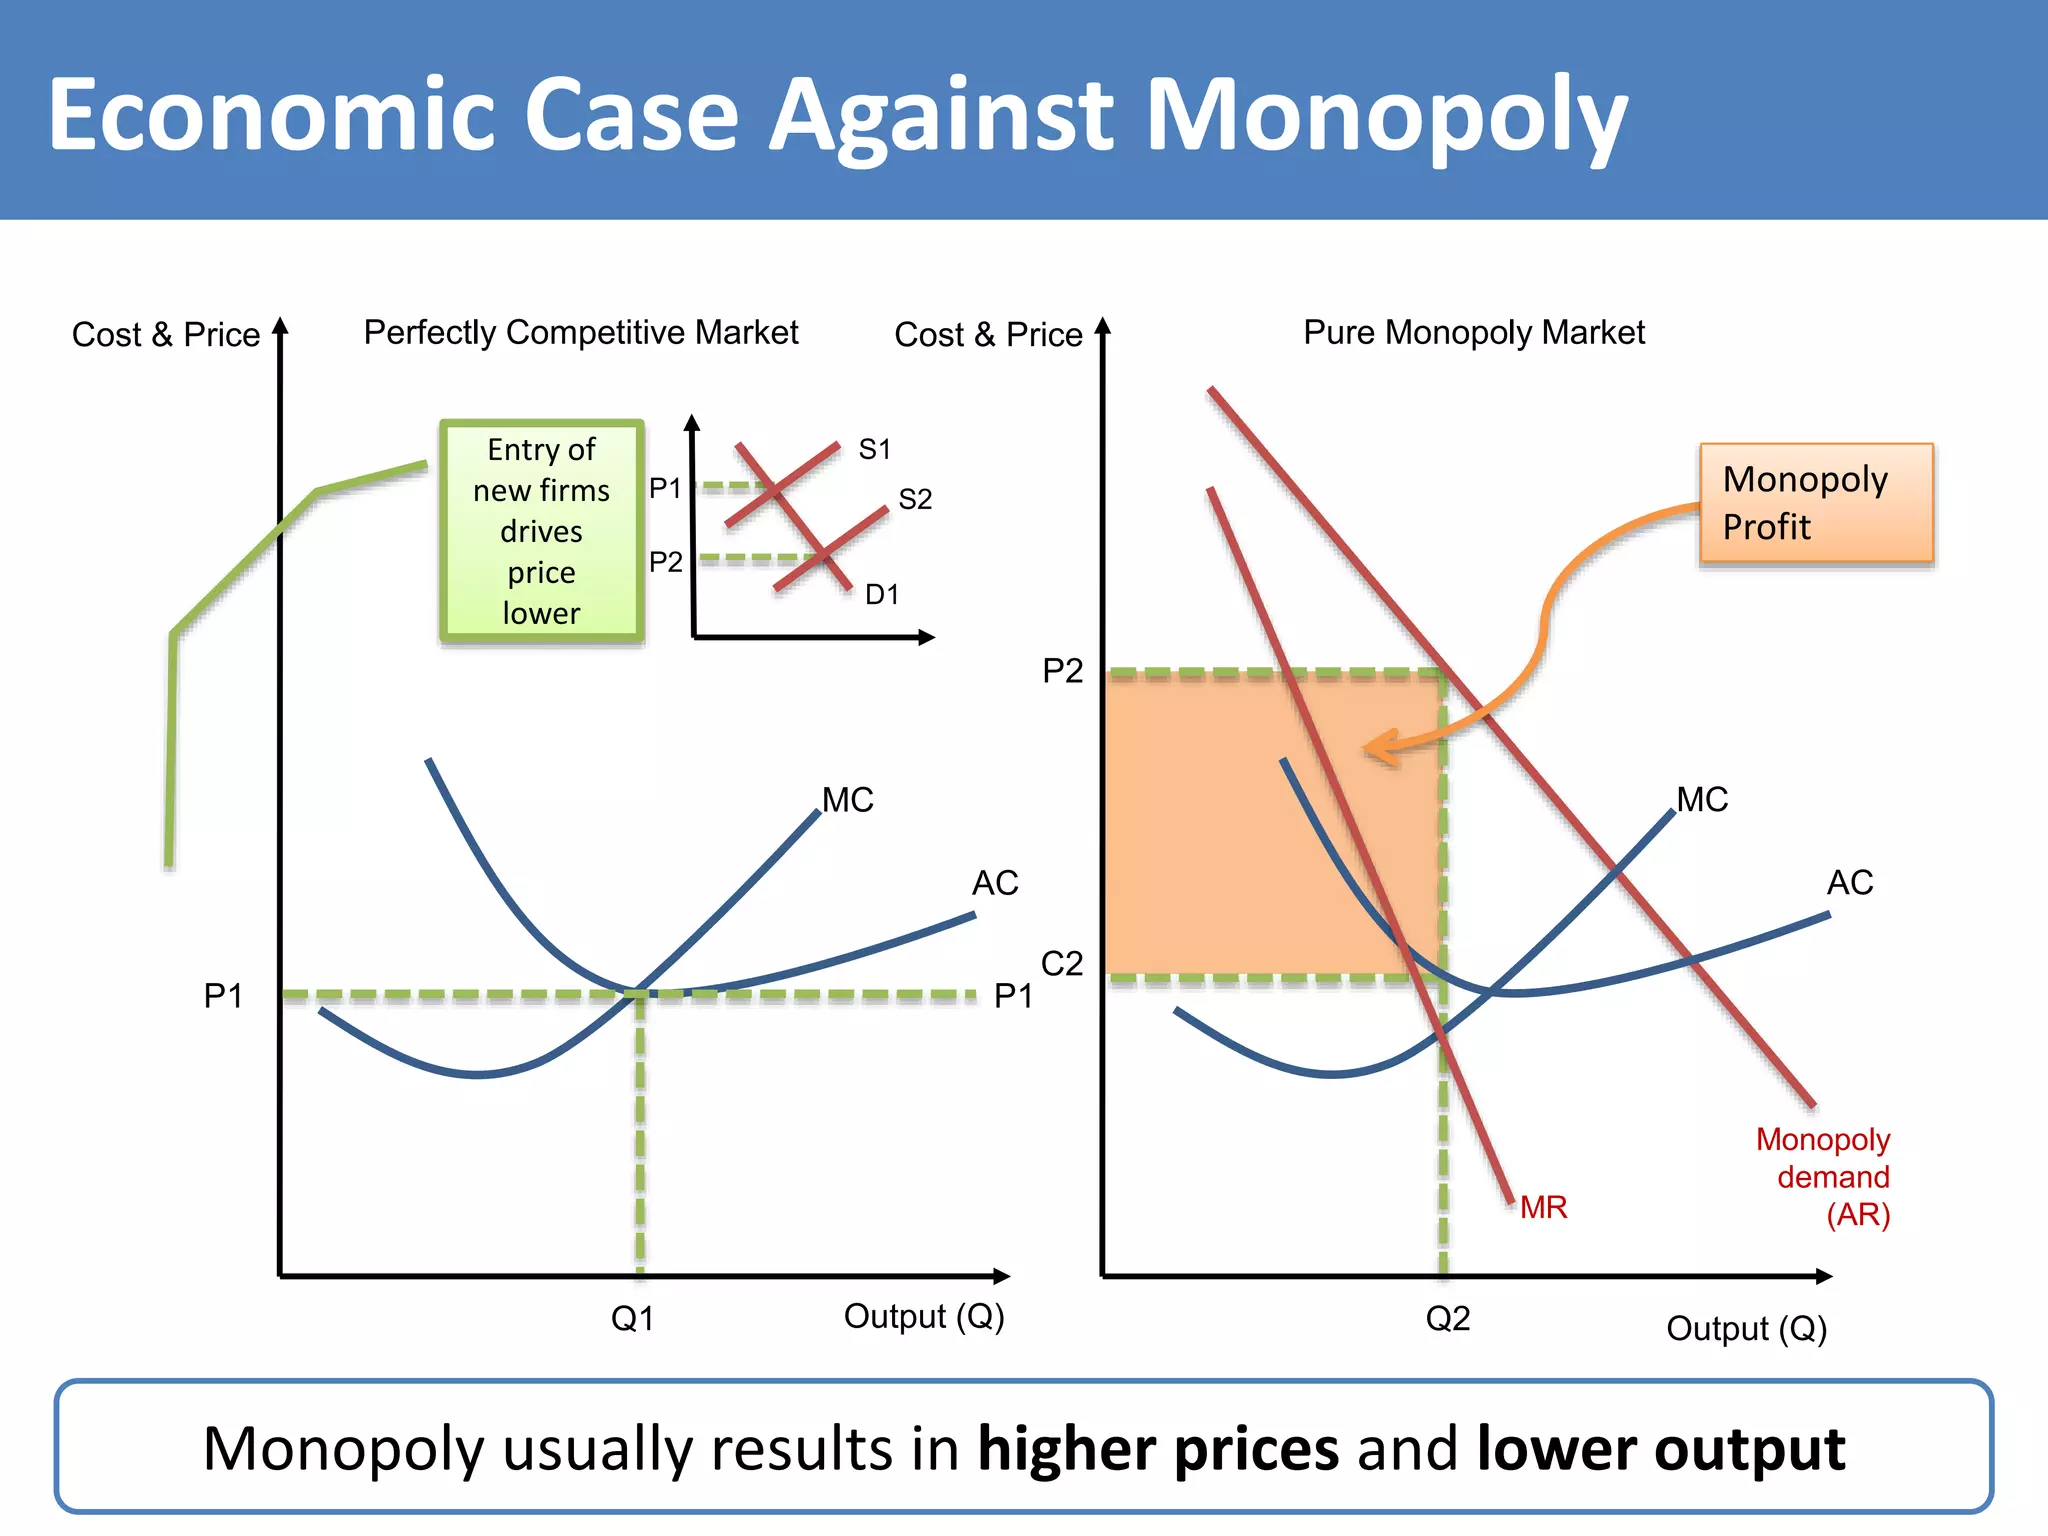
This document discusses monopoly power in markets. It defines a pure monopolist as a single supplier that dominates an entire market with 100% concentration. In reality, a working monopoly is deemed to be any firm with over 25% market share, while a dominant firm has at least 40% share. Monopolies can lead to higher prices and lower output compared to competitive markets. However, monopoly power also allows firms to invest profits into research and development. There are economic arguments both for and against monopolies, and intervention may or may not be effective depending on the specific market.


