This document provides a summary of the Airbus A320 design project conducted by students using the Merlin flight simulator. The project examined various design aspects of the A320 like mass, center of gravity, engines, fuselage, wings, tail, and more. Individual sections analyzed parameters such as fuel consumption, stability, materials, and how changes affected performance. The document presented findings from simulator experiments and evaluated the original A320 design and future developments. It also discussed ethical considerations in aircraft design and operations. Overall, the project aimed to further understanding of aircraft design and the capabilities of simulator-based research.
![[Document title]
[Document subtitle]
Michael
[Email address]
Abstract
[Draw your reader in with an engaging abstract. It is typically a short summary of the
document.
When you’re ready to add your content, just click here and start typing.]
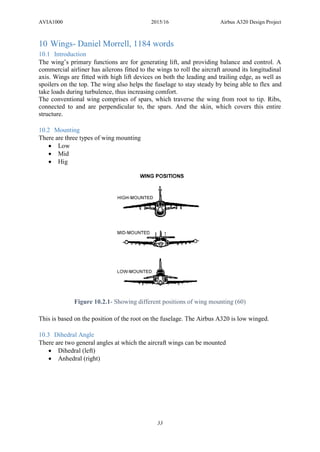
Daniel Morrell
Michael Newell
Joe Potter
Cheuk Man Sin
Sonam Yaqub
Project
Supervisor:
Mr Chris Brier
20/01/2016
9237 words
(5)](https://image.slidesharecdn.com/9f4610c3-8ea5-499e-a3c3-760a9243edd3-161011105753/85/AVIA1000-Group-Project-1-320.jpg)
![AVIA1000 2015/16 Airbus A320 Design Project
5
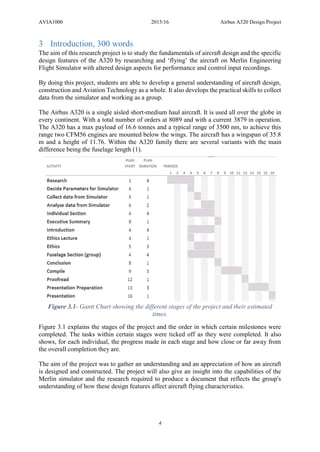
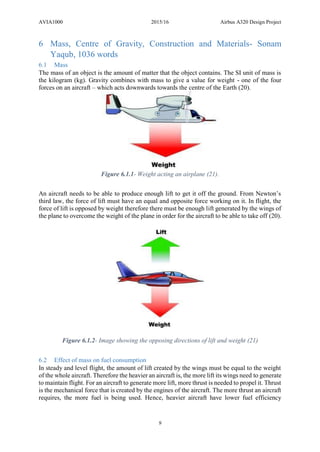
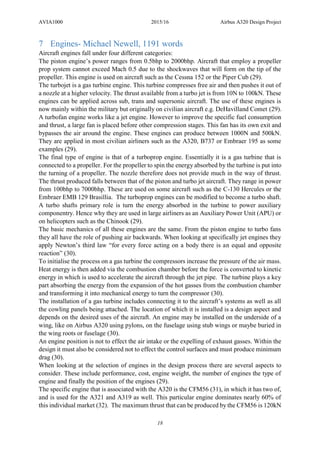
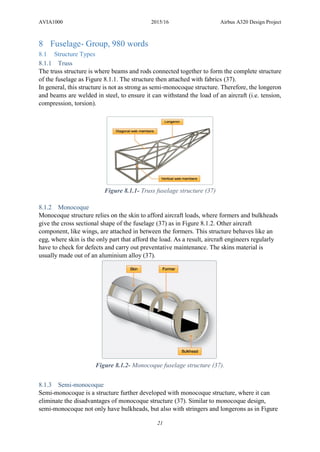
4 Overall Design of the Aircraft, 1063 words
In the late 1960s, Airbus’ competitor, Boeing, successfully dominated the market through the
development of 737. In order to gain entry into the narrow body market, Airbus abandoned the
original plan to develop the A300 further, working with other European aircraft manufacturers
to develop the origin of A320 instead (2).
The Joint European Transport (JET) developed JET2, a former name of the A320, then sent it
off to Airbus for further development. Airbus then started the Single Aisle Study, which
developed various seating configurations: SA1, SA2 and SA3, later to become official variants
of the A320 (2).
Airbus hadn’t initially decided whether the A320 should be a twinjet or quad jet. However, one
of their largest customers, Lufthansa, mentioned that they were more interested in twinjet. As
a result, Airbus decided to fit the A320 with 2 engines (2).
Airbus then further developed SA2, they officially named the aircraft to A320 in 1981.
Coordinated with Delta Airlines, they developed the A320 with a maximum of 180 seats,
changing the length of fuselage as well. However, when deciding the cross-sectional area of
the fuselage, Airbus looked to its competitors such as the Boeing 737 for a similar size.
Although this reduced the fuel efficiency compared with Boeing 737, Airbus compensated by
using a thinner and longer wing, such that to increase the aspect ratio and better fuel efficiency
(2).
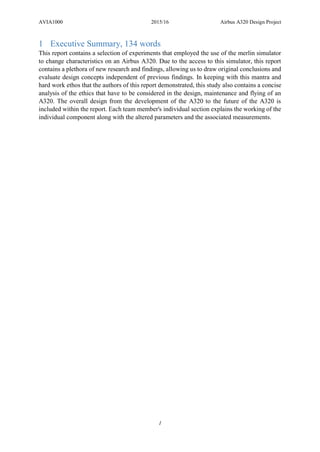
5 years into the service of the A320, Airbus rolled out the A321, a stretched version. It has all
the same dimensions as the A320, save a longer fuselage (7m longer). It has identical engines
and fuel capacity, so therefore has a shorter range than the A320 by about 1000nm (at 2600nm)
(3). It can hold up to 220 passengers (4). In 1995, just 2 years after the A321 entered service,
Airbus rolled out the A319, a similar concept to the A321 but with a fuselage 4m shorter than
the A320 (3), giving it a maximum capacity of 153 (4). Due to its [obvious] smaller mass, it
has a greater range than the A320 (4600 vs. 3600nm) (3), although is usually used for shorter
flights. Airbus further shrank the A319 fuselage by 2.39m in 2003 to create the final variant,
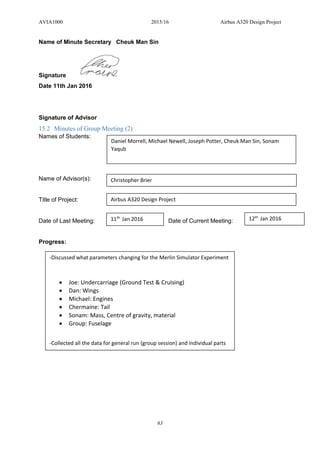
the A318 (3), this can haul to 132 passengers (4) 3100nm (3). The scale in sizing can be seen
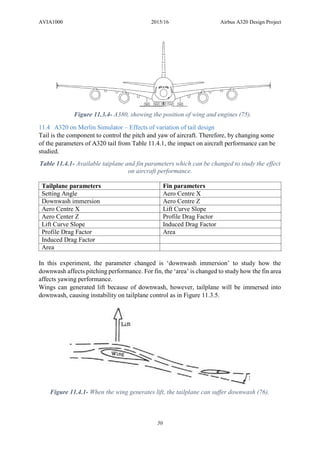
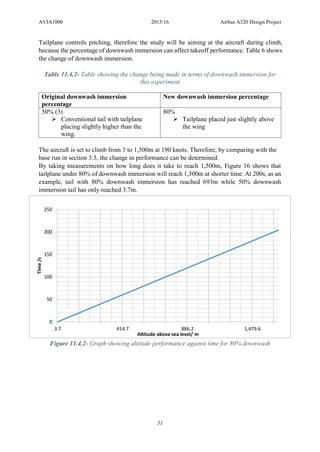
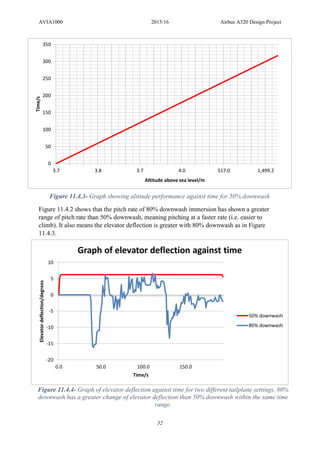
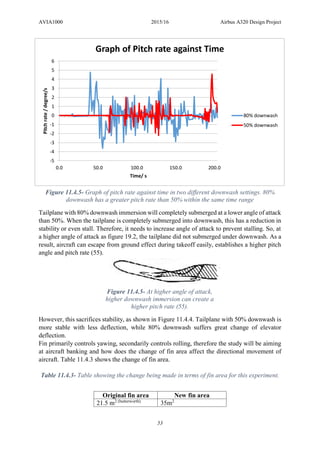
below in Figure 4.1.
Figure 4.1- Image showing size differences in variants (5).](https://image.slidesharecdn.com/9f4610c3-8ea5-499e-a3c3-760a9243edd3-161011105753/85/AVIA1000-Group-Project-6-320.jpg)
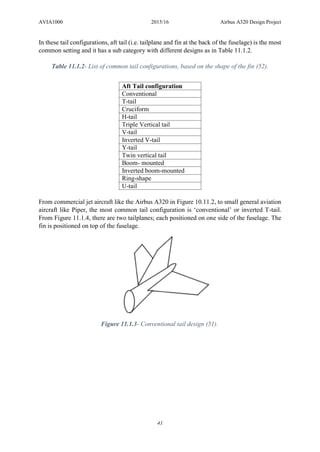
![AVIA1000 2015/16 Airbus A320 Design Project
43
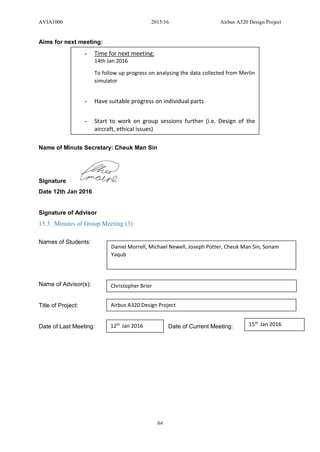
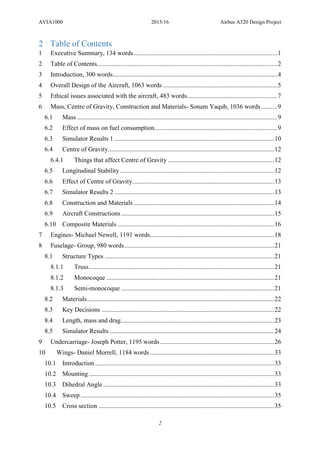
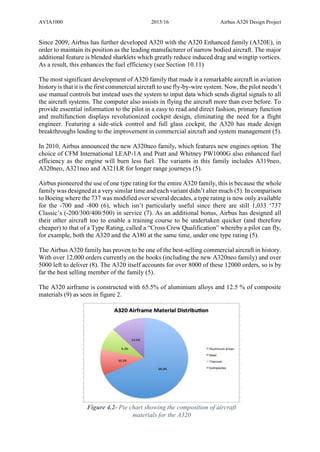
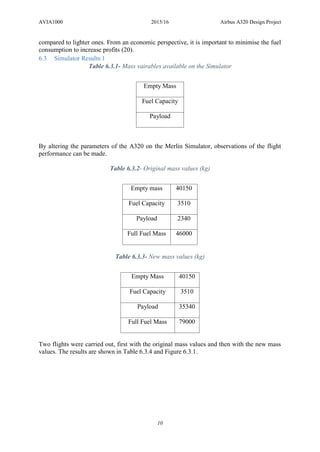
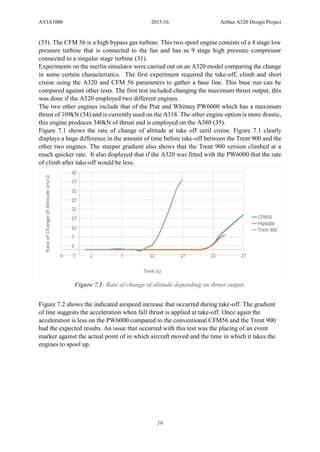
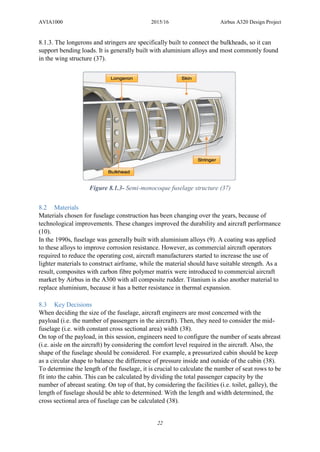
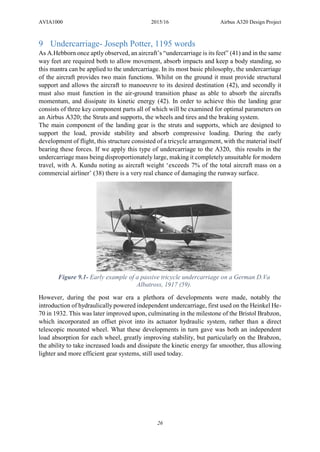
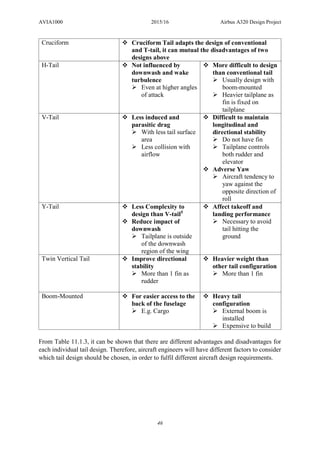
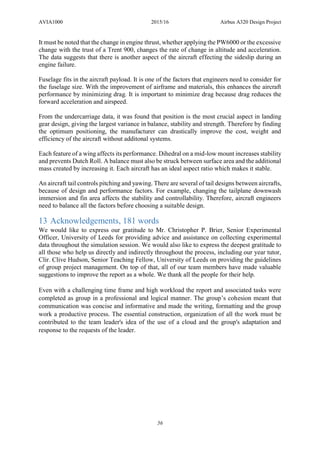
V-tail has two taiplanes coming out of the fuselage in a dihedral V-shape. It does not have a
fin. The tailplanes (i.e. ‘ruddervator’) in this design controls both the elevator and rudder. An
example is Beechcraft Bonanza as in Figure 11.1.11.
Y-tail is in Figure 11.1.12, similar to V-tail, has tailplanes attached as a V-shape, while a fin is
attached to the bottom of the fuselage. An example is Ikhana as Figure 11.1.13.
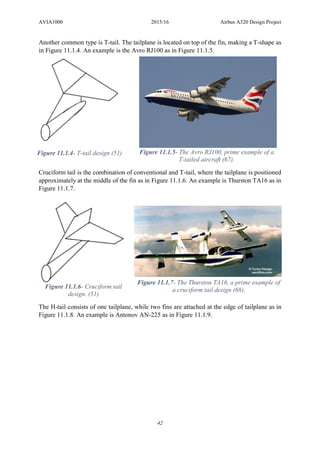
Figure 11.1.8- H-tail design (51) Figure 11.1.9- The Antonov AN-225, whilst
being the longest and heaviest aircraft in the
world, boasts a H-tail too (69).
Figure 11.1.10- V-tail design (51). Figure 11.1.11- The Beechcraft Bonanza, an
example of a V-tailed aircraft (Air Facts
Journal. Beechcraft Bonanza. [Online].
2015. [Accessed on: 17 Dec 2015] Available
from: http://airfactsjournal.com/](https://image.slidesharecdn.com/9f4610c3-8ea5-499e-a3c3-760a9243edd3-161011105753/85/AVIA1000-Group-Project-44-320.jpg)
![AVIA1000 2015/16 Airbus A320 Design Project
57
14 References
1. Airbus S.A.S. A320 Range. [Online] 2015. [Cited: 16 January 2016.]
http://www.airbus.com/aircraftfamilies/passengeraircraft/a320family/a320/performance/.
2. Flight Global. Airbus A320 Aircraft Profile. [Online] 2015. [Cited: 19 January 2016.]
http://www.flightglobal.com.
3. Lloyd Jenkinson, Paul Simpkin, Darren Rhodes. Civil Jet Aircraft Design. Oxford :
Butterworth-Heinemann, 2001.
4. Airbus S.A.S. Airbus Family Figures. [Online] July 2015. [Cited: 16 January 2016.]
http://www.airbus.com/fileadmin/media_gallery/files/brochures_publications/aircraft_familie
s/Airbus-Family-figures-booklet-Jul15.pdf.
5. —. Airbus A320 Family. [Online] 2016. [Cited: 19 January 2016.]
http://www.airbus.com/aircraftfamilies/passengeraircraft/a320family/.
6. Boeing Commercial Airplanes. Flight Training Type Rating Course. [Online] 2015.
[Cited: 15 January 2016.]
http://www.boeing.com/resources/boeingdotcom/commercial/boeing-
edge/assets/brochure/edge-flight-services/fs-typerating.pdf.
7. Flightglobal Insight. World Airliner Census. [Online] 2015. [Cited: 16 January 2016.]
https://d1fmezig7cekam.cloudfront.net/VPP/Global/Flight/Airline%20Business/AB%20home
/Edit/WorldAirlinerCensus2015.pdf.
8. Airbus S.A.S. Orders & Deliveries. [Online] 2015. [Cited: 16 January 2016.]
http://www.airbus.com/company/market/orders-deliveries/ .
9. P Moreira, L Silva, P Castro. Structural Connections for Lightweight Metallic
Structures. Portugal : Springer Science & Business Media, 2012.
10. R Beo, J Starnes, R Holzwarth. Low-Cost Composite Materials and Structures for
Aircraft Applications. United States : Air Combat Systems, 2001.
11. Eurocontrol. Eurocontrol Aircraft Performance Database. [Online] 2008. [Cited: 11
January 2016.]
https://contentzone.eurocontrol.int/aircraftperformance/details.aspx?ICAO=A320&.
12. Aerospace Facts. Airbus A320 Facts. [Online] 2013. [Cited: 14 January 2016.]
http://www.aerospacefacts.com/plane/aircraft.php?plane_id=111.
13. Reese, NS. A measure of decision making ethics within aviation and aerospace industry.
Oklahoma State University : s.n., 2015.
14. Flight Safety Foundation. Airbus A320 Database. [Online] 2016. [Cited: 15 January
2016.] http://www.aviation-safety.net.
15. —. Lufthansa Flight 2904 Accident Description. [Online] 2016. [Cited: 15 January 2016.]
http://www.aviation-safety.net.
16. Pratt & Whitney. PurePower PW1000G Engine. [Online] 2016. [Cited: 15 January
2016.] http://www.purepowerengine.com.](https://image.slidesharecdn.com/9f4610c3-8ea5-499e-a3c3-760a9243edd3-161011105753/85/AVIA1000-Group-Project-58-320.jpg)
![AVIA1000 2015/16 Airbus A320 Design Project
58
17. Duchene, N. The impact of aircraft weight on aircraft take-off emissions. Paris :
Eurocontrol Experimental Centre, 2006.
18. International Civil Aviation Organisation. Airport Air Quality Manual. United States :
ICAO, 2006. 1st Edition.
19. IPCC. Aviation and the Global Atmosphere: A Special Report of the Intergovernmental
Panel on Climate Change. United Kingdom : Cambridge University Press, 1999.
20. NASA. Forces on an Airplane. [Online] 2016. [Cited: 19 January 2016.]
http://www.grc.nasa.gov/www/k-12/airplane/formces.html.
21. —. Virtual Skies Aeronautics. [Online] 2016. [Cited: 19 January 2016.]
http://virtualskies.arc.nasa.gov/aeronautics/2.html.
22. Federal Aviation Administration. Aircraft Weight and Balance Handbook. United
States : FAA, 2007.
23. West Wings Inc. Effect of GG. [Online] 2016. [Cited: 19 January 2016.]
http://www.westwingsinc.com/cgeffect.html.
24. Federal Aviation Administration. Aircraft Structures. [Online] [No date]. [Cited: 16
January 2016.]
25. Century of Flight. Development of Aviation Technology. The Monoplane. [Online]
2014. [Cited: 14 January 2016.] http://www.century-of-
flight.net/Aviation%20history/evolution%20of%20technology/The%20Monoplane.htm.
26. Campbell, F. C. Structural Composite Materials. Materials Park, Ohio : ASM
International, 2010.
27. K. B. Armstrong, R. T. Barrett. Care and repair of advanced composites. Warrendale,
PA : Society of Automotive Engineers, 1998.
28. Aboutflight.com. Types of Aircraft Construction. [Online] 2016. [Cited: 19 January
2016.] http://www.aboutflight.com/handbook-of-aeronautical-knowledge/ch-02-aircraft-
structure/types-of-aircraft-construction.
29. Sadraey, M. H. Aircraft Design- A Systems Engineering Approach. [Online] 2012.
[Cited: 14 January 2016.] https://books.google.co.uk/books?id=VT-
Tc3Tx5aEC&dq=The+application+of+engines+on+aircraft&source=gbs_navlinks.
30. The Jet Engine. Rolls Royce plc. United Kingdom : Rolls Royce plc, 1996, Vol. 5th
Edition.
31. Airbus S.A.S. A320 Aircraft Characteristics: Airport and Maintenance Planning.
[Online] 2005. [Cited: 16 January 2016.]
http://www.airbus.com/fileadmin/media_gallery/files/tech_data/AC/Airbus-AC-A320-
Jan16.pdf.
32. CFM International. CFM56-5B Turbofan Engine. [Online] 1996-2016. [Cited: 16
January 2016.] http://www.cfmaeroengines.com/engines/cfm56-5b.](https://image.slidesharecdn.com/9f4610c3-8ea5-499e-a3c3-760a9243edd3-161011105753/85/AVIA1000-Group-Project-59-320.jpg)
![AVIA1000 2015/16 Airbus A320 Design Project
59
33. Airbus S.A.S. A320 Dimensions and Key Data. [Online] 2015. [Cited: 16 January 2016.]
http://www.airbus.com/aircraftfamilies/passengeraircraft/a320family/a320/specifications/.
34. O. Turan, H. Aydin. Power Systems analysis of an Aero-engine. Journal of Power and
Energy Engineering. [Online] 2015. [Cited: 17 January 2016.]
file:///C:/Users/User/Downloads/JPEE_2015051916594102%20(3).pdf.
35. Melber-Wilkending, S. Aerodynamic Analysis of Jet-Blast using CFD considering as
example a Hangar and Airbus A380 Configurations. [Online] 2004. [Cited: 17 January 2016.]
http://link.springer.com/chapter/10.1007%2F978-3-540-33287-9_19?LI=true#page-1.
36. Boeing Commercial Airplanes. 737 Airplane Characteristics for Airport Planning.
[Online] 2013. [Cited: 17 January 2016.]
http://www.boeing.com/assets/pdf/commercial/airports/acaps/737.pdf..
37. Federal Aviation Administration. Aviation Maintenance Technician Handbook-
Airframe (Vol. 1). United States : FAA, 2012.
38. Kundu, A. Aircraft Design. Cambridge : Cambridge University Press, 2010.
39. SKYbrary Aviation Safety. Drag. [Online] 2015. [Cited: 19 January 2016.]
http://www.skybrary.aero.
40. Fielding, John P. Introduction to Aircraft Design. Cranfield University : Cambridge
University Press, 1999.
41. Hebborn, Andrew. DLGR Landing Gear and Systems. [Online] Hambury: Airbus
S.A.S., 2008. [Cited: 15 January 2016.]
42. Mason, F. Landing Gear System. [Online] 2011. [Cited: 16 January 2016.]
43. Roloff, Gerd. Landing Gear: The Evolution of a System. [Online] 2002. [Cited: 17
January 2016.]
44. Raymer, Daniel P. Aircraft Design: A Conceptual Approach. Virginia : AIAA, 2006.
45. Ministry of Defence. RAF Tornado. [Online] 2015. [Cited: 14 January 2016.]
http://www.raf.mod.uk/equipment/tornado.cfm.
46. Fighter Planes. Eurofighter. [Online] [Cited: 16 January 2016.] http://www.fighter-
planes.com/info/eurofighter_ef2000.htm .
47. SATA Virtual. A320 Limitations. [Online] [Cited: 14 January 2016.]
http://www.satavirtual.org/fleet/A320LIMITATIONS.PDF.
48. Answers. "What type of flat and slat A320 used?". [Online] [Cited: 17 January 2016.]
http://www.answers.com/Q/What_type_of_flap_and_slat_A320_used.
49. Wright, Stephen. Introduction to Aviation (AVIA1040)- Powerpoint. University of
Leeds : s.n., 2015-16.
50. Anderson, J. Introduction to Flight 5th Ed. New York : McGraw-Hill, 2004.
51. Sadraey, J. Tail Design. United States: Daniel Webster College : s.n., 2010.](https://image.slidesharecdn.com/9f4610c3-8ea5-499e-a3c3-760a9243edd3-161011105753/85/AVIA1000-Group-Project-60-320.jpg)
![AVIA1000 2015/16 Airbus A320 Design Project
60
52. Gudmundsson, S. General Aviation Aircraft Design: Applied Methods and Procedures.
United Kingdom : Butterworth-Heinemann, 2013.
53. Cole, S. Applied Transport Economics: Policy, Management and Decision-Making.
United Kingdom : Kogan-Page Publishers, 2005.
54. Fokker Aircraft. Fokker 70. [Online] 2015. [Cited: 17 December 2015.]
http://www.fokker-aircraft.info.
55. National Aeronautics and Space Agency. Quest for Performance: The evolution of
modern aircraft. [Online] 2015. [Cited: 17 December 2015.] http://www.history.nasa.gov.
56. Wikipedia. Blériot XI. [Online] 2015. [Cited: 19 January 2016.]
http://en.wikipedia.org/wiki/B1%C3%A9riot_XI.
57. Diseno-art. McDonnell XP-67 "Bat" or "Moonbat". [Online] 2012. [Cited: 19 January
2016.] http://www.diseno-art.com/news_content/2012/05/mcdonnell-xp-67-bat-or-moonbat/.
58. Mecca.org. How We Made The First Flight. [Online] 2016. [Cited: 29 January 2016.]
http://www.mecca.org/~tschieff/aviation/academy/firsflt.htm.
59. National Air and Space Museum Washington. Albatross D. Va. . [Online] Unknown,
1917. [Cited: 17 January 2016.]
60. Air Cav. Wings. [Online] 2000. [Cited: 13 January 2016.]
http://www.aircav.com/recog/chp03/ch03-003.gif .
61. Paper Aeroplanes. Lateral Stabulity 1. [Online] 2010. [Cited: 16 January 2016.]
http://paperaeroplanes.com/dihedraleffect1.jpg.
62. RC Groups Forum. [Online] [Cited: 17 January 2016.]
http://static.rcgroups.net/forums/attachments/1/6/0/9/2/a71942-100-example.gif.
63. Two Scenarios. [Online] [Cited: 13 January 2016.]
http://twoscenarios.typepad.com/.a/6a00d8341c1ad753ef011570169b50970b-450wi.
64. Innovations, Deicing. [Online] [Cited: 18 January 2016.]
http://training.deicinginnovations.com/wp-content/gallery/winglets_1/dsc03158.jpg .
65. Airliners.net. Airbus A320 Lufthansa. [Online] [Cited: 15 January 2016.] http://cdn-
www.airliners.net/aviation-photos/photos/8/0/1/2237108.jpg.
66. US Airways. A320 Empennage. [Online] 2009. [Cited: 17 December 2015.]
http://www.aeroweb-fr.net.
67. Airliner Gallery. Avro RJ100. [Online] 2015. [Cited: 17 December 2015.]
http://www.airlinergallery.nl.
68. Aerofiles. Thurston TA16. [Online] 2015. [Cited: 17 December 2015.]
http://www.aerofiles.com.
69. Rikoooo Simulation. Antonov An-225. [Online] 2015. [Cited: 17 December 2015.]
http://www.rikoooo.com.](https://image.slidesharecdn.com/9f4610c3-8ea5-499e-a3c3-760a9243edd3-161011105753/85/AVIA1000-Group-Project-61-320.jpg)
![AVIA1000 2015/16 Airbus A320 Design Project
61
70. National Aeronautics and Space Administration. Ikhana. [Online] 2015. [Cited: 17
December 2015.] http://www.dfrc.nasa.gov.
71. Air Power World. F-14 Phantom. [Online] 2015. [Cited: 17 December 2015.]
http://www.airpowerworld.info.
72. Planespotters.net. Reims F337F. [Online] 2015. [Cited: 17 December 2015.]
http://www.planespotters.net.
73. Fokker Aircraft. Fokker 70. [Online] 2015. [Cited: 17 December 2015.]
http://www.fokker-.
74. The-Blueprints.com. British Aerospace BAE146. [Online] 2015. [Cited: 17 December
2015.] http://www.the-blueprints.com.
75. Airbus S.A.S. Airbus A380 Aircraft Characteristics Airport and Maintenance Planning.
[Online] 2014. [Cited: 17 December 2015.] http://www.airbus.com.
76. NASA. Downwash effects on airplane tail. [Online] 2015. [Cited: 17 December 2015.]
http://www.history.nasa.gov.](https://image.slidesharecdn.com/9f4610c3-8ea5-499e-a3c3-760a9243edd3-161011105753/85/AVIA1000-Group-Project-62-320.jpg)