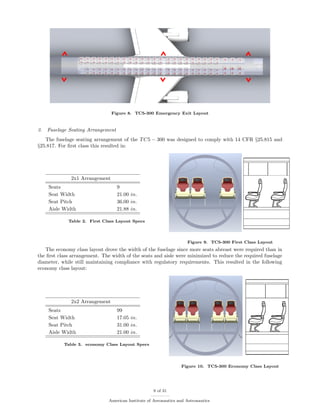
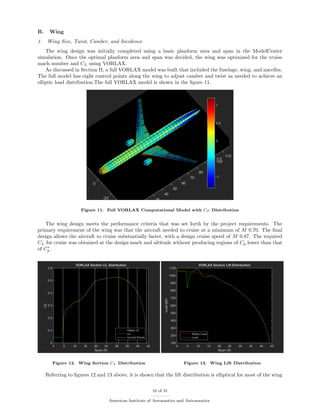
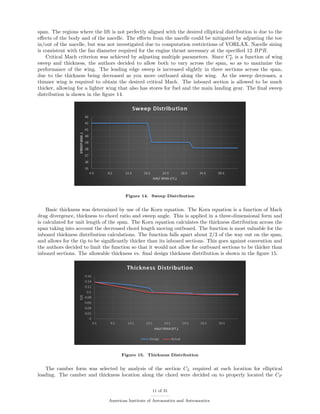
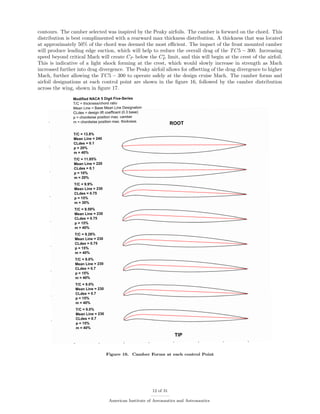
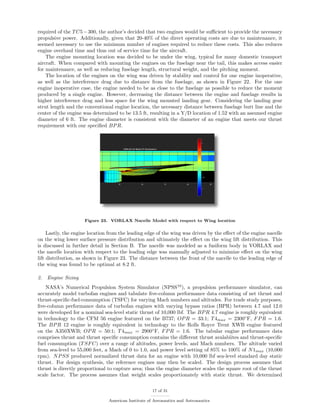
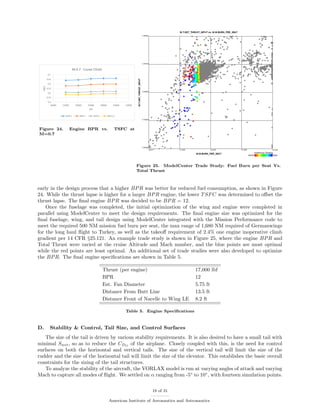
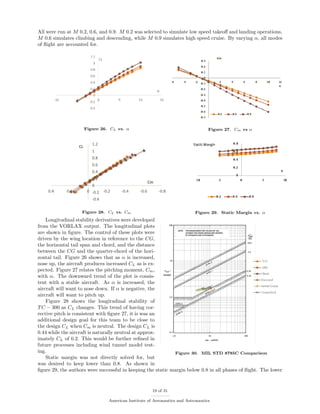
1. Next-Generation Regional Jet Transport
Conceptual Design
Michael S. Benassi†
, Chase R. Hrdina†
, Eric Horton†
, Eric Hadder†
, Christina Munoz†
and
Timothy T. Takahashi‡
Arizona State University, Tempe, AZ, 85281
This paper presents the conceptual design of a near-term technology ∼100 passenger re-
gional jet. This aircraft was designed to meet current 14 CFR §25 regulations, offer an un-
usually competitive fuel burn, and operate between airports derived from typical US domestic
airline regional jet routes. Our final design carries up to 99 passengers; with a 15,000 lbm
payload over a 500 NM flight, it consumes 31.4 lbm of fuel per seat. This design was optimized
using a collection of custom and legacy analysis codes all integrated together using ModelCen-
ter. Interestingly, despite the short stage length, the final design had optimal cruise at 41,000
ft and Mach 0.87.
Nomenclature
Alt Altitude, ft
AR Wing Aspect Ratio
b Wing Span, ft
BPR Bypass Ratio
c Chord, ft
¯c Wing Mean Chord ft
cr Wing Root Chord ft
ct Wing Tip Chord, ft
CDO
Coefficient of Base Drag
CL Coefficient of Lift
Cl Coefficient of Rolling Moment
Cm Coefficient of Pitching Moment
Cn Coefficient of Yawing Moment
CP Coefficient of Pressure
CFL Critical Field Length, ft
CFR Code of Federal Regulations
CG Center of Gravity
Cy Coefficient of Side Force
Fs Shear Force, lbf
Ixx Rolling moment of Inertia
Iyy Pitching Moment of Inertia
Izz Yawing Moment of Inertia
†Undergraduate, Aerospace Engineering, School of Engineering Matter Transportation & Energy. Tempe, AZ
‡Professor of Practice, Aerospace Engineering, School of Engineering Matter Transportation & Energy. Arizona State
University, Tempe, AZ. Associate Fellow AIAA.
1 of 31
American Institute of Aeronautics and Astronautics
2. IGE In Ground Effect
KIAS Knots Indicated Airspeed
L Wing Load, lbf
L Wing Running Load, lbf
LCDP Lateral Control Departure Parameter
LDR Landing Distance Required
M Mach
Mf Wing Bending Moment, lbf ∗ ft
MLW Maximum Landing Weight, lbm
MTOW Maximum Take-Off Weight, lbm
MZFW Maximum Zero Fuel Weight, lbm
NM Nautical Mile
OEI One Engine Inoperative
OEW Operational Empty Weight, lbm
OPR Overall Pressure Ratio
Sref Wing Planform Area, ft2
Swet Wetted Area, ft2
SM Static Margin
T Thrust
TC Thickness to Chord Ratio
TSFC Thrust Specific Fuel Consumption, lbm/hr/lbf
Vapp Approach Speed
Vfuss Flaps Up Safety Speed
VMCA Minimum Control Airspeed
VMCG Minimum Control Ground Speed
VMU Minimum Unstick Speed
VS Stall Speed
VSY Stall Reference Speed
V2 Obstacle Clearance Speed
W Weight, lbm
y Span-wise Wing Section, ft
α Angle of Attack, deg
β Side Slip Angle, deg
λ Wing Sweep, deg
δ Control Surface Deflection, deg
n/α Gee Per Angle of Attack, Radians
ωsp Short Period Frequency, Hz
ωdr Dutch Roll Frequency, Hz
I. Introduction
In recent years, a new marketing opportunity arose in the airline industry, the need for a 100 seat regional
jet that matches the per seat-fuel burn of larger aircraft. Over the past several years fuel prices have risen
sharply to historic highs. However, as the price of fuel has skyrocketed, so has the demand for commercial
air travel. Airlines are now reporting record passenger movements and the demand for seats in the aircraft
have continued to increase. This paper will outline the conceptual design of a 96 - 100 seat aircraft that will
outperform the aircraft currently available in the market, as well as aircraft entering service in the near future.
This conceptual design begins with a projected route structure of a launch customer. The requirements for
the airplane are derived from the intended flight routes and airports. The designers performed trade studies
to choose a design that not only fits the design requirements, but exceeds the performance of other aircraft
in this market.
Five aircraft types compete in the 100 seat regional aircraft market. They include the Mitsubishi
Regional Jet (MRJ), the Bombardier C − Series, as well as some of the existing competitors with the
Canadair Regional Jet (CRJ − 1000) and Embraer Regional Jet (ERJ − 145). Figure 1 contains some
2 of 31
American Institute of Aeronautics and Astronautics
3. basic comparisons and information regarding these types of aircraft.
Figure 1. Competition Aircraft Specs.
Based upon this benchmark for passenger room,
range and cruise speed, our proposed design will of-
fer improvements in all these areas and best of all
will offer a design cruise speed substantially out-
matching all the competitors with a fuel burn per
seat mile far exceeding current design. Some of these
aircraft have been extremely successful in the indus-
try and some have yet to come into service.
1. Design Requirements and Constraints
This section will discuss the requirements and
constraints that were set forth in our design project
as well as operational constraints the team derived
in designing the aircraft. The aircraft was designed
to not only meet but exceed the design requirements
set forth but exceed that of our competitors in the
market. Furthermore, be an optimal design op-
erationally for our launch customer and the other
launch customers in the competition. The aircraft
was also designed to be fully compliant with the ap-
plicable FAA regulations found in Title 14 CFR §25.
The baseline design requirements for our aircraft are as follows:
The aircraft must be certified to FAA standards in effect in 2014/15. In other words, 14 CFR §25
(airworthiness), 14 CFR §33 (engine), 14 CFR §36 (noise), 14 CFR §91 (operations), and 14 CFR §121
(operations).
a. carry 2 pilots + 2 cabin attendants + 96 to 100 passengers in a typical 2-class interior
a. fuselage interior for 2+1 coach / 1+1 first class (ERJ145)
b. fuselage interior for 2+2 coach / 2+1 first class (CRJ1000)
c. fuselage interior for 2+3 coach / 2+2 first class (DC9/BaE146)
b. minimum cruise of M 0.70, though, faster is better
c. ”Size” the aircraft for a 20,000 lbm payload at your maximum design range
d. configure for maximum economy flying a ”shorter-range” mission (i.e. take-off at less than MTOW)
a. 500 NM climb/cruise/descent + 45 min hold at 5,000 ft w/ 15,000 lbm payload
b. Meeting the following fuel-burn-per-seat-mile target over the ”shorter range”
mission: 36 lbm fuel consumed per seat on 500 NM trip w/ 15,000 lbm payload
To further refine our performance benchmark, we designed this aircraft to offer maximum efficiency for
an inter-European airline. Our operations research focused on the route structure of Germanwings airlines as
a hypothetical launch customer. Germanwings is a German low cost carrier which is based at Cologne/Bonn
Airport, Germany. They offer flights to over 85 destinations throughout Europe and are one of the most
successful low cost carriers. Figure 2 shows the current route map structure. From this route map structure,
a list of current routes was created and is shown in figure 3. This table of routes served as a baseline for
constraints for cruise performance and field performance data. The primary designing condition was our
long haul route from Cologne to Antayla, Turkey, with a range of 1,640 NM. Our second constraining factor
was our short-field condition of Stockholm-Bromma. Stockholm-Bromma airport has a runway length of
5,472 ft but a flight range of 630 NM. These two conditions were the drivers for our design. The aircraft had
to be able to carry a certain payload and fly the required distance and takeoff and land from a short field.
The aircraft also has to be able to carry enough fuel to fly the required distance of 1,640 NM with enough
reserves to fly to an alternate airport.
Another constraint that was set by the team was operational integration into our launch customer’s fleet.
Our team decided to make the design integrate into our launch customer’s fleet by constraining wingspan,
length, engine type and other important factors to be of a similar size as they already operate. Germanwings
currently operates a fleet of 62 Airbus A319 and A320 aircraft. These aircraft offer wingspans of 111 ft and
a fuselage length of no greater than 123 ft. From these numbers, the team was able to put constraints on
these variables while performing trade studies to not allow these variables to be exceeded. By doing this,
3 of 31
American Institute of Aeronautics and Astronautics
4. Figure 2. Germanwings Route Map
Figure 3. Germanwings Flight Routes
our team was able to better market our design to our launch customer by offering no loss of gate space and
no other operational constraints put forth by bringing a new aircraft into the fleet.
2. Proposed Design Overview
The author’s proposed regional jet design is called the TC5 − 300. The final SolidWorks model designed
by the authors is shown in figures 6, 4, & 5. Performance specifications, design sizes, and aircraft weights
will be discussed in their relevant sections
Figure 4. TC5-300 SolidWorks Model, Side View
4 of 31
American Institute of Aeronautics and Astronautics
5. Figure 5. TC5-300 SolidWorks Model, Top View
Figure 6. TC5-300 SolidWorks Model, Trimetric View
5 of 31
American Institute of Aeronautics and Astronautics
6. II. Design Methodology and Tools
In the design of the TC5 − 300, a number of design tools were created and implemented to design the
various components of the aircraft. This section outlines the design methodology and describes the tools in
detail. The use of these tools for each component is described in the respective component design sections.
A. Design Methodology
In order to meet the design requirements in a timely manner, the author’s started out with a number of
design goals in order to streamline the design process and ensure that the end design was realistic in scope
and feasibility. The goals are as follows:
• Meet the needs of a hypothetical launch customer in terms of airport gate, stage length and runway
compatibility characteristics
• Exceed current regional jet transport performance to ensure the end design is marketable
• Create a realistic design within the scope of current manufacturing capabilities and maintenance re-
quirements
• Design the aircraft with accurate and achievable numbers (i.e. only design components that can be
accurately modeled with the tools available to the authors)
B. Aircraft Design Optimization
The overall aircraft design was optimized using ModelCenter developed by Phoenix Integration. Model-
Center is a software package created to automate the design process by integrating various software into a
model based simulation framework. The authors used ModelCenter to build a simulation framework that in-
cluded each of the design tools detailed in this section. The simulation varied design parameters to optimize
the aircraft design for best performance.
C. Wing Thickness Allocation Tool
Wing thickness was determined using a thickness tool developed in Microsoft Excel by the authors. The
allowable leading edge thickness for the wing was determined using the Korn Equation:
TC = k − 0.1 ∗ CLle − Mnorm (1)
The thickness tool varied the design Mach number, cruise altitude, MTOW, and drag divergent Mach
number to determine the allowable wing thickness. The thickness tool then used basic sweep theory to
convert from the wind axis reference frame to the leading edge reference frame. Both the spanwise load
distribution and section CL distribution were then determined for optimum elliptical loading of the wing.
The thickness tool was then integrated with ModelCenter for wing thickness optimization.
D. Weight Estimation Tool
The aircraft weight estimation was done using a Microsoft Excel spreadsheet developed by Dr. Takahashi,
which was based on Professor Torenbeek’s emprical weight estimation formulas. The spreadsheet used design
sizes of the fuselage, wing, and tail, estimated MTOW and MLW, as well as other various parameters such
as landing gear configuration, wing and tail location, CG location and design Mach number, and powerplant
size to determine the resultant weight of standard aircraft components. The weight estimation tool was then
integrated with ModelCenter to optimize the aircraft weight for required performance.
E. Lift and Drag Estimation Tool
EDET6
(Empirical Drag Estimation Technique) was used by the author’s to estimate the lift and drag
buildup of the aircraft design. EDET is a legacy FORTRAN program developed by Richard Feagin and
William Morrison at Lockheed-California under contract for NASA. The EDET code was modified by Dr.
6 of 31
American Institute of Aeronautics and Astronautics
7. Takahashi to run on a modern PC through windows command line. The author’s developed a Microsoft
Excel spreadsheet that runs EDET for streamlined use and integration with ModelCenter.
EDET takes in the size of the fuselage, wing, nacelle’s, and tail surface at a specified altitude and Mach
number to buildup lift and drag of the aircraft across a range of altitude and mach numbers. In addition,
EDET determines the post-stall characteristic (stable or unstable) of the aircraft as well as the buffet CL
across a range of Mach numbers.
F. Point Performance/ Skymap Tool
Point performance for the design was calculated using a MS Excel spreadsheet designed by the author’s,
which calculated the point performance based on the EDET output data and five-column propulsion data.
Standard performance equations were used to estimate minimum and maximum thrust, total drag, CD, CL,
total lift, L/D, KTAS, KIAS, dynamic pressure, fuel flow, specific range, rate of climb, and specific excess
thrust at a range of altitude and Mach numbers for a specified aircraft weight. MATLAB was used to plot
the resulting Skymap’s of each performance parameters. The point performance tool was integrated with
ModelCenter and used to optimize cruise altitude and cruise Mach number.
G. Aerodynamic Forces and Moments Tools
The author’s used VORLAX8
to determine the aerodynamic forces and moments of the aircraft design.
VORLAX is a physics based vortex lattice code developed by Luis Miranda at Lockheed-California under
contract for NASA in the 1970’s. VORLAX is a panel based method that can be simulate aircraft as
either flat panels, fusiform bodies or a combination thereof. The panels can simulate camber, thickness, and
incidence over a variety of Mach numbers. VORLAX is accurate for both subsonic and supersonic flight
regimes for models that can be accurately simulated using thin-airfoil theory.
The author’s created an EXCEL spreadsheet that interfaced with VORLAX such that it writes the
VORLAX inputs and extracts the output from VORLAX. The outputs were then sent to a MATLAB script
developed by the author’s which calculated the inferred panel shapes, coordinates, and pressure distributions,
and then and plotted them in a three-dimensional form for visualization and verification of design.
H. Mission Performance Tool
Mission profile and performance was simulated using a spreadsheet developed by Dr. Takahashi. The
spreadsheet uses a point-mass method to iterate over the mission profile to determine weight, fuel burn,
altitude, flight speed, and flight time over the mission profile. The author’s used the mission performance
tool to verify the performance of aircraft design to ensure that it met the requirements for fuel burn, distance
flown, flight profile, and mission time.
III. Design Components
A. Fuselage
1. Overall Fuselage Design
The fuselage was designed to accommodate 99 passengers in a two class layout, two pilots, and two flight
attendants with allotted cargo for a domestic flight. The design also includes two lavatories, two galleys,
and six exits, with standard equipment used in a regional jet. Figure 7 shows the cabin layout and Table 1
shows the fuselage specifications.
In designing the fuselage, the author’s limited the design options to a 2x2 or 3x2 economy class seat-
ing layout, since it was determined that the economy class drove the diameter of the fuselage. The main
considerations in the fuselage layout were the wetted area drag of the fuselage and the required number of
emergency exits per 14 CFR §25.807 and §25.809. Ultimately, the author’s noted the trend towards narrow
body airliners and verified that the total drag of the fuselage was slightly decreased with a narrower fuse-
lage. Hence, the author’s opted to use a 2x2 economy seating arrangement for decreased fuselage diameter,
resulting in a slightly longer fuselage due to the additional length necessary for over wing emergency exits.
7 of 31
American Institute of Aeronautics and Astronautics
8. Fuselage Length 118 ft
Fuselage Height 9.5 ft
Fuselage Width 8.66 ft
Fuselage Equiv. Dia. 9.08 ft
Cabin Length 71 ft
Cabin Height 6.5 ft
Cargo Capacity 440 ft2
Table 1. Fuselage Specifications
Figure 7. TC5 − 300 Cabin Layout View
The structure of the fuselage ring frames are of the typical ”double bubble” design. This design type
results in a fuselage that is slightly taller than it is wide, accommodating for additional cargo space and
cabin height. From a structural standpoint, this also increases the structural integrity of the fuselage since
it is slightly taller along the axial direction, reducing the bending moment of the fuselage in flight. The ring
frames of the fuselage are approximately 4-6 inches in width, which is typical for a domestic jet transport.
The thickest parts of the ring frame are at the top and bottom, as well as the sides, allowing more space
for equipment (electrical, hydraulic lines, etc.) and the cabin interior panels. This also helps with bending
moment relief of the fuselage frame in the high stress areas.
2. Fuselage Exits
To comply with 14 CFR §25.803, §25.807, §25.809 and §25.813 the TC5 − 300 had 4 Type B main doors,
with two at the front of the cabin and two at the rear of the cabin. Additionally, 2 Type II over-wing
emergency exits were installed to ensure that the TC5 − 300 is compliant with the 90 second emergency
evacuation requirement. This resulted in a max distance between emergency exits of 34.32 ft in compliance
with 14 CFR §25.807. The emergency exit layout is shown below in Figure 8.
8 of 31
American Institute of Aeronautics and Astronautics
9. Figure 8. TC5-300 Emergency Exit Layout
3. Fuselage Seating Arrangement
The fuselage seating arrangement of the TC5 − 300 was designed to comply with 14 CFR §25.815 and
§25.817. For first class this resulted in:
2x1 Arrangement
Seats 9
Seat Width 21.00 in.
Seat Pitch 36.00 in.
Aisle Width 21.88 in.
Table 2. First Class Layout Specs
Figure 9. TC5-300 First Class Layout
The economy class layout drove the width of the fuselage since more seats abreast were required than in
the first class arrangement. The width of the seats and aisle were minimized to reduce the required fuselage
diameter, while still maintaining compliance with regulatory requirements. This resulted in the following
economy class layout:
2x2 Arrangement
Seats 99
Seat Width 17.05 in.
Seat Pitch 31.00 in.
Aisle Width 21.00 in.
Table 3. economy Class Layout Specs
Figure 10. TC5-300 Economy Class Layout
9 of 31
American Institute of Aeronautics and Astronautics
10. B. Wing
1. Wing Size, Twist, Camber, and Incidence
The wing design was initially completed using a basic planform area and span in the ModelCenter
simulation. Once the optimal planform area and span was decided, the wing was optimized for the cruise
mach number and CL using VORLAX.
As discussed in Section II, a full VORLAX model was built that included the fuselage, wing, and nacelles.
The full model has eight control points along the wing to adjust camber and twist as needed to achieve an
elliptic load distribution.The full VORLAX model is shown in the figure 11.
Figure 11. Full VORLAX Computational Model with CP Distribution
The wing design meets the performance criteria that was set forth by the project requirements. The
primary requirement of the wing was that the aircraft needed to cruise at a minimum of M 0.70. The final
design allows the aircraft to cruise substantially faster, with a design cruise speed of M 0.87. The required
CL for cruise was obtained at the design mach and altitude without producing regions of Cp lower than that
of C∗
p .
Figure 12. Wing Section CL Distribution Figure 13. Wing Lift Distribution
Referring to figures 12 and 13 above, it is shown that the lift distribution is elliptical for most of the wing
10 of 31
American Institute of Aeronautics and Astronautics
11. span. The regions where the lift is not perfectly aligned with the desired elliptical distribution is due to the
effects of the body and of the nacelle. The effects from the nacelle could be mitigated by adjusting the toe
in/out of the nacelle, but was not investigated due to computation restrictions of VORLAX. Nacelle sizing
is consistent with the fan diameter required for the engine thrust necessary at the specified 12 BPR.
Critical Mach criterion was achieved by adjusting multiple parameters. Since C∗
P is a function of wing
sweep and thickness, the authors decided to allow both to vary across the span, so as to maximize the
performance of the wing. The leading edge sweep is increased slightly in three sections across the span,
due to the thickness being decreased as you move outboard along the wing. As the sweep decreases, a
thinner wing is required to obtain the desired critical Mach. The inboard section is allowed to be much
thicker, allowing for a lighter wing that also has stores for fuel and the main landing gear. The final sweep
distribution is shown in the figure 14.
Figure 14. Sweep Distribution
Basic thickness was determined by use of the Korn equation. The Korn equation is a function of Mach
drag divergence, thickness to chord ratio and sweep angle. This is applied in a three-dimensional form and
is calculated for unit length of the span. The Korn equation calculates the thickness distribution across the
span taking into account the decreased chord length moving outboard. The function is most valuable for the
inboard thickness distribution calculations. The function falls apart about 2/3 of the way out on the span,
and allows for the tip to be significantly thicker than its inboard sections. This goes against convention and
the authors decided to limit the function so that it would not allow for outboard sections to be thicker than
inboard sections. The allowable thickness vs. final design thickness distribution is shown in the figure 15.
Figure 15. Thickness Distribution
The camber form was selected by analysis of the section CL required at each location for elliptical
loading. The camber and thickness location along the chord were decided on to properly located the CP
11 of 31
American Institute of Aeronautics and Astronautics
12. contours. The camber selected was inspired by the Peaky airfoils. The camber is forward on the chord. This
distribution is best complimented with a rearward max thickness distribution. A thickness that was located
at approximately 50% of the chord was deemed the most efficient. The impact of the front mounted camber
will produce leading edge suction, which will help to reduce the overall drag of the TC5 − 300. Increasing
speed beyond critical Mach will create CP below the C∗
P limit, and this will begin at the crest of the airfoil.
This is indicative of a light shock forming at the crest, which would slowly increase in strength as Mach
increased further into drag divergence. The Peaky airfoil allows for offsetting of the drag divergence to higher
Mach, further allowing the TC5 − 300 to operate safely at the design cruise Mach. The camber forms and
airfoil designations at each control point are shown in the figure 16, followed by the camber distribution
across the wing, shown in figure 17.
Figure 16. Camber Forms at each control Point
12 of 31
American Institute of Aeronautics and Astronautics
13. Figure 17. Camber Distribution
Taper Ratio, TR, was iteratively solved for. This was computed with Model Center. The inputs into
Model Center included EDET for drag estimations, Torenbeeks weight estimation sheet and sky maps to
predict the performance of the airplane. The taper ratio impacts the weight of the wing and the drag. Both
of these have impacts on the overall performance. Nearly 10,000 iterations were run and concluded with four
designs that were both feasible and reasonable. All of which had similar taper ratios. The design chosen
had close to the average taper ratio.
The Sweep angle of the wing, λ, was initially found with the same method described above. The trape-
zoidal wing planform was treated as a frame to which the modifications would be added onto. From this
beginning, the twist tool was manipulated to increase the sweep at various points on the wing. This was
accomplished by adding additional chord to the front of the wing. The sweep tool was designed to minimize
the induced drag, effectively increasing the Oswald efficiency. The variable sweep additions lead us to the
Crescent wing. The sweep that was added was greater at the inboard section and moderate at the mid
span. This shape is similar to that found on the Handley − Page V ictor, a successful British bomber. The
TC5 − 300 does not have in-wing mounted engines and thus does not necessitate a highly swept first panel.
Thus, leading edge sweep remained minimally greater than the wing frame. The wing frame has a sweep of
38◦
while the inboard and mid span have sweeps of 42◦
and 39◦
, respectively.
Wing area was also iteratively solved with the model center program described above. High altitude
performance facilitated the need for a larger wing planform area. This works against the need to minimize
wetted area. Minimizing wetted are will decrease the drag due to skin friction. It was also determined that
a smaller wing area is needed when cruise Mach is increased. The wing area, Mach and cruise altitude all
lead to the moderate CL of 0.44. This was deemed to be a very reasonable wing load and drove the size of
the wing area.
The span wise distribution of incidence was initially determined by use of the wing twist tool. Figure 18
shows the determined span wise distribution of twist.
Figure 18. Twist Distribution
13 of 31
American Institute of Aeronautics and Astronautics
14. The initial twist was insufficient at obtaining the completely elliptical loading, and did not account for
camber. Further honing was accomplished by adding in additional control points that allowed for manipu-
lation of the wing in a more precise manner. The additional control points allowed for twist, camber and
thickness to be redistributed for that panel. While maintaining a constant CL of 0.44, the authors were able
to iteratively adjust the twist and the camber along the span so as to meet the elliptical load distribution.
Furthermore, this was an additional parameter that we used to adjust the CP contour that is shown in the
figure below.
Figure 19. Top Surface CP Contours
The fuselage is at an angle of attack of 1.78◦
in cruise flight. By allowing the fuselage to have a small
angle of attack, the body will produce some lift, offsetting the lift required to be produced by the wing. If
the fuselage is horizontal at cruise, the wing will need to produce additional lift. This additional lift will
create additional induced drag. Thus, it was best to have a small angle of attack for the fuselage. The drag
due to lift by the body is minimal due to the small angle. The only issue with having a fuselage at an angle
of attack during cruise is that the passenger compartment will be at an incline. This would lead to drink
carts not wanting to go up hill and would could make it more difficult for passengers to move about the
cabin. It is recognize that an angle of less than 2◦
would have minimal effects. The additional performance
was more important than any of the insignificant negatives that may arise.
The final wing size and design conditions are listed in the table 4.
2. Wing Shear and Bending Moment
The structure and strength of the wing is crucial when designing a wing for any type of flight. The wing
must be designed to be able to support the entire weight of the aircraft during flight. In order to be 14
CFR §25 certified, the wing must also be able to support excess stresses such as maneuvers, shear force, and
bending moments. Other considerations to the final load include the engines, fuel, and even the weight of
the wing itself. In order to calculate the shear force and bending moment on the wing structure an EXCEL
spreadsheet was developed to model the physics for analytical use. Eq. 2 was derived to model the chord
of the wing starting from the semi-span to the wing tip as a function of y based off of cr, ct, b, and y the
semi-span location.
14 of 31
American Institute of Aeronautics and Astronautics
15. Design Cruise Mach 0.87
Design Critical Mach 0.87
Design Cruise Altitude 41,000 ft.
Design CL 0.44
Wingspan 88.2 ft.
Avg. LE Sweep 39 deg
Sref 823 ft.
Root Chord 20.24 ft.
Tip Chord 4.84 ft.
Aspect ratio 9.33
Taper Ratio 0.239
Table 4. Wing Size and Design Conditions
c(y) = cr −
cr − ct
0.5b
∗ y (2)
Once the semi-span chord was modeled, the thickness was applied using Eq. 3.
Thickness = c(y) ∗
T
c
(3)
Now that the chord and thickness for half of the wing has been modeled in EXCEL, the elliptical lift
must also be modeled in EXCEL to be able to calculate the force applied to the wing. An empirical method
was used to model the lift per span of the wing. Eq. 4 was used to create the elliptical lift distribution along
the span of the wing. The value of 1465 was found by iterating this constant until the entire wing provided
the exact amount of lift at cruise conditions, namely 85,000 lbf.
L = 1465 ∗ 1 −
y
0.5 ∗ b
2
(4)
The engine load was modeled by simply adding the engine weight at the appropriate location along the
span, at 13.5 ft from the centerline of the fuselage. For the TC5 − 300 to achieve the long haul flight it must
carry 13,000 lbm of fuel. Thus, this weight must also be factored into the structure of the wing. By using
Eq. 5 the location and load of the fuel was modeled in EXCEL.
Lfuel = ((0.75 ∗ y ∗ 0.6 ∗ c(y) ∗ 0.75 ∗ TC(y) ∗ c(y) ∗ 7.48) ∗ 6.8) (5)
The final load that was considered was the actual weight of the wing itself. Due to past experience and
research the weight of the wing was approximated to 35 lbs per foot.
Now that the geometry and all appropriate loads have been modeled in EXCEL, a numerical recursion
method was developed to calculate both the shear force F and bending moment Mf .
F(yi) = L(yi) − (Lwing(yi) + Lfuel(yi) + Lengine(yi)) + F(yi+1) (6)
Mf (yi) = F(yi) + Mf (yi+1) (7)
15 of 31
American Institute of Aeronautics and Astronautics
16. Figure 20. Shear Force Distribution Figure 21. Bending Moment Distribution
2.5 gees were applied to both F and Mf per 14 CFR S25.337(b). The tensile force on the wing cover
was then calculated via Eq. 8.
Ft(y) =
Mf (y)
Thickness(y) ∗ 1.4
(8)
The material of the spar caps was chosen to be Aluminum 6061. The ultimate strength of Aluminum
6061 is Fu = 38 ksi (A rating). By applying a factor of safety of 1.5 per 14 CFR §25.303, the de-rated
ultimate strength of Aluminum 6061 is Fud = 25.3 ksi. Finally, the cross sectional area of the spar cap Aspar
was calculated via Eq. 9.
Aspar(y) =
Ft(y)
Fud
(9)
C. Powerplant
1. Number of Engines and Location
Figure 22. Engine Location vs. Interference Drag
The author’s decided upon the number of engines (2) and their location based upon the design require-
ments and standard industry maintenance requirements. Given the short domestic flights and small payload
16 of 31
American Institute of Aeronautics and Astronautics
17. required of the TC5−300, the author’s decided that two engines would be sufficient to provide the necessary
propulsive power. Additionally, given that 20-40% of the direct operating costs are due to maintenance, it
seemed necessary to use the minimum number of engines required to reduce these costs. This also reduces
engine overhaul time and thus out of service time for the aircraft.
The engine mounting location was decided to be under the wing, typical for many domestic transport
aircraft. When compared with mounting the engines on the fuselage near the tail, this makes access easier
for maintenance, as well as reducing fuselage length, structural weight, and the pitching moment.
The location of the engines on the wing was driven by stability and control for one engine inoperative,
as well as the interference drag due to distance from the fuselage, as shown in Figure 22. For the one
engine inoperative case, the engine needed to be as close to the fuselage as possible to reduce the moment
produced by a single engine. However, decreasing the distance between the engine and fuselage results in
higher interference drag and less space for the wing mounted landing gear. Considering the landing gear
strut length and the conventional engine location, the necessary distance between fuselage butt line and the
center of the engine was determined to be 13.5 ft, resulting in a Y/D location of 1.52 with an assumed engine
diameter of 6 ft. The engine diameter is consistent with the diameter of an engine that meets our thrust
requirement with our specified BPR.
Figure 23. VORLAX Nacelle Model with respect to Wing location
Lastly, the engine location from the leading edge of the wing was driven by the effect of the engine nacelle
on the wing lower surface pressure distribution and ultimately the effect on the wing lift distribution. This
is discussed in further detail in Section B. The nacelle was modeled as a fusiform body in VORLAX and
the nacelle location with respect to the leading edge was manually adjusted to minimize effect on the wing
lift distribution, as shown in Figure 23. The distance between the front of the nacelle to the leading edge of
the wing was found to be optimal at 8.2 ft.
2. Engine Sizing
NASA’s Numerical Propulsion System Simulator (NPSS10
), a propulsion performance simulator, can
accurately model turbofan engines and tabulate five-column performance data consisting of net thrust and
thrust-specific-fuel-consumption (TSFC) for varying Mach numbers and altitudes. For trade study purposes,
five-column performance data of turbofan engines with varying bypass ratios (BPR) between 4.7 and 12.0
were developed for a nominal sea-level static thrust of 10,000 lbf. The BPR 4.7 engine is roughly equivalent
in technology to the CFM 56 engine featured on the B737; OPR = 33:1; T4max = 2300◦
F, FPR = 1.6.
The BPR 12 engine is roughly equivalent in technology to the Rolls Royce Trent XWB engine featured
on the A350XWB; OPR = 50:1; T4max = 2900◦
F, FPR = 1.6. The tabular engine performance data
comprises thrust and thrust specific consumption contains the different thrust avalabiites and thrust-specific
fuel consumption (TSFC) over a range of altitudes, power levels, and Mach numbers. The altitude varied
from sea-level to 55,000 feet, a Mach of 0 to 1.0, and power level setting of 85% to 100% of N1max (10,000
rpm). NPSS produced normalized thrust data for an engine with 10,000 lbf sea-level standard day static
thrust. For design synthesis, the reference engines may then be scaled. The design process assumes that
thrust is directly proportional to capture area; thus the engine diameter scales the square root of the thrust
scale factor. The process assumes that weight scales proportionately with static thrust. We determined
17 of 31
American Institute of Aeronautics and Astronautics
18. Figure 24. Engine BPR vs. TSFC at
M=0.7
Figure 25. ModelCenter Trade Study: Fuel Burn per Seat Vs.
Total Thrust
early in the design process that a higher BPR was better for reduced fuel consumption, as shown in Figure
24. While the thrust lapse is higher for a larger BPR engine, the lower TSFC was determined to offset the
thrust lapse. The final engine BPR was decided to be BPR = 12.
Once the fuselage was completed, the initial optimization of the wing and engine were completed in
parallel using ModelCenter to meet the design requirements. The final engine size was optimized for the
final fuselage, wing, and tail design using ModelCenter integrated with the Mission Performance code to
meet the required 500 NM mission fuel burn per seat, the max range of 1,680 NM required of Germanwings
for the long haul flight to Turkey, as well as the takeoff requirement of 2.4% one engine inoperative climb
gradient per 14 CFR §25.121. An example trade study is shown in Figure 25, where the engine BPR and
Total Thrust were varied at the cruise Altitude and Mach number, and the blue points are most optimal
while the red points are least optimal. An additional set of trade studies were also developed to optimize
the BPR. The final engine specifications are shown in Table 5.
Thrust (per engine) 17,000 lbf
BPR 12
Est. Fan Diameter 5.75 ft
Distance From Butt Line 13.5 ft
Distance Front of Nacelle to Wing LE 8.2 ft
Table 5. Engine Specifications
D. Stability & Control, Tail Size, and Control Surfaces
The size of the tail is driven by various stability requirements. It is also desired to have a small tail with
minimal Swet, so as to reduce the CDO
of the airplane. Closely coupled with this, is the need for control
surfaces on both the horizontal and vertical tails. The size of the vertical tail will limit the size of the
rudder and the size of the horizontal tail will limit the size of the elevator. This establishes the basic overall
constraints for the sizing of the tail structures.
To analyze the stability of the aircraft, the VORLAX model is run at varying angles of attack and varying
Mach to capture all modes of flight. We settled on α ranging from -5◦
to 10◦
, with fourteen simulation points.
18 of 31
American Institute of Aeronautics and Astronautics
19. All were run at M 0.2, 0.6, and 0.9. M 0.2 was selected to simulate low speed takeoff and landing operations,
M 0.6 simulates climbing and descending, while M 0.9 simulates high speed cruise. By varying α, all modes
of flight are accounted for.
Figure 26. CL vs. α Figure 27. Cm vs α
Figure 28. CL vs. Cm Figure 29. Static Margin vs. α
Figure 30. MIL STD 8785C Comparison
Longitudinal stability derivatives were developed
from the VORLAX output. The longitudinal plots
are shown in figure. The control of these plots were
driven by the wing location in reference to the CG,
the horizontal tail span and chord, and the distance
between the CG and the quarter-chord of the hori-
zontal tail. Figure 26 shows that as α is increased,
nose up, the aircraft produces increased CL as is ex-
pected. Figure 27 relates the pitching moment, Cm,
with α. The downward trend of the plot is consis-
tent with a stable aircraft. As α is increased, the
aircraft will want to nose down. If α is negative, the
aircraft will want to pitch up.
Figure 28 shows the longitudinal stability of
TC − 300 as CL changes. This trend of having cor-
rective pitch is consistent with figure 27, it is was an
additional design goal for this team to be close to
the design CL when Cm is neutral. The design CL is
0.44 while the aircraft is naturally neutral at approx-
imately CL of 0.2. This would be further refined in
future processes including wind tunnel model test-
ing.
Static margin was not directly solved for, but
was desired to keep lower than 0.8. As shown in
figure 29, the authors were successful in keeping the static margin below 0.8 in all phases of flight. The lower
19 of 31
American Institute of Aeronautics and Astronautics
20. the static margin, the less stable the aircraft will be. While this would appear to be something to make as
large as possible, there are issues that arise from an overly stable airplane. The effectiveness of the elevator
would be negatively impacted by being overly stable. This would require a much larger elevator to be able to
obtain the necessary performance, which would also increase the size of the horizontal tail. All of which will
increase the Swet of the tail and increase drag. Additionally, larger control surfaces would require a heavier
supporting structure.The static margin was calculated with Eq 10.
SM = −
dCm
dCL
100% (10)
The primary longitudinal design point was the short period frequency. 14 CFR §25.181 requires that
”Any short period oscillation, not including combined lateral-directional oscillations, occurring between 1.13
Vsr and maximum allowable speed appropriate to the configuration of the airplane must be heavily damped
with the primary controls” Due to the vagueness of this regulation, we sought the guidance of MIL-STD
8785C.5
The Department of Defense has clear performance parameters for each category of aircraft. Figure
shows the short period frequency vs gee per α parameters laid out by MIL-STD 8785C, with our results.
Due to the short period frequency being a function of both q and weight, we calculated for six general flight
conditions. Takeoff (T/O) was simulated with M 0.2, MTOW, at sea-level. Landing (LND) was simulated
with M 0.2, OEW, at sea-level. Climb is simulated with M 0.6, MTOW, at an altitude of 30,000 ft. Descent
is simulated with M 0.6, OEW, at an altitude of 30,000 ft. Initial cruise was simulated with M 0.9, MTOW,
at an altitude of 48,000 ft. End of cruise was simulated with M 0.9, OEW, at an altitude of 48,000 ft. For
completeness, each simulated flight scenario was also computed with α varied from -5◦
to 10◦
, in fourteen
steps. The parameters for which the simulations were run were purposefully beyond the performance of the
airplane to ensure bracketing of the entirety of the flight possibilities. The short period frequency and n/α
were calculated with Eq 11 and 12.
ωsp =
1
2π
−57.4(dCm
dα )qSref c
Iyy
(11)
n
α
=
57.4qSref (dCL
dα )
Weight
(12)
The pitching moments of inertia, Iyy, were estimated from Professor Roskam’s statistical regression of
empirical data.14
Since the moment of inertia is dependent on weight, values were determined for both
MTOW and OEW. The plot shows that the short period frequency is in the preferred region for all possible
flight scenarios.
Lateral stability derivatives were computed with two VORLAX outputs, with the second input being
identical to the first, except with β set to 1◦
. This allows for the lateral stability derivatives to be computed.
Lateral stability is coupled between the rolling and the yawing effects on the TC5 − 300.
Rolling moments due to β are the result of two simultaneous effects. First, due to the wings being swept,
the right wing will effectively decrease in sweep while the left wing will be effectively increased in sweep by
the value of β. This results in asymmetric lift as the left wing will have decreased lift and the right wing
will have increased lift. This creates a rolling moment to the left and is therefore negative. Second, due to
the vertical tail protruding above the fuselage, the lifting force of the vertical tail will produce additional
negative rolling moment. Rolling moment due to the vertical tail can be reduced by decreasing the height of
the vertical tail. The calculated rolling moment due to β through all phases of flight is shown in figure 32.
Yawing moments due to β are also the result of two effects. Primarily, yaw is due to the vertical tail.
The corrective force is a natural component of the vertical tail as the slip angle produces a vertical angle of
attack on the tail, which creates a horizontal lifting force, yawing the airplane into the side slip. This is a
component of the area of the tail and was not seen to be adversely impacted by reducing the height of the
tail for rolling moment considerations. Additional corrective yawing moment is produced by the asymmetric
induced drag due to the asymmetric lift of the wings. This is a weaker moment but is important due to
producing the coupling of wing sweep and vertical tail size effects. The calculated yawing moment due to β
through all phases of flight is shown in figure 31.
20 of 31
American Institute of Aeronautics and Astronautics
21. Figure 31. Yawing Moment vs. β
Figure 32. Rolling Moment vs. β
Due to the coupling of the moments due to β, considerations must be given to the frequency of dutch
roll oscillations. As with the short period, 14 CFR §25.181 only states that the dutch roll must be positively
damped for all flight scenarios. Returning to MIL STD 8785C, we are able to find guidance for the appropriate
dutch roll frequency. This is calculated with eqns 13 and 14.
ωdr =
1
2π
57.4CnβdynqSref b
Izz
(13)
Cnβdyn =
dCn
dβ
cos(α) −
dCl
dβ
Izz
Ixx
sin(a) (14)
The equations that make up ωdr are affected by changes in altitude, airspeed, α and weight. As was
done with short period, all of these parameters were varied to ensure a complete simulation. MIL STD
8785C provides the guidance for acceptable dutch roll. This is a simple check, which requires ωdr > 0.15 Hz.
The minimum frequency this design oscillates at is 0.249 Hz. This is only achieved when flying at M 0.9,
48,000 ft, at MTOW and with α of -5◦
. Thus we can assertively show that we have exceeded the dutch roll
requirements of MIL STD 8785C. The rolling moment of inertia and yawing moment of inertia, Ixx and Izz
respectively, were estimated from Professor Roskam’s statistical regression of empirical data.14
Due to the complexity of the coupling between these moments, we must also determine the impact of
control surface coupling. This was accomplished by calculating the lateral control departure parameter.
This is a measure of aileron effects on roll and yaw with respect to lateral and directional stability. This is
calculated with eqn 15.
Figure 33. Bihrle-Weissman Chart Comparison
LCDP =
dCn
dβ
−
dCl
dβ
dCn
δAil
dCl
δAil
(15)
The Bihrle-Weissman chart allows for the re-
sistance to spin and control departure to be de-
termined. As with the oscillation frequencies, we
bracketed the possible flight scenarios. The plot in
figure 33 shows that we are comfortably in the A re-
gion. This region is defined as being highly resistant
to control departure and highly spin resistant.
The Bihrle-Weissman chart was a guiding fac-
tor in selecting the aileron size. Other components
of this selection were the need to trim crosswind ap-
proaches and departures as well as ailerons will limit
the amount of trailing edge that may have flaps. For
the ailerons to be the most effective at rolling the
airplane, we placed them 1 ft from the end of the
21 of 31
American Institute of Aeronautics and Astronautics
22. wing. This allows for the aileron to produce the
greatest rolling moment with the least amount of surface. We decided to put the aileron ending 1 ft from the
wing tip due to the aileron requiring multiple hinge points that will be difficult or impossible to construct if
the aileron is at the wing tip.
Figure 34. VORLAX Model with Control
Surfaces
Figure 35. VORLAX Model with Flaps Ex-
tended
The size of the ailerons were iteratively determined through a VORLAX8
model that had control surfaces.
Figure 34 shows this model with ailerons, elevator and a rudder. This model was subjected to the same
varying Mach and α as above. This allowed for clear interpretation of their effects on the performance of
the airplane. Due to the coupling effects of aileron deflection on rolling and yawing moments, it was desired
to minimize their size. This was beneficial as it was also sought to minimize aileron span so as to allow for
a greater portion of the trailing edge to have flaps.
Rudder performance is an important performance parameter, as this is essential to provide the ability to
perform in crosswind conditions and to operate safely with one engine inoperative (OEI). OEI performance
has 3 different parameters that need to be analyzed. VMCG is driven by the OEI yawing moment and the
ability for the rudder to counter and keep the airplane on the runway. The engine location is fixed and the
thrust is in takeoff setting, thus the yawing moment is worst case. This ability for the rudder to counter the
yaw is directly related to how large the rudder is. The rudder is limited in height to the same as the vertical
tail. We did not find that the rudder performance was reduced if the height of the rudder was reduced while
keeping the area constant. This relationship allowed for us to keep the tail short from the earlier lateral
stability. The tail to rudder ratio is higher than normal but is not beyond the limits of any aircraft that
have been operated as an airliner before (see DouglasDC − 9). We calculated the VMCG with eqn 16.
VMCG =
Tyeng
1481Sref b( dCn
δRud
)δRud
660.8 (16)
We set the limit of all control surface deflections, δ, to be ± 30◦
. This allows for significant deflection
without creating linkage binding issues. The next two parameters regarding rudder performance combine
to form V MCA. The limitations for VMCA are that the rudder must have the performance at the airspeed
to counter the OEI condition, while not producing more than 5◦
of bank, per 14 CFR §25.139 Minimum
control speed. Thus, we have again coupled the rudder and aileron. However, as we found with the vertical
tail regarding lateral stability, the best performance was obtained with a short rudder with large area. This
reduced the amount of rolling moment that the ailerons would need to trim. This finalized the tail size as a
short tail that had enough area to meet the performance requirements. See table 7 for tail sizes and control
surface sizes. VMCA is the greatest of eqns 17 & 18.
22 of 31
American Institute of Aeronautics and Astronautics
23. VMCARudder =
Tyeng
1481Sref
( dCn
dβ )(
dCl
δAil
)δAil
dCl
dβ
+ ( dCn
δRud
)δRud
660.8 (17)
VMCABank =
−Wsin(5 deg)
1481(dCY
dβ β + dCY
δRud
δRud)
660.8 (18)
Due to the designed cruise of M 0.87 and the wing being designed to optimize this airspeed, there is a
significant need for flaps due to some of the target airports runway lengths. In order to obtain the shorter
landing distances needed, a CL of about 2.7 is needed. The only way produce this much lift is to have large
flaps. Because there are only a couple of short runways, we needed to make sure that we did not fixate on
such unique requirements. The solution we settled on was a single Fowler flap system, with five flap settings.
The settings are shown in table 6. The necessity to have such drastic flap settings would also produce
significant pitching moments. To analyze the impact of the flaps at various settings, we constructed another
VORLAX model, figure 35, that had flaps that could be partially or fully deployed and we could position
and rotate them appropriately. Slats were not modeled as they mostly allow for high angles of attack before
stalling the wing. Due to the models complexity already, it was deemed unnecessary as VORLAX does not
predict stall. The flaps were nearly the length of the trailing edge of the wing. The model had a space of
6 inches between the inboard portion of the first flap and the fuselage. Because the wing would need two
individual flaps due the trailing edge shape, there was an additional gap left between the two panels so as to
serve as spacing so that the flaps would not deploy into themselves. Additionally, the flaps did not extend
into the last portion of the wing, as it was not deemed necessary at this point in the performance analysis.
This also ensures there is no issues with flap and aileron interference and that the actuators would be distant
enough to as not cause any structural issues.
Setting Slats Flaps Angle(◦
) CLmax
Use
Flaps 0 No No 0 1.4 Cruise
Flaps 10 Partial Partial 10 1.9 Normal T/O
Flaps 20 Full Full 20 2.1 Short T/O and Crosswind Landing
Flaps 30 Full Full 30 2.5 Normal Landing
Flaps 40 Full Full 40 2.8 Short Landing
Table 6. Flap Settings
The analysis of the pitching moment due to the flaps being deployed was initially used to determine the
size of the elevator. We found that with a normal size elevator for the size of horizontal tail, we could trim
the pitching moment at flaps 40. This was completed with holding the elevator pitch limit to ± 30◦
. We
then analyzed the impact of ground effect at high flap settings, since the flaps are mostly used in relatively
close proximity to the ground. VORLAX allows for this analysis by adjusting the height above ground
control. The resulting impact of ground effect is shown in figures 36 & 37. Beginning around 50 ft above
ground, ground effect becomes apparent. The result is that the CL increases but the Cm pitching down
more. As shown in figure 38, Flaps 40 developed the most significant pitching moment. Since the larger
flap settings are only needed to facilitate landing, and installing a larger tail to house larger elevators for
such a limited portion of the flight decided to be a hindrance to drag, it was instead decided that we would
allow for the entire horizontal tail to be pitched. This would allow for increased flap settings without the
need for increasing the size of the tail. Often referred to as ”flying wings,” this is a common capability on
most airliners operated today. By pitching the horizontal tail -10◦
(trailing edge up), we were able to be in
trimmed flight with little to no elevator deflection. Figure 39 shows that with the horizontal tail trimmed,
Cm is trimmed at an α of about 3◦
. Since 3◦
is the slope of a standard approach, this would put the body
of the aircraft at 0◦
in reference to the ground. This also completely eliminates any issue with the elevator
deflection being close to their deflection limit. Additionally, with a horizontal tail capable of being trimmed,
the TC5 − 300 would be able to be trimmed during all phases of flight.
23 of 31
American Institute of Aeronautics and Astronautics
24. Figure 36. CL vs Altitude, Above Ground Level, ft Figure 37. Cm vs Altitude, Above Ground Level, ft
Figure 38. Flaps 40, Cm vs α Figure 39. Horizontal Tail Trimmed, Cm vs α
The elevator must also be sized so as to have enough effectiveness that the aircraft can be positioned for
a VMU departure. This calculation has a few things to consider. First, the aircraft does not rotate around
the CG during this maneuver, but instead is pitched about the main landing gear. Thus, the CG will create
a moment, resisting the pitching up by the elevator. However, if this distance is too small, then when the
aircraft pitches up, the CG will become aft of the main landing gear and the aircraft will not be able to
bring the nose back to the ground under control. VMU will drive the main landing gear location in reference
to the CG location, while guiding the final elevator size.
The rear most limit of the landing gear location is driven by the flaps and location of the trailing edge.
The flaps are 3 ft in chord and must be able to retract into the wing. Thus the landing gear must be
positioned at least 3 ft forward of the trailing edge of the wing. Utilizing Eq 19, we were able to determine
the distance between the main landing gear and the CG location.
VMU =
W
Sref
1481CLIGE
(19)
This showed us that with the length of the landing gear determined by engine size, that the CG needs
to be forward of the landing gear by 2.3 ft. This requires that the CG be at least 5.3 ft forward of the
trailing edge of the wing, at the span wise location of where the main landing gear will be mounted. Since
the main landing gear are 7 ft tall, they will need to be mounted approximately 7.5 ft from the buttline,
or 3 ft outboard of the fuselage in the wing. The trailing edge of the wing at this point is located at 66.7
ft from the nose and the CG is located at 60.2 ft. This means that we have the appropriate clearance to
safely perform a VMU take off. Eqn 20 was used to ensure that the elevator has enough authority to rotate
the aircraft about the main landing gear. Where FSMLG - FSMRP is the longitudinal distance between the
CG and the main landing gear.
Cmfullelevatorδ > (
W
Sref
1481( VMU
660.8 )2
− CLIGE)
FSMLG − FSMRP
¯c
(20)
Approach and departure performance are shown in the figures 40 & 41, respectively.
24 of 31
American Institute of Aeronautics and Astronautics
25. Figure 40. Approach
Figure 41. Departure
Due to the relationship between AR, sweep and stall characteristics, this airplane will require a stick
shaker. This is a function that is solved by EDET and is a component of the output file. The stick shaker
will alert the pilot that stall is eminent and that corrective action is required. If the pilot does not initiate the
corrective action and the situation continues to deteriorate, the stick shaker will jerk forward, and initiate
the corrective action. This is a common computer flight control found in most commercial airliners. It can
be shown that most modern airliners are unstable in stall but are able to mitigate this issue through the
application of a stick shaker.
The final tail, flaps, and control surface sizes are shown below in the table 7.
Horizontal Tail Area 134.67 ft2
Vertical Tail Area 52.09 ft2
Elevator Area 60.46 ft2
Aileron Area (each) 12.00 ft2
Full Flaps Area 77.10 ft2
Table 7. Tail, Flaps, and Control Surface Sizes
E. Landing Gear
There are a number of regulations that drive the design of the landing gear. The most important one
in designing the structure of the landing gear was 14 CFR §25.483, which states that each of the main
gear must be able to support the entire weight of the aircraft at MLW under a 3 gee load factor, with the
additional 1.5 factor of safety applied for material strengths. Once the wing and engines were designed and
geometrically placed on the frame of the aircraft the landing gear was designed. Based on the wing and
fuselage height, and engine diameter required, the main landing gear was required to be a minimum of 6 ft.
An EXCEL spreadsheet was developed to calculate the strength of the landing gear under the loads de-
scribed above. In this spreadsheet the outer radius, inner radius, thickness, radius of gyration, cross sectional
area, weight, compression force, and buckling force were calculated. All material properties were obtained
from MIL HDBK-55
. Eq. 21 through Eq. 26 describe the equations used in the EXCEL spreadsheet.
Thickness = Ro − Ri (21)
Rg = 0.5
R4
o − (Ro − Thickness)4
R2
o − (Ro − Thickness)2
(22)
AStrut = πR2
o − πR2
i (23)
Wstrut = AstrutLstrutρm (24)
25 of 31
American Institute of Aeronautics and Astronautics
26. Fcom = AstrutFCYmd (25)
Fb =
(cπ2
EmAstrut)1.5
(Lstrut
Rg
)2
(26)
Once all of these properties were built up in the EXCEL spreadsheet, the minimal Ri could be calculated.
Then a trade study was conducted between a few materials. The final material decided upon was 4130 Steel.
Once the material was decided on, the geometry of the landing gear was then varied until an optimal
configuration yielded the proper amount of strength as well as the lowest weight.
Lstrut 6.00 ft
Ro 8.00 in
Strut Thickness 0.23 in
Landing Gear Volume 81.81 ft3
Table 8. Landing Gear Dimensions
Table 8 displays the final design landing gear dimensions. The
Volume of the landing gear was calculated using the length of the
strut and the tires attached with some clearances on all sides to
ensure no jamming and to diminish difficulties in retracting or de-
ploying the landing gear. The final landing gear design is a standard
”double bogie” per strut located in a standard tricycle configuration.
The tires were selected by using a Goodyear chart and finding a
tire that would be comply with 14 CFR §25.733. The tire selected
was the 30x11.5 − 14.5 tire to be used on all three landing struts.
IV. Performance
The performance of the TC5-300 was determined through the use of the Mission Code. This code
was linked in sync with EDET through Model Center. This allowed for the Mission Code inputs to be
autonomously altered. Additionally, the engine parameters were allowed to be altered as well. This included
the thrust value and as well as the BPR of the engine. This allowed for the entire design space to be explored.
The use of the mission code allowed for the EDET and engine parameters to be optimized. Through analysis
of the outputs, the designers were able to hone the design of the aircraft. This is best visualized through
the use of sky maps. The sky maps allow for the performance of the airplane to be analyzed graphically,
and visually determine where the optimal performance lies for that particular design. Specific Range, figure
42, shows what combination of Mach and altitude will allow for the least fuel consumption. An important
parameter, so as to be able to meet the mission requirements. The largest specific range is obtained at
around M 0.83 and an altitude of 43,000 ft. Though this provides the best specific range, due to the short
500 nm flight for the qualifying fuel consumption parameter, the designers found that by reducing the altitude
slightly and increasing speed to M 0.87, the overall performance improved. This is due to the amount of
time spent in climb versus the time spent efficiently cruising. By slightly reducing the cruise altitude for the
short range flight from 41,000 ft down to 39,000 ft, the fuel burn per seat was able to be improved upon to
its current 31.4 lbm.
Figure 42. Skymap: Specific Range at Cruise
26 of 31
American Institute of Aeronautics and Astronautics
27. Additionally, it is required that an airplane have climb performance at cruising altitude. The designers
decided on needing a minimum of 500 feet per min remaining climb capability. Figure 43 shows that the
remaining climb at M 0.87 and 39,000 ft is under the decided 500 feet per min limit. However, if the aircraft
is slowed down, by pitching the airplane up, then the there is sufficient climb performance. The ability to
climb at max cruise speed was not a design consideration or requirement. Thus, the aircraft will have the
climb performance required as it slows due to the climb orientation of the aircraft.
Figure 43. Skymap: Mach Rate of Climb at Cruise
The flight profile for the 500 NM flight is shown in figures 44 & 45. The distance the airplane is operating
at cruise conditions is short for this short range flight. The average flight for Germanwings is 630 NM, and
so the design is actually optimized for a slightly longer range flight than the test criteria of 500 NM. This
is shown flying with 15,000 lbm of payload. The Mach is closely related to the altitude plot and shows the
cruise capability at Mach less than the designed cruise.
Figure 44. 500nmi Mission Profile, Altitude vs. Distance
27 of 31
American Institute of Aeronautics and Astronautics
28. Figure 45. 500nmi Mission Profile, Mach vs. Distance
The max range mission is flying from Cologne, Germany to Antalya, Turkey. This is a 1640 NM flight,
which will require enough reserves for a 45 min hold. Figure 46 shows the flight profile of this flight. The
aircraft was able to complete this flight with a payload of 21,560 lbm. This is in excess of the 20,000 lbm
requirement for the max range mission.
Figure 46. Max Range Mission, Altitude vs. Distance
The flight is simulated as a full flight with a balked landing that then flew for 45 min at an altitude of
5,000 ft. This is seen in the mission profile as a second climb and leveling off at 5,000 ft. To determine the
appropriate holding time, figure 47 shows that the hold was in excess of 2,700 sec (45 min).
28 of 31
American Institute of Aeronautics and Astronautics
29. Figure 47. Max Range Mission, Time vs. Distance
The aircaft weights for the TC5-300 are shown in table 9.
OEW 53,811 lbm
MZFW 75,246 lbm
MLW 85,000 lbm
MTOW 89,830 lbm
Table 9. Aircraft Weights
V. Conclusion
The rigorous study that led to the design of the TC5 − 300, thoroughly demonstrates the aerodynamic
and economic feasibility of this airplane. The purpose of the design was to consume less than 36 lbm
of fuel per passenger, on a 500 NM flight, with a payload of 15,000 lbm. The TC5 − 300 is capable of
performing such a flight, while only consuming 31.4 lbm per seat. This is an improvement of 12.8% over
the economic requirements. The aerodynamics of the wing are well supported through thorough analysis
of CP distributions across the entirety of the wing. The effect of wing mounted engines is documented,
however, the negatives of the mounting position were outweighed by the reduced maintenance costs for our
customers. The TC5 − 300 is proven to be stable in all applicable flight scenarios. Appropriate flap settings
were developed and the resulting pitching moment was mitigated through the use of a trimming horizontal
tail.
The authors chose to limit their design in order to limit the costs passed on to the customers. Certain
design considerations were abandoned when it was determined they would result in large maintenance costs.
The design of the TC5−300, is classical and to the untrained eye, this airplane will appear very similar to its
market competitors. On paper, the TC5−300 has been proven to significantly out perform the competition.
The efficiency of the fuel burn per seat was set at a speed of M 0.87. The fastest competitor cruises at M
0.78. This makes the TC5 − 300 over 10% faster than the competition. This leads to reduced flight times
and allows for a single aircraft to make more flights per day.
The authors were guided by many historical aircraft during the project. The Handley − Page V ictor
was the first and only airplane to operate with a crescent wing. The V ickers V C − 10 was a high speed
airliner that was able to operate out of very short runways and helped guide the flap design. The Lockheed
L1011 with its lumpy twisted wings demonstrated what can be accomplished when there are sufficient control
points in your wing design. And finally, the Douglas DC − 8, a unique airliner that guided the design of
the tail. The DC − 8 had a very large rudder, occupying nearly the same area as the fixed vertical tail. The
aircraft that helped guide this design were all very efficient at high Mach numbers, so it is no surprise that
the TC5 − 300 also has a high cruise speed.
29 of 31
American Institute of Aeronautics and Astronautics
30. References
1Abbott, I., and Von Doenhoff, A., Theory of wing sections, New York: Dover Publications, 1959.
2Adg.stanford.edu, ’Engine Placement’ Available: http://adg.stanford.edu/aa241/propulsion/engineplacement.html.
3Anderson, J. (2003). Modern Compressible Flow 3rd Edition. New York: McGraw-Hill. Sections 7.1, 7.2, 7.8.
4Departments and Agencies of the Department of Defense, Military Specification: Flying Qualities of Piloted Airplanes,
1980.
5Department of Defense, Metallic Materials and Elements for Aerospace Vehicle Structures, 2003.
6Feagin, R., and Morrison, Jr., W., Delta Method, An Empirical Drag Buildup Technique, 1978.
7Kuchemann, D., The aerodynamic design of aircraft, Reston, Va: AIAA, American Inst. of Aeronautics and Astronautics,
2012.
8Miranda, L., Elliot, R., and Baker, W., A Generalized Vortex Lattice Method for Subsonic and Supersonic Flow Applica-
tions, Burbank, Ca: NASA, 1977.
9National Aeronautics and Space Administration, U.S. Standard Atmosphere, 1976, NASA-TM-X-74335, 1976
10NPSS, Numerical Propulsion System Simulation, Software Package, Ver. 2.3.0.1, Ohio Aerospace Institute, Cleveland,
OH, 2010.
11Neumark, S., ’Critical Mach Numbers for Thin Untapered Swept Wings at Zero Incidence’, Aeronautical Research Council
Reports and Memoranda, 1949.
12Niu, M., Airframe structural design, Hong Kong: Conmilit, 1999.
13Pearcey, H., and Osborne, J., ’Some Problems and Features of Transonic Aerodynamics’, AIAA Prof. Study Series:
Transonic Aerodynamics, vol. ICAS 70-14, 1970, 1970.
14Roskam, J., Airplane design, Part 5: Component weight estimation, DARcorporation, 1999.
15Takahashi, T., Aircraft Performance and Sizing, 2015
16Torenbeek, E., Synthesis of Subsonic Airplane Design, Delft University Press, Delft, Holland, 1982.
17Title 14 CFR § 25, Airworthiness Standards: Transport Category Airplanes, 2015
18Title 14 CFR § 33, Airworthiness Standards: Aircraft Engines, 2015
19Title 14 CFR § 36, Noise Standards: Aircraft Type and Airworthiness Certification, 2015
20Title 14 CFR § 91, General Operating and Flight Rules, 2015
21Title 14 CFR § 121, Operating Requirements: Domestic, Flag, and Supplemental Operations, 2015
Appendix A: Regulatory Requirements
A. Rotor Burst Waiver
Due to the planned cruise altitude of the TC5 − 300 exceeding 40,000 ft, failure of the cabin pressure
vessel due to catastrophic failure of the engine must be planned for. In accordance with §25.841, the pressure
altitude inside of the cabin cannot exceed 40,000 ft, for any amount of time, and the pressure altitude may
not exceed 25,000 ft for more than 2 minutes. Due to the catastrophic nature of a rotor burst event, a waiver
will be applied for regarding the 40,000 ft limit. This is not a unique waiver, as this has been granted by the
FAA on numerous occasions. The Boeing 787 and the Airbus A380 are both certified to operate at 43,000
ft. The FAA has granted their waiver and required that the 25,000 ft pressure altitude not be exceeded for
more than 3 minutes but also increased the pressure altitude of 40,000 ft time limit to 1 min. The authors
believe that there is nothing in their design that would limit the FAA from granting a cruising altitude limit
of 42,000 ft for the TC5−300. The ideal cruise altitude for the TC5−300 is 41,000 ft, less than the altitude
already being authorized by the FAA.
B. Applicable CFR Regulations
The TC5 − 300 will be certified under the transport aircraft category requirements of 14 CFR §25. The
conceptual design meets the following primary certification requirements:
30 of 31
American Institute of Aeronautics and Astronautics
31. Description Part
Subpart B - Flight
Stall Speed §25.103
Takeoff §25.105
Takeoff Speeds §25.107
Takeoff Distance and Run §25.113
Climb - General §25.117
Climb - One Engine Inop. §25.121
Minimum Control Speed §25.149
Static Lateral-Directional Stability §25.177
Subpart C - Structure
Loads §25.301
Factor of Safety §25.303
Flight Loads §25.321
Symmetric Maneuvering Conditions §25.331
Flight Maneuvering Envelope §25.333
Design Airspeeds §25.335
Limit Maneuvering Load Factors §25.337
Design Fuel and Oil Loads §25.343
High Lift Devices §25.345
Yaw Maneuvering Conditions §25.351
Pressurized Compartment Loads §25.365
One Gear Landing Condition §25.483
Braked Roll Conditions §25.493
Nose Wheel Yaw and Steering §25.499
Subpart D - Design and Construction
Wheels §25.731
Tires §25.733
Brakes and Braking System §25.735
Pilot Compartment §25.771
Fuselage Doors §25.783
Stowage Compartments §25.787
Emergency Exits §25.807
Emergency Exit Arrangement §25.809
Aisle Width §25.815
Number of Seats Abreast §25.817
Lavatory Doors §25.820
Subpart E - Powerplant
Engines §25.903
Fuel Flow §25.955
Fuel Tanks §25.963
Subpart G - Operating Limitations and Information
Airspeed Limitations §25.1503
Maximum Operating Limit Speeds §25.1505
31 of 31
American Institute of Aeronautics and Astronautics