Downloaded 318 times

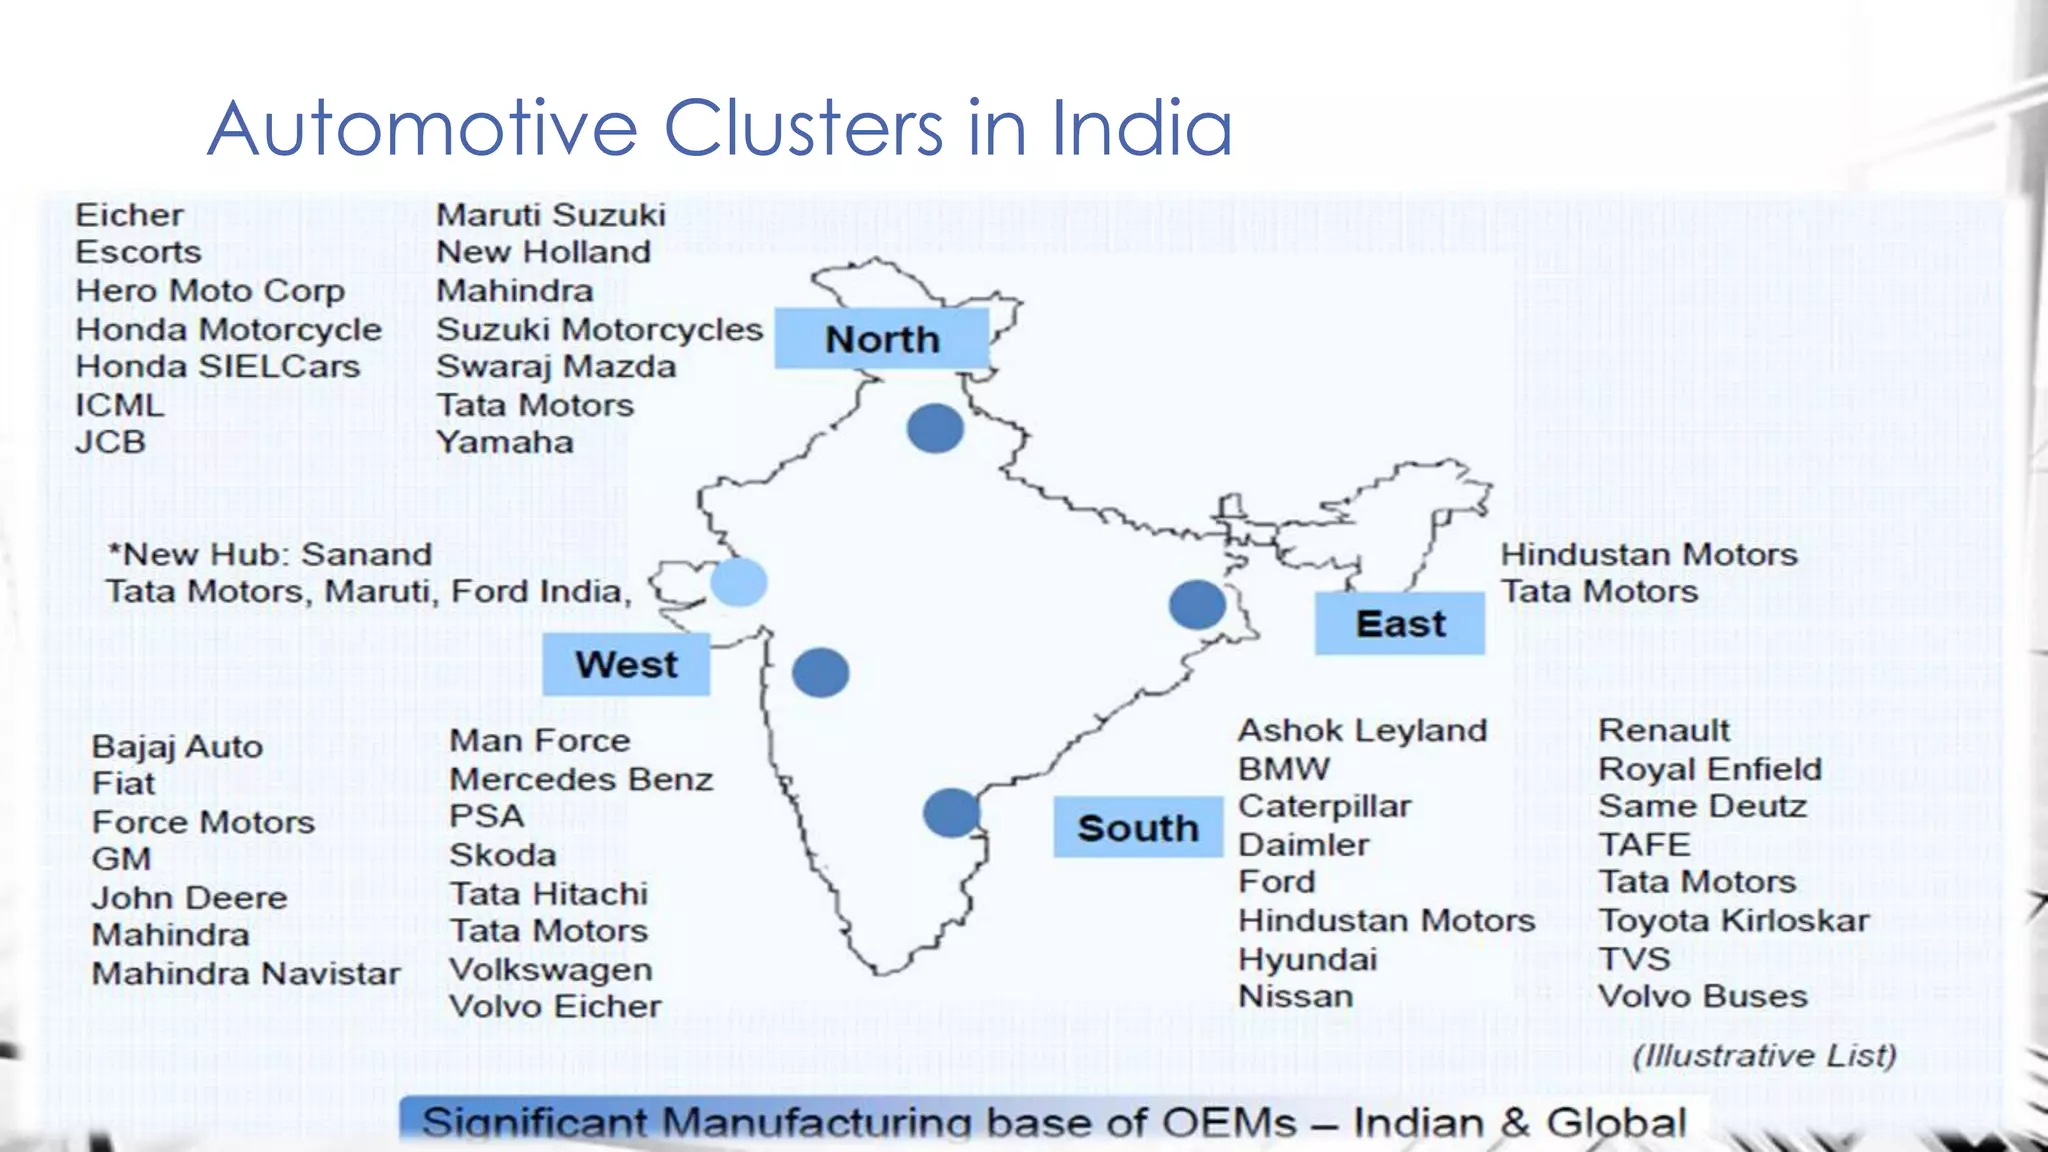


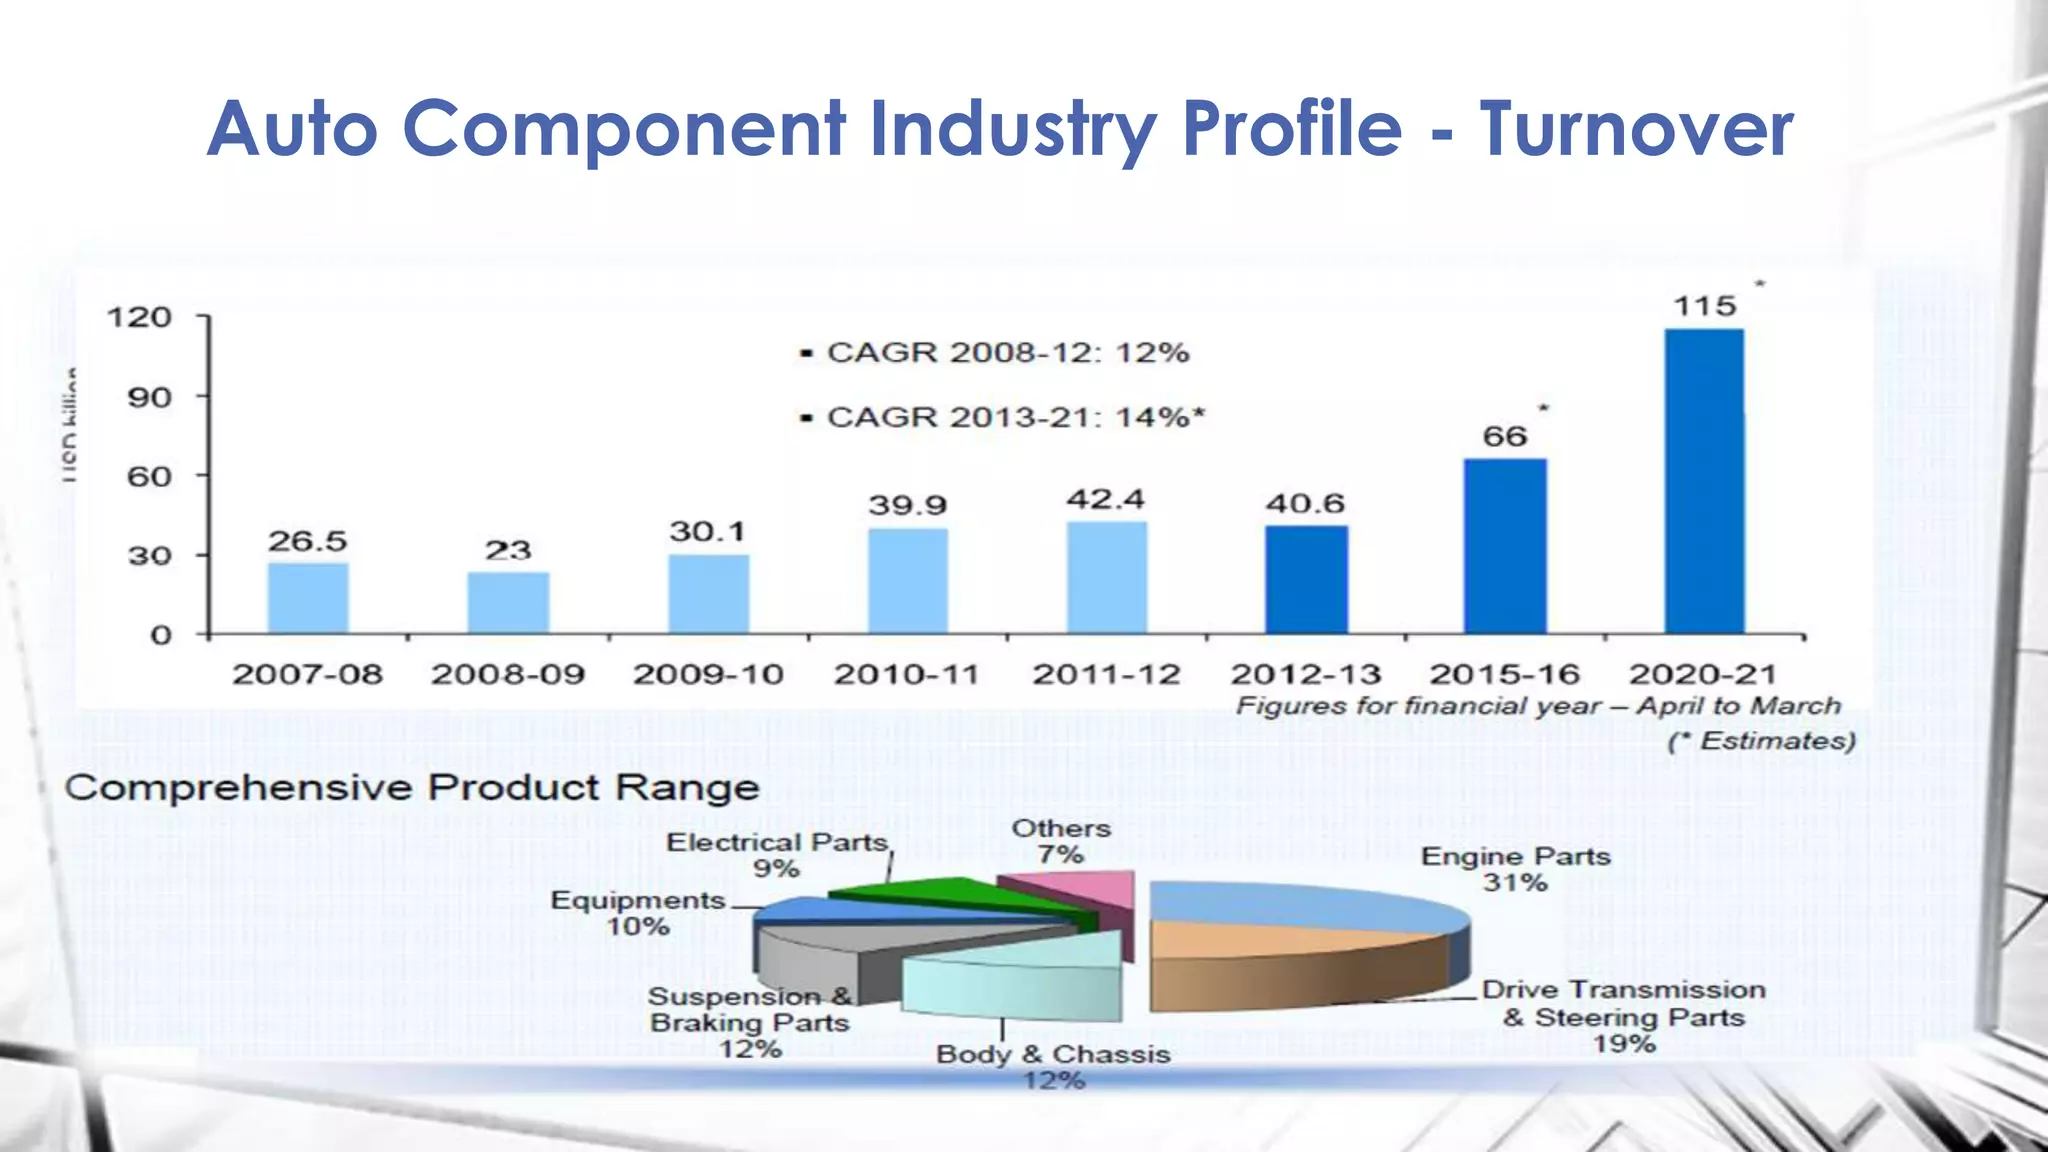

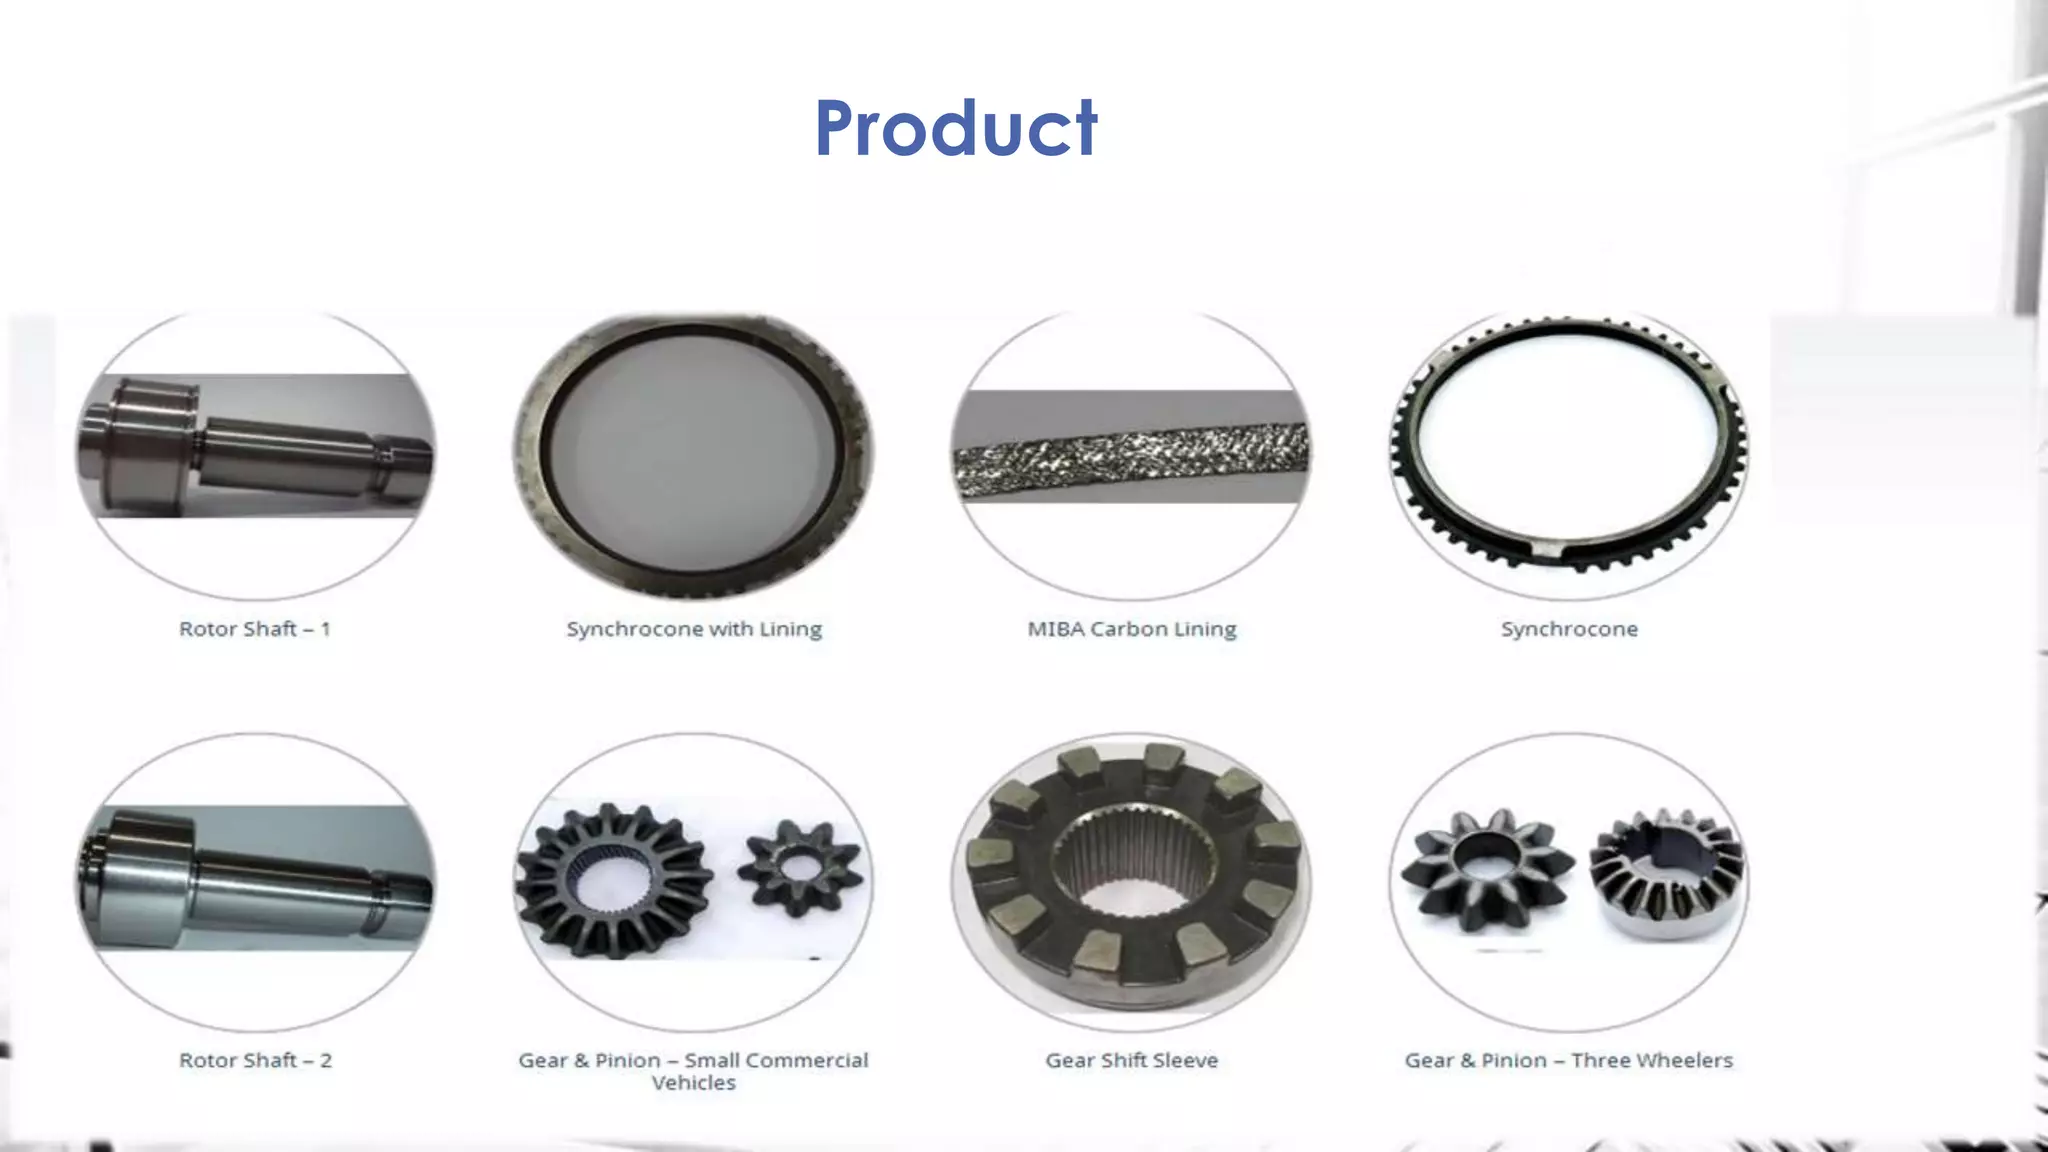


The document discusses the automotive industry in India including automotive clusters, the presence of global OEMs, passenger and other vehicle production, the auto component industry profile and turnover. It also mentions the favorable policy regime for the industry. It provides information on IP Rings, a company that manufactures piston rings and precision forged transmissions. It includes details on the company's products, collaborations, shareholding pattern and competitors. It also contains SWOT analyses for the automotive industry and IP Rings.


