Temple, Texas: 2015 State of the Economy
•Download as PPTX, PDF•
2 likes•2,183 views

Brian Kelsey's presentation at the Temple Economic Development Corporation's 2015 Industry Appreciation Luncheon

Recommended
Recommended
More Related Content
What's hot
What's hot (20)
Similar to Temple, Texas: 2015 State of the Economy
Similar to Temple, Texas: 2015 State of the Economy (20)
More from Civic Analytics LLC
More from Civic Analytics LLC (16)
Recently uploaded
Recently uploaded (20)
Temple, Texas: 2015 State of the Economy
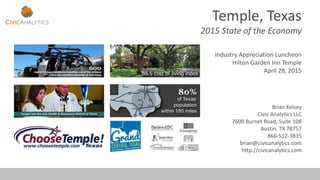
- 1. Temple, Texas 2015 State of the Economy Industry Appreciation Luncheon Hilton Garden Inn Temple April 28, 2015 Brian Kelsey Civic Analytics LLC 7600 Burnet Road, Suite 108 Austin, TX 78757 866-512-3835 brian@civicanalytics.com http://civicanalytics.com
- 2. 2 • Current performance—what does secondary data say on state of Temple economy? • What does baseline forecast suggest for next few years? • Work plan—what potential opportunities stand out? Presentation Overview
- 3. 3 Temple is 35th fastest growing city in Texas 2012 2013 Change Growth Killeen 135,015 137,147 2,132 1.6% Temple 69,264 70,190 926 1.3% Waco 127,771 129,030 1,259 1.0% Belton 19,399 19,572 173 0.9% Cameron 5,425 5,428 3 0.1% McGregor 5,049 5,051 2 0.0% Texas 26,060,796 26,448,193 387,397 1.5% Temple was the 47th largest city in Texas in 2013, unchanged from the previous year. Temple was the 35th fastest growing city in Texas in 2013 (%), on pace with Dallas and Denton in % terms. Source: U.S. Census Bureau, Population Estimates, July 2013.
- 4. 4 Temple sales tax base is growing faster (%) than most of region—up $73M in 2009-13 2009* 2013 Change Growth Belton $187,980,423 $226,393,405 $38,412,982 20% Temple $839,275,082 $912,544,820 $73,269,738 9% Waco $1,542,969,638 $1,662,762,300 $119,792,662 8% Cameron $33,926,569 $36,253,361 $2,326,792 7% Killeen $1,091,829,915 $1,050,068,721 -$41,761,194 -4% McGregor N/A N/A N/A N/A Total $3,695,981,627 $3,888,022,607 $192,040,980 5% Source: Texas Comptroller. * 2009 figures adjusted for inflation (2013 dollars). Includes only amounts subject to state sales tax. Taxable sales are approximately 20% of gross sales in Temple. Data for McGregor not available (N/A).
- 5. 5 Temple 2013 09-13 Retail Trade $568,224,152 9% Accomm/Food $134,803,154 9% Wholesale Trade $45,356,174 -3% Manufacturing $35,348,163 33% Admin/Supp/Waste $24,406,237 39% Construction $19,276,173 14% Real Estate $14,104,154 -13% Source: Texas Comptroller. 2009-13 growth rate is adjusted for inflation (2013 dollars). Includes only amounts subject to state sales tax. Transportation and Warehousing started from a very small base in 2009 (real growth rate was nearly 1,800%). Temple 2013 09-13 Information $13,689,902 -1% Prof/Sci/Tech Svcs $11,282,614 4% Health Care $7,289,866 3% Finance/Insurance $4,358,142 28% Transp/Warehouse $4,259,387 ** Arts/Ent/Recreation $4,033,018 62% Education $540,668 -17% Taxable sales growth by industry in Temple
- 6. 6 Temple area population is expected to grow by 6% between 2015 and 2020. Forecast for age cohorts in Temple area: Children (up to 19) 6% Early Career (20-34) -1% Mid Career (35-54) 4% Late Career (55-69) 11% Older Adults (70+) 15% 58% of estimated population growth in 2015-20 will be in age 55+ cohort. Source: EMSI. Figures are for the region defined by the following ZIP codes: 76501, 76502, 76503, 76504, 76505, 76508. Temple area population growth expected to average 1.2% per year during 2015-20
- 7. 7 Baseline employment growth in Temple area expected to average 1.3% per year 2015-20 Temple area employment is projected to increase from 58,776 jobs to 62,617 jobs in 2015-2020 (7%), slightly trailing Texas (9%) but ahead of U.S. forecast (5%). 43% of job growth in Temple area during 2015-20 is expected to be in health care and social assistance industries. (58% of estimated population growth in 2015-20 will be in age 55+ cohort.) Government is largest share of jobs in Temple region (36%)—provides stable foundation for labor market that adds resiliency during down cycles. Source: EMSI. Includes self-employment. Figures are for the region defined by the following ZIP codes: 76501, 76502, 76503, 76504, 76505, 76508.
- 8. 8 312 713 520 518 477 470 447 426 567 627 571 2003 2004 2005 2006 2007 2008 2009 2010 2011 2012 2013 Residential Building Permits Reported in Temple Total # of Privately-Owned UnitsEstimated 94 new units permitted YTD through February, roughly on pace with 2014. Average home price in 2014 in Temple-Belton MLS area was $151,300, up 4% from 2013. Killeen-Fort Hood $140,900 Waco $149,900 Temple-Belton MLS area is most affordable submarket in region based on comparison of home price to family income. Source: U.S. Census Bureau, Texas A&M Real Estate Center, U.S. Department of Housing and Urban Development, Local Realtor Boards. Affordability is determined by calculating the ratio of median family income to the income required to qualify for an 80 percent, fixed-rate mortgage to purchase the median-priced home. Housing: Stable, Predictable, Affordable
- 9. 9 Killeen-Temple MSA Economic Summary • $20.6 billion economy (2013), up 5.2% from previous year* • 193,672 total employment (2014), up 1.1% from previous year • 2015 forecast: 1.9% job growth; 1.3% population growth • Federal government accounts directly for 47% of GDP Source: EMSI, U.S. Census Bureau, Population Estimates. Killeen-Temple MSA includes Bell, Coryell, and Lampasas counties. * Estimated gross domestic product, not adjusted for inflation. Population: 424,858 (July 2014)
- 10. 10 Expanding Scope of Targeted Industries (Exporting) Source: U.S. Cluster Mapping Project, Institute for Strategy and Competitiveness, Harvard Business School, 2012. Clusters listed here are considered “strong clusters.” A strong cluster is a cluster that has high employment specialization in a region (ranking in the top 25% of all regions by specialization and also meeting minimum criteria for employment and establishment). How can these be integrated into Temple’s economic development brand? Killeen-Temple MSA
- 11. 11 • Temple’s steady, predictable growth is attractive business environment. • Government & health care provide stability but diversification efforts should be prioritized & marketed. • Cluster data suggests that Temple’s economic development story may need a few more chapters. Summary Impressions
- 12. 12
- 13. 13 Workforce is now #1 site selection factor Source: Area Development Online.
- 14. 14 • Complete a cluster analysis for Grand Central Texas to reflect assets of new geography. • Evaluate need for workforce gap analysis—is region equipped w/ education & training capacity to meet future workforce needs? • Investigate projected drop in early career population. Work Plan Considerations • Maintain focus on career readiness & skill development. • Diversification
- 15. 7600 Burnet Road, Suite 108 Austin, Texas 78757 @civicanalytics http://civicanalytics.com