SlideShare a Scribd company logo
1 of 12
Download to read offline
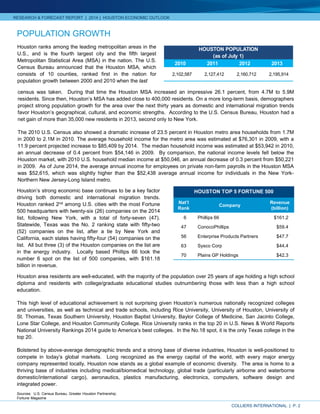
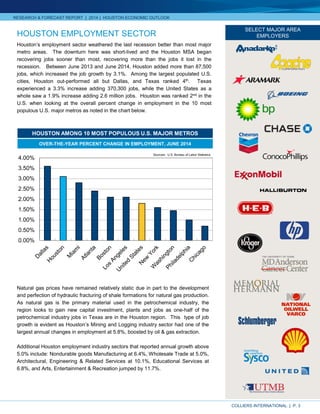
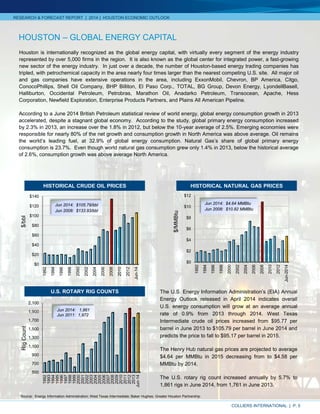
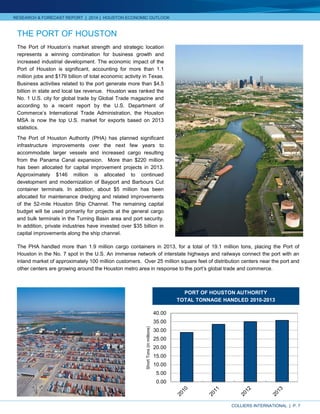
Houston Ranked in TOP 10 
“Best Cities for Job Growth” HOUSTON MSA EMPLOYMENT 
EXEC U T I V E S U M M A RY 
JOBS GAINED 
2013 82,000 
2012 97,700 
2011 75,800 
HOUSTON UNEMPLOYMENT 
PERCENT (%) 
04/2014 4.6 
04/2013 5.9 
04/2012 6.6 
HOUSTON MSA POPULATION 
IN MILLIONS GROWTH (%) 
2014 6.4 2.2 
2013 6.3 2.0 
2012 6.2 2.3 
ENERGY: OIL & NATURAL GAS 
WTI CRUDE OIL: PER BARREL 
06/2014 $105.09 
06/2013 $95.82 
06/2012 $84.10 
06/2011 $105.93 
NATURAL GAS: PER MMBtu 
06/2014 $4.61 
06/2013 $3.94 
06/2012 $2.37 
06/2011 $4.65 
IMPORT / EXPORT TRADE 
HAS AIR FREIGHT: IN MILLION LBS. 
2013 914.2 
2012 924.2 
2011 934.2 
2010 882.5 
PHA TOTAL TONNAGE (short tons): IN MILLION TONS 
2013 35.8 
2012 35.1 
2011 33.5 
2010 28.8 
Houston ranked among the top-performing U.S. metros in 2013 and continues to 
be among the top 10 metros leading the nation in population and job growth 
in 2014. Houston is once again making headlines as having one of the healthiest 
economies in the U.S. In July 2014, Forbes published its list of “Best Cities 
for Job Growth”, and Houston was in the top 10. Further, Texas dominated the 
top 10 with ve metros, which are expected to have annual job growth of at 
least 3.5% in 2014. 
As expected, a large majority of the jobs Houston gained are related to the energy 
sector; however, Houston is also a top 10 city for STEM occupations, jobs 
requiring a degree in science, technology, engineering and math related subjects. 
In June 2014, Forbes ranked Houston in the top 10 for companies with the 
greatest number of STEM positions currently open with 10,278 
positions listed. Houston also made Forbes’ list of 
“The Top 10 Cities For Relocation”, with the 
highest gains in 
Engineering and 
Operations jobs. 
HOUSTON 
SAN 
JACINTO 
MONTGOMERY 
HARRIS 
WALLER 
AUSTIN 
LIBERTY 
CHAMBERS 
FORT BEND 
BRAZORIA 
GALVESTON 
HOUSTON, TEXAS 
METRO AREA DETAIL 
Houston’s economic base is comprised of a variety of industries led by the energy 
sector, which accounts for just over 50 percent of Houston’s employment. 
Houston is known as the “Energy Capital of the World”, and is home to more than 
5,000 energy related companies. It’s no surprise that Texas is the #1 ranked 
U.S. state by the U.S. Energy Information Administration (EIA) in total energy 
production, and the production of crude oil, natural gas, and electricity production. 
Texas ranks 6th in coal production. Texas is home to several shale plays and 
one of those is the Eagle Ford, which produces more than 1 million barrels of oil 
equivalent per day, or 7 billion cubic feet equivalent per day and that production 
level has helped to increase local employment in the industry. 
Houston’s strategic location and core strengths, including an expanding energy 
sector, strong import/export trade activity, cutting-edge medical advancements, 
and technological breakthroughs across industries, uniquely position it to play 
a vital role in meeting national and global market demands. At a time of 
unprecedented geopolitical demographic shifts aecting markets worldwide, 
Houston stands as a leader among U.S. metros.
HOUSTON ECONOMIC OUTLOOK PAGE 2 
Population Growth 
HOUSTO N P O P U L AT I O N 
AS OF JULY 1 
2013 2,195,914 
2012 2,160,712 
2011 2,127,412 
2010 2,102,587 
Houston ranks among the leading metropolitan areas in the U.S., and is the fourth largest city and the fth largest Metropolitan 
Statistical Area (MSA) in the nation. The U.S. Census Bureau announced that the Houston MSA, which consists of 10 counties, ranked 
rst in the nation for population growth between 2000 and 2010 when the last census was taken. During that time the Houston 
MSA increased an impressive 26.1 percent, from 4.7M to 5.9M residents. Since then, Houston’s MSA has added close to 400,000 
residents. On a more long-term basis, demographers project strong population growth for the area over the next thirty years as 
domestic and international migration trends favor Houston’s geographical, cultural, and economic strengths. According to the U.S. 
Census Bureau, Houston had a net gain of more than 35,000 new residents in 2013, second only to New York. 
The 2010 U.S. Census also showed a dramatic increase of 23.5 percent in Houston metro area households from 1.7M in 2000 to 2.1M 
in 2010. The average household income for the metro area was estimated at $76,301 in 2009, with a 11.9 percent projected 
increase to $85,409 by 2014. The median household income was estimated at $53,942 in 2010, an annual decrease of 0.4 percent 
from $54,146 in 2009. By comparison, the national income levels fell below the Houston market, with 2010 U.S. household 
median income at $50,046, an annual decrease of 0.3 percent from $50,221 in 2009. As of June 2014, the average annual income 
for employees on private non-farm payrolls in the Houston MSA was $52,615, which was slightly higher than the $52,438 average 
annual income for individuals in the New York-Northern New Jersey-Long Island metro. 
HOUSTO N TOP 5 F O RT U N E 5 0 0 
NATIONAL RANK COMPANY REVENUE 
in millions 
6 PHILLIPS 66 $161.2 
47 CONOCO PHILLIPS $59.4 
56 ENTERPRISE PRODUCTS PARTNERS $47.7 
63 SYSCO CORP $44.4 
70 PLAINS GP HOLDINGS $42.3 
Houston ranked 2nd among 
U.S. cities with the most 
Fortune 500 headquarters 
with twenty-six companies 
on the 2014 list. 
Houston’s strong economic base continues to be a key factor driving both domestic and international migration trends. Houston 
ranked 2nd among U.S. cities with the most Fortune 500 headquarters with twenty-six (26) companies on the 2014 list, following 
New York, with a total of forty-seven (47). Statewide, Texas was the No. 2 ranking state with fty-two (52) companies on the 
list, after a tie by New York and California, each states having fty-four (54) companies on the list. All but three (3) of the Houston 
companies on the list are in the energy industry. Locally based Phillips 66 took the number 6 spot on the list of 500 companies, 
with $161.18 billion in revenue. 
Houston area residents are well-educated, with the majority of the population over 25 years of age holding a high school diploma 
and residents with college/graduate educational studies outnumbering those with less than a high school education. 
This high level of educational achievement is not surprising given Houston’s numerous nationally recognized colleges and universities, 
as well as technical and trade schools, including Rice University, University of Houston, University of St. Thomas, Texas Southern 
University, Houston Baptist University, Baylor College of Medicine, San Jacinto College, Lone Star College, and Houston Community 
College. Rice University ranks in the top 20 in U.S. News  World Reports National University Rankings 2014 guide to America’s 
best colleges. In the No.18 spot, it is the only Texas college in the top 20. 
Bolstered by above-average demographic trends and a strong base of diverse industries, Houston is well-positioned to compete in 
today’s global markets. Long recognized as the energy capital of the world, with every major energy company represented 
locally, Houston now stands as a global example of economic diversity. The area is home to a thriving base of industries including 
medical/biomedical technology, global trade (particularly airborne and waterborne domestic/international cargo), aeronautics, 
plastics manufacturing, electronics, computers, software design and integrated power. 
SOURCES: : U.S. Census Bureau, Greater Houston Partnership; Fortune Magazine
HOUSTON ECONOMIC OUTLOOK 
Employment Sector 
S E L EC T M A J O R A R E A EMPLOYERS 
PAGE 3 
Houston’s employment sector weathered the last recession better than most major metro areas. The downturn here was short-lived 
and the Houston MSA began recovering jobs sooner than most, recovering more than the jobs it lost in the recession. Between 
June 2013 and June 2014, Houston added more than 87,500 jobs, which increased the job growth by 3.1%. Among the largest populated 
U.S. cities, Houston out-performed all but Dallas, and Texas ranked 4th. Texas experienced a 3.3% increase adding 370,300 
jobs, while the United States as a whole saw a 1.9% increase adding 2.6 million jobs. Houston was ranked 2nd in the U.S. when 
looking at the overall percent change in employment in the 10 most populous U.S. major metros as noted in the chart below. 
Natural gas prices have remained relatively static due in part to the development and perfection of hydraulic fracturing of shale 
formations for natural gas production. As natural gas is the primary material used in the petrochemical industry, the region looks to 
gain new capital investment, plants and jobs as one-half of the petrochemical industry jobs in Texas are in the Houston region. 
This type of job growth is evident as Houston’s Mining and Logging industry sector had one of the largest annual changes in employment 
at 5.8%, boosted by oil  gas extraction. 
Additional Houston employment industry sectors that reported annual growth above 5.0% include: Nondurable goods Manufacturing 
at 6.4%, Wholesale Trade at 5.0%, Architectural, Engineering  Related Services at 10.1%, Educational Services at 6.8%, and 
Arts, Entertainment  Recreation jumped by 11.7% 
Houston was ranked 2nd in 
the U.S. when looking at 
the overall percent change 
in employment in the 10 
most populous major metros. 
PE RC E N T C H A N G E I N E M P LOYMENT 
JUNE 2013 TO JUNE 2014 
4.0% 
3.5% 
3.0% 
2.5% 
2.0% 
1.5% 
1.0% 
0.5% 
0.0% 
DALLAS 
HOUSTON 
MIAMI 
ATLANTA 
BOSTON 
LOS ANGELES 
UNITED STATES 
NEW YORK 
WASHINGTON 
PHILIDELPHIA 
CHICAGO 
SOURCES: U.S. Bureau of Labor Statistics
HOUSTON ECONOMIC OUTLOOK 
PAGE 4 
Strong Business Climate 
Houston has long been recognized among the most competitive U.S. cities for corporate relocation and expansion activity. In its 
March 2014 issue, Site Selection ranked Houston #2 for Tier One New and Expanded Facilities in 2013 of MSA’s with population over 
1 million, securing 325 corporate facility expansion projects. Houston was last years winner. In addition, Chief Executive Magazine 
(for the tenth straight year) named Texas as the “Best State for Business”, in which Houston’s Energy Industry played a huge part. In 
Summer 2014, Forbes named Houston #1 for “Most Competitive Metro in America” and “Best City for Manufacturing”. In addition 
to its diverse growth industries and educated/skilled workforce, a key factor underscoring Houston’s business appeal is the fact that 
it is one of the least expensive major U.S. cities in which to conduct business. Signi“cant bene“ts include the absence of state or 
city income taxes, no state property tax, as well l as an exceptionally low cost of livin 
living index. 
HOUSTO N - 
S U G A R L A N D - 
B AY TOW 
N MSA M S A 2 0 1 3 
W 
BIL 
GR 
GROSS AREA PRODUCT $480.6 BILLION 
LLIO 
As a major transportation hub with two major airports, a world-renowned port, and superior rail and road infrastructure, Houston 
facilitates the interconnection of global business locations. Business alliances with major U.S. and international markets is 
further enhanced by the presence of 92 foreign consulate offices in Houston. In 2013, Houston ranked third in the U.S. – following 
New York and Los Angeles – in foreign consulate representation. 
Houston’s ability to foster continued expansion in future-growth industries responsible for generating high quality, well-paid jobs 
across all business sectors has placed it in the top tier among U.S. cities. With its numerous business advantages, Houston is well-positioned 
HOUSTON 
SEATTLE 
DENVER 
LOS ANGELES 
CHICAGO 
NEW YORK 
ATLANTA 
MIAMI 
to successfully compete in today’s global marketplace. 
TRAV E L T I M E F R O M H O USTON 
CITY DISTANCE AIR RAIL TRUCK 
in hours 
Atlanta 793 miles 2.5 66 13 
Chicago 1,090 miles 2.5 86 18 
Denver 1,119 miles 2.5 60 17 
Los Angeles 1,550 miles 3.5 90 24 
Miami 1,188 miles 2.5 NA 20 
New York 1,631 miles 2.5 NA 20 
Seattle 2,443 miles 5.0 60 36 
SOURCES: mapquest.com, Official Airlines Guide, BNSF Railway, Union Pacific Railroad, 
and Greater Houston Parntership Research Department 
BAY T B 
AN OSS ON 
Port of Houston 
 Ranked #1 U.S. 
Foreign Tonnage 
 Ranked #2 U.S. 
Total Cargo Value 
 Ranked #7 U.S. 
Total Container 
Energy Industry 
 Global Energy 
Capital 
 Over 5,000 rms 
in the region 
 40 percent of the 
national’s base 
petrochemical 
capacity 
Airport System 
 Ranked #6 U.S. 
Airport Passengers 
 Ranked #9 Global 
Aircraft Movement 
 50.0M Passengers 
in 2013 
 914.2M lbs of Air 
Freight in 2013 
Texas Medical 
Center 
 World’s Largest 
Medical Complex 
(1,345 Acres) 
 106K Employees 
 54 Member Institutions 
 7.2M Patients Annually 
 16K International 
Patients Annually 
NASA / Johnson 
Space Center 
 1,700-acre Complex 
 Major Employers 
Boeing Company 
Lockheed Martin 
Jacobs Engineering 
United Space 
Alliance 
SOURCES: Federal Reserve Bank of Dallas; Port of Houston Authority; Fly2Houston.com; Greater Houston Partnership; Perryman Report; NASA Acquisition Internet Service (NAIS) * Statewide Economic Impact
HOUSTON ECONOMIC OUTLOOK 
PAGE 5 
Global Energy Capital 
Houston is internationally recognized as the global energy capital, with virtually every segment of the energy industry represented by 
over 5,000 rms in the region. It is also known as the global center for integrated power, a fast-growing new sector of the energy 
industry. In just over a decade, the number of Houston-based energy trading companies has tripled, with petrochemical capacity in 
the area nearly four times larger than the nearest competing U.S. site. All major oil and gas companies have extensive operations 
in the area, including ExxonMobil, Chevron, BP America, Citgo, ConocoPhillips, Shell Oil Company, BHP Billiton, El Paso Corp., TOTAL, 
BG Group, Devon Energy, LyondellBasell, Halliburton, Occidental Petroleum, Petrobras, Marathon Oil, Anadarko Petroleum, Transocean, 
Apache, Hess Corporation, Neweld Exploration, Enterprise Products Partners, and Plains All American Pipeline. 
$/bbl 
H I STO R I C C RU D E O I L P R I C ES 
June 2014: $105.79/bbl 
June 2008: $133.93/bbl 
1992 
1994 
1996 
1998 
2000 
2002 
2004 
2006 
2008 
2010 
2012 
2014 
$140 
$120 
$100 
$80 
$60 
$40 
$20 
$0 
Rig Count 
U . S . R OTA RY R I G C O U N TS 
June 2014: 1,861 
June 2011: 1,972 
1992 
1994 
1996 
1998 
2000 
2002 
2004 
2006 
2008 
2010 
2012 
2014 
2100 
1900 
1700 
1500 
1300 
1100 
900 
700 
$0 
$/MMBtu 
H I STO R I C N AT U R A L G A S P R I C ES 
June 2014: $4.64/MMBtu 
June 2008: $10.82/MMBtu 
1992 
1994 
1996 
1998 
2000 
2002 
2004 
2006 
2008 
2010 
2012 
2014 
$12 
$10 
$8 
$6 
$4 
$2 
$0 
SOURCES: Energy Information Administration; West Texas Intermediate; Baker Hughes; Greater Houston Partnership 
According to a June 2014 British Petroleum statistical 
review of world energy, global energy consumption growth 
in 2013 accelerated, despite a stagnant global economy. 
According to the study, global primary energy consumption 
increased by 2.3% in 2013, an increase over the 1.8% 
in 2012, but below the 10-year average of 2.5%. Emerging 
economies were responsible for nearly 80% of the net 
growth and consumption growth in North America was 
above average. Oil remains the world’s leading fuel, at 
32.9% of global energy consumption. Natural Gas’s share 
of global primary energy consumption is 23.7%. Even 
though world natural gas consumption grew only 1.4% in 
2013, below the historical average of 2.6%, consumption 
growth was above average North America. 
The U.S. Energy Information Administration’s (EIA) Annual 
Energy Outlook released in April 2014 indicates overall 
U.S. energy consumption will grow at an average annual 
rate of 0.9% from 2013 through 2014. West Texas 
Intermediate crude oil prices increased from $95.77 per 
barrel in June 2013 to $105.79 per barrel in June 2014 
and predicts the price to fall to $95.17 per barrel in 2015. 
The Henry Hub natural gas prices are projected to 
average $4.64 per MMBtu in 2015 decreasing from to $4.58 
per MMBtu by 2014. 
The U.S. rotary rig count increased annually by 5.7% to 
1,861 rigs in June 2014, from 1,761 in June 2013.
HOUSTON ECONOMIC OUTLOOK 
Petrochemical  Plastics Industry 
PAGE 6 
Texas is the largest chemical-producing state, generating $145 billion in annual revenues. Houston is a global leader in manufacturing 
petrochemicals, with the Houston Ship Channel recognized as the largest petrochemical complex in the U.S. The area is home 
to more than 125 rening and petrochemical manufacturing companies operateing the region’s largest petrochemical plants including; 
Bayport Industrial District, Battleground Industrial Complex, Bayport Shipping Terminal, and the Houston Ship Channel. 
Today, the chemical industry employs more than 100,000 workers in Texas, nearly 16.0 percent of the industry's total U.S. workforce, 
according to Labor Department gures. About half of those jobs are in the Houston region, spread across more than 430 chemical 
plants and reneries. In 2013, Texas led the nation in crude oil production, with 27 petroleum reneries producing over 5.1 million 
barrels of crude oil per day, 28.8% of total U.S. rening capacity. Houston accounts for over 40 percent of the national’s base 
petrochemical capacity. 
The discovery of shale rock formations, rich with natural gas and natural gas liquids, has had a huge impact on the region’s economy 
as many of the major energy companies headquartered in Houston have expanded into natural gas production. 
Chemical companies are racing to make investments to take advantage of low natural gas prices, since natural gas is used as a 
feedstock in chemical production. Over the past several years, oil companies have expanded quickly to tap shale oilelds in Texas, 
increasing the states percentage of US oil production. Sanchez Energy Corp recently paid $256 million in 2013 for Hess Corp.’s 
Eagle Ford assets and has recently announced they have entered an agreement to purchase Royal Dutch Shell’s Eagle Ford assets 
for $639 million. According to a new study from the University of Texas at San Antonio’s Institute for Economic Development, 
oil and gas development in the Eagle Ford Shale has more than a $60 billion economic impact on the local South Texas economy and 
over 116,000 jobs are supported in the 20 county area impacted by the play. 
MAJOR HOUSTO N R E G I O N 
C H E M I C A L P L ANTS 
Air Liquide USA 
Air Products 
Baker Petrolite Corpo ration 
BASF Corpo ration 
Bayer Material Scienc e 
BP Texas Cit y 
Celanese 
Chevron Phillips Chemical 
Dow Chemical Company 
E.I. du P ont de Nemou rs Company 
ExxonMobile Chemical 
Goodyear Tire  Rubbe r Company 
INEOS Ole„ns  P olymers 
LyondellBasell Industries 
Lubrizol Corpor ation 
OxyVinyls, LP 
Rohm and Hass T exas 
Shell Chemica l 
Solvay Chemicals, Inc. 
Total Petrochemicals USA 
ENERGY I N D UST RY 
EXPANSIONS, ACQUISITIONS  NEW INVESTMENTS 
Aug 2014 EOG Resources increases Eagle Ford reserve 
p otential 45% 
Aug 2014 Houston oil company grabs assets in East Texas 
f or $278 million 
Aug 2014 Small gas-to-liquids plant planned for former 
H ouston power plant site 
Aug 2014 Houston energy startup lands $600M investment. 
Aug 2014 North Carolina energy engineering/construction 
c onsulting rm opens shop in Houston 
Aug 2014 Pattern Development acquires Texas wind farm 
d evelopment 
July 2014 Fast-growing Tennessee energy company to open 
d owntown Houston office 
July 2014 Los Angeles MLP acquires Houston energy company 
f or $1.6 billion 
July 2014 ExxonMobil restarts Pegasus pipeline in Texas 
July 2014 Texas’ oil and gas industry expands to 
near-record levels 
July 2014 New pipe mill near San Antonio will serve Eagle Ford 
July 2014 TETRA’s gas compression arm to make $825M 
a cquisition 
July 2014 Shell announces new Gulf of Mexico discovery 
May 2014 Energy MA hits 10-year high 
May 2014 Sanchez to buy Shell’s Eagle Ford assets in 
$ 639M deal 
May 2014 3-Freeport to buy Apache’s Gulf of Mexico assets 
a fter shale sale 
SOURCES: Energy Information Administration; Greater Houston Partnership SOURCES: Forbes; Houston and San Antonio Business Journal; Houston Chronicle
HOUSTON ECONOMIC OUTLOOK 
e Port of Houston 
The Port of Houston’s market strength and strategic location represents 
a winning combination for business growth and increased industrial 
development. The economic impact of the Port of Houston is signicant, 
accounting for more than 1.1 million jobs and $179 billion of total 
economic activity in Texas. Business activities related to the port 
generate more than $4.5 billion in state and local tax revenue. Houston 
was ranked the No. 1 U.S. city for global trade by Global Trade 
magazine and according to a recent report by the U.S. Department of 
Commerce’s International Trade Administration, the Houston MSA is now 
the top U.S. market for exports based on 2013 statistics. 
The Port of Houston Authority (PHA) has planned signicant 
infrastructure improvements over the next few years to accommodate 
larger vessels and increased cargo resulting from the Panama Canal 
expansion. More than $220 million has been allocated for capital 
improvement projects in 2013. Approximately $146 million is allocated 
to continued development and modernization of Bayport and 
Barbours Cut container terminals. In addition, about $5 million has been 
allocated for maintenance dredging and related improvements of 
the 52-mile Houston Ship Channel. The remaining capital budget will be 
used primarily for projects at the general cargo and bulk terminals in 
the Turning Basin area and port security. In addition, private industries 
have invested over $35 billion in capital improvements along the 
ship channel. 
The PHA handled more than 1.9 million cargo containers in 2013, for a 
total of 19.1 million tons, placing the Port of Houston in the No. 7 
spot in the U.S. An immense network of interstate highways and railways 
connect the port with an inland market of approximately 100 million 
customers. Over 25 million square feet of distribution centers near the 
port and other centers are growing around the Houston metro area 
in response to the port’s global trade and commerce. 
P O R T O F H O U STO N AU T H O R I T Y 
TOTAL TONNAGE HANDLED 2010-2013 
40.00 
35.00 
30.00 
25.00 
20.00 
15.00 
10.00 
5.00 
0 
2010 
2011 
2012 
2013 
Short Tons (in millions) 
PAGE 7
HOUSTON ECONOMIC OUTLOOK 
Houston’s location in the south central U.S. strategically places it equidistant from the nation’s major population centers – New York 
(1,631 miles) and Los Angeles (1,550 miles). Connection to major national and international locations is facilitated through 
Houston’s excellent transportation infrastructure which includes the George Bush Intercontinental Airport, William P. Hobby Airport, 
Ellington Field, the Port of Houston, and the well-integrated mainline railroads and trucking system serving the area. 
In the Houston MSA, an extensive freeway system spans 575.5 miles and are continually being expanded as the regions population 
grows. Between 2003 and 2008, a boom in new construction projects for Houston’s major freeways and tollways signi–cantly 
improved mobility and accessibility for the region. Expansion of the Katy Freeway (Interstate 10) was one of the most signi–cant 
projects completed in October 2008, with other key improvement projects including Loop 610/West Loop, Southwest Freeway (U.S. 
Highway 59 South), Grand Parkway (State Highway 99), North Freeway (Interstate 45 North), Eastex Freeway (U.S. Highway 59 
North), Crosby Freeway (U.S. Highway 90), Sam Houston Tollway (Beltway 8), and Westpark Tollway. New and existing projects in 
2014 and beyond include the expansion 
of Hwy 290, IH 610 and U.S. Hwy 
290 interchange, as well as Segment 
E and F of the Grand Parkway. The 
Houston-Galveston Area Council 
revised the 2035 and 2040 Regional 
Transportation Plans (RTP), which 
provides a 20-year capital projects 
improvement plan for area transportation, 
detailing capital priorities and 
projected expenditures. More than 
$61.1 billion of the $87.0 billion estimated 
cost for these projects is funded 
through toll revenues, property tax, 
and Metro sales tax. 
NASA/Johnson Space Center 
NASA’s Johnson Space Center (JSC) is a $1.8B complex occupying 1,700 acres, –rst established in 1961, and later renamed in 1973 
in honor of the late President Lyndon B. Johnson, a native Texan. JSC is one of NASA’s largest research and development 
facilities and mission control for all U.S. manned space flight communications, including the International Space Station and Exploration 
Programs. From the early space exploration projects Gemini, Apollo and Skylab, came the historic moment when the –rst word 
from the moon was “Houston”, and deservedly so, as it took a 15,000-member team in Houston to develop, test and put into action 
what millions around the world watched on television in 1969. Since its inception, JSC continues to make signi–cant advances 
in science, aeronautics, technology, engineering and medicine. 
In 2013 JSC’s workforce represented over 15,000 jobs, including approximately 3,000 civil servants and 12,000 contractor personnel 
employed onsite or in facilities in the area. JSC’s top contractors include The Boeing Company, United Space Alliance, Lockheed 
Martin, Anadarko Industries, Jacobs Technology, Honeywell International, Bastion Technologies, Science Applications International 
Corporation (SAIC), Raytheon Technical Services, Oceaneering Space Systems, and Odyssey Space Research, among many others. 
The Mission Control Center at Johnson Space Center directs all space shuttle missions, including international space station assembly 
flights. MCC also manages all activity onboard the international space station. JSC serves as the lead NASA center for the 
International Space Station – a U.S.-led collaborative effort of 16 nations, and the largest, most powerful, complex human facility to 
ever operate in space. 
Mobility Infrastructure 
2 0 3 5 RT P C A P I TA L P R I O R I T I ES 
ROADWAYS TRANSIT PED/BIKE 
SH99 Grand Pkwy $6.7B Bus Replacement $2.8B City of Houston $29.9M 
US 290 Corridor $3.7B North Corridor $1.6B Greenspoint $29.8M 
IH 45 South $1.5B Southeast Corridor 1.1B Galveston/Harris Co. $22.0M 
SH 288 $1.4B Northwest Corridor $1.1B City of La Porte $14.9M 
US 59 South $1.2B University Corridor $1.0B Westchase District $14.8M 
Beltway 8 $1.1B Southwest Commuter $0.7B City of Conroe $12.4M 
IH 610 $1.0B East End Corridor $0.7B Sims Bayou Trail $11.6M 
SH 146 $0.7B Uptown Corridor $0.6B 
ALL ROADWAYS $25.6B ALL TRANSIT $11.9B ALL PED/BIKE $0.3B 
1961 PAGE 8
HOUSTON ECONOMIC OUTLOOK 
PAGE 9 
Airport System 
The Houston Airport System (HAS) is one of the world’s leading multi-airport facilities and includes George Bush Intercontinental 
Airport, William P. Hobby Airport, and Ellington Field. HAS ranked sixth nationally in passenger volume in 2013, carrying an 
impressive 50.9 million passengers and 914.2 million pounds of air freight. The Houston Airport System has a local economic impact 
of more than $27 billion annually. 
1,000,000,000 
900,000,000 
800,000,000 
700,000,000 
600,000,000 
500,000,000 
400,000,000 
GEORGE BUSH INTERCONTINENTAL AIRPORT/HOUSTON (IAH), situated 
twenty-three miles north of downtown Houston, is the nation’s 12th 
busiest airport serving 39.8 million passengers in 2013 and offering 200 
domestic and international destinations, with nearly 650 daily departures 
including non-stop direct flights to major cities in Europe, Mexico, Latin 
America and Asia. IAH is served by 21 scheduled passenger airlines and 
numerous charter airlines. The airport is served by 12 all-cargo airlines 
handling more than 885 million pounds of cargo in 2013. Currently, IAH has 
—ve terminals, no takeoff and landing curfews, and ample land to expand 
its facilities as requirements demand. The scope and quality of IAH facilities 
make it one of the top U.S. airports for international air cargo traffic. 
WILLIAM P. HOBBY AIRPORT is located seven miles southeast of downtown 
Houston and is the nation’s 33rd busiest commercial airport, handling over 
11 million passengers in 2013. Hobby Airport also serves as a major regional 
center for corporate and private aviation, with —ve passenger airlines 
offering scheduled service to approximately 117 U.S. destinations and 70 
international destinations. There are 255 private aircraft based at Hobby, 
including 91 corporate jets and —ve —xed-base operators serving the airport. 
AIR CARGO A strong increase in domestic and international trade 
continues to drive activity at IAH where the 500,000-SF state-of-the-art Air 
Cargo Center handled over 885M pounds of cargo in 2013. With over 
900 air freight-related businesses in the area, IAH is among the leading 
distribution hubs in the nation with a solid track record of growth and 
continued future expansion. 
SOURCES: Airport Council International; Houston Airport System 
2013 
2012 
2011 
2010 
2009 
2008 
2007 
2006 
2005 
2004 
2003 
2002 
2001 
2000 
A I R F R E I G H T 
DOMESTIC  INTERNATIONAL CARGO - IN POUNDS 
300,000,000 
International Domestic 
IAH Air Freight Statistics  Trends 
 IAH ranked 14th largest air cargo hub 
in the U.S. 
 IAH is one of the fastest growing distribution 
hubs in the U.S. 
 IAH 2013 air freight cargo exceeded 
885M pounds. 
 IAH has state-of-the-art facilities to globally 
transport time-sensitive products. 
 Houston’s role as a major gateway for 
import-export trade is expected to continue 
expanding with the new Panama Canal 
lock open. 
 IAH ranked #12 serving almost 40M 
passengers in 2013.
HOUSTON ECONOMIC OUTLOOK 
PAGE 10 
Texas Medical Center 
The Texas Medical Center (TMC) – the world’s largest medical center – represents one of Houston’s major economic drivers and 
core industries with an estimated regional annual economic impact of $15 billion. TMC is also one of Houston’s largest employers with 
106,000 employees, including physicians, sc 
scientists, researchers and other advanced degree professionals in the life sciences. 
T E X A S M E D I C A L C E N 
T E R 
TMC Patient Care Institutions 
 DePelchin Children’s Center 
 The Menninger Clinic 
 The University of Texas M.D. Anderson Cancer Center 
 Texas Children’s Hospital 
 Memorial Hermann Hospital System 
 The Methodist Hospital 
 St. Luke’s Episcopal Hospital 
 Lyndon B. Johnson General Hospital 
 Quentin Mease Community Hospital 
 Ben Taub General Hospital 
 The Institute for Rehabilitation and Research 
 The Hospice at the Texas Medical Center 
 Texas Heart Institute 
 Shriners Hospitals for Children – Houston 
 Veterans Affairs Medical Center in Houston 
TMC Academic  Research Institutions 
 Sabin Vaccine Institute 
 The University of Houston – Victoria School of Nursing 
 Texas Children’s Hospital Neurological 
Research Institute 
 Baylor College of Medicine 
 The University of Texas Health Science Center 
at Houston 
 The University of Texas M.D. Anderson Cancer Center 
 University of Houston College of Pharmacy 
 Rice University 
 Texas AM University Health Science Center 
 Prairie View AM University College of Nursing 
 Texas Woman’s University Institute of Health Sciences 
 Texas Southern University College of Pharmacy 
and Health Sciences 
 Harris County Psychiatric Center 
 Houston Academy of Medicine 
The University of Texas M.D. Anderson Cancer 
Center in the Texas Medical Center, ranked 
#2 in U.S. News  World Reports “Americas 
Best Hospitals 2014-2015” for cancer care. 
The internationally-renowned, 1,345-acre TMC is the world’s largest 
medical complex with 41 member institutions, including leading 
medical, academic and research institutions, all of which are non-pro 
ĹĄt and dedicated to the highest standards of research, 
education and patient and preventive care. Over 50,000 students, 
including more than 20,000 international students, are affiliated 
with TMC, including high school, college and health profession 
graduate programs. More than 7.2 million patients visit TMC each 
year, including approximately 16,000 international patient visits. 
In addition to the medical facilities and institutions of higher learning, 
TMC is also home to more than 290 professional buildings. 
Overall, the complex covers over 18 miles of public and private 
streets and roadways, with 45.8M SF of existing patient, education, 
and research space. TMC has continued to grow and expand 
over the past several decades with the majority of growth occurring 
in the past ten years. The Center is located in the 110-acre 
University of Texas Research Park, a joint effort between the 
University of Texas Health Science Center, M.D. Anderson, and 
General Electric Healthcare. TMC spends billions of dollars on 
research and charity care annually. 
KATY 
GALLERIA 
BELLAIRE 
SUGAR LAND 
RICHMOND 
PASADENA 
LEAGUE CITY 
IAH 
HOU 
EFD 
CBD 
H 
610 
290 
249 
90 
59 
59 
610 
288 
225 
146 
I-45 
I-45 
I-10 
I-10 
8 
8 
8 
8 
SHIP 
CHANNEL 
GAL 
BAY 
6 
TEXAS MEDICAL CENTER LOCATION 
Texas Medical Center 
 World’s Largest Medical 
Complex (1,345 Acres) 
 106,000 Employees 
 54 Member Institutions 
 7.2M Patients Annually 
 5,000 Physicians 
 49,000 Life Science Students 
 $960 million in Charity Care 
Houston MSA Health Care 
 115 Hospitals 
 19,830 Hospital Beds 
 13,360 Physicians 
 299,600 Health Care 
 Social Assistance jobs 
 3.5% annual employment 
growth
HOUSTON ECONOMIC OUTLOOK 
Biosciences  Biotechnology 
PAGE 11 
Biotechnology and the life science industry continue expanding in the Houston region with more than 100 
institutions and companies attracting over $1.8B in research and development funding annually. Since 2005, 
the Texas Emerging Technology Fund has allocated more than $205 million in funds to 145 early-stage 
companies, and $220 million in grant matching and research superiority funds to Texas universities. Since 2010, 
the state-funded Cancer Prevention and Research Institute of Texas has awarded $382 million in cancer 
research, commercialization and prevention grants. Leading research efforts in the area represent established 
and emerging industries, including nanotechnology, pharmaceuticals, nutraceuticals, genetics/genomics, 
biodefense and infectious diseases, stem cell research, and oncology. 
Long known for its research-centric Texas Medical Center (TMC), the Houston region is gaining momentum in 
the development and commercialization of products ensuring its place as a major biotechnology and life 
sciences cluster. Public and private sector support, including investments by entrepreneurs and venture 
capitalists, will continue to be crucial in creating the necessary infrastructure to facilitate the entrance of both 
established and start-up private companies committed to biotechnology. 
B I O S C I E N C ES I N 2 0 1 3 -2 0 1 4 
 FEB 2014 DNAtrix snags $10.8 million from Texas cancer-research institute. 
 FEB 2014 Cancer Prevention and Research Institute of Texas (CPRIT) awards $22.9 million in research grants 
to DNAtrix Inc., The University of Texas Medical Branch at Galveston, Baylor College of Medicine, 
Rice University, The University of Texas Health Science Center at Houston and the University of Texas 
M.D. Anderson Cancer Center. 
 JAN 2014 Early studies show microspheres could be key in preventing bone infections after joint replacement. 
 JAN 2014 Houston Biotech company closes major funding round. 
 OCT 2013 New company to manufacture heart pumps in Houston. 
HOUSTON AREA BIOTECHNOLOGY BUSINESS PARKS 
Outside of the TMC, the 1,000-acre Research Forest located in The Woodlands (30 miles north of downtown 
Houston) is a long-standing major research center designed speci”cally for scienti”c, research and 
biotechnology companies. More recently established business parks/organizations geared towards biotechnology 
commercialization in the Houston region include the Genesis Biotechnology Park and BioHouston, Inc. Genesis 
Biotechnology Park comprises 16 innovative life science companies and researchers located just south of 
the TMC. The Park was developed to increase venture capital interests in Houston and is committed to supporting 
start-up companies by providing tenant options for shared office, wet laboratory space (including equipment), 
and flexible leases. 
BioHouston, Inc., a non-pro”t corporation founded by Houston-area academic/research institutions, is actively 
leading a broad-based effort to strengthen Houston’s position as a global competitor in life science and 
biotechnology. BioHouston’s Resource Center, the ”rst incubator facility serving the Houston life sciences 
community, is housed at the Genesis Biotechnology Park, adding a key component to ongoing commercialization 
efforts. The Center is speci”cally designed to serve start-up biotech and life sciences companies by offering 
access to shared laboratory space, research resources, and networking opportunities with a community of 
biotech entrepreneurs. 
From its base of cutting-edge research, Houston has taken the next step in its evolution as a primary life 
science cluster by creating an environment conducive for private companies to develop and market life science 
products. With key initiatives in place to bring together the public and private sectors, as well as signi”cant 
improvements to the scope of services and incentives available to private companies, the infrastructure is in 
place to capitalize on Houston’s strong research base and convert it into commercialized product. With this 
process now in motion, the biotech future in Houston looks bright.
e Colliers Advantage 
ENTERPRISING CULTURE Colliers International is a leader in global real estate services, de
ned by our 
spirit of enterprise. Through a culture of service excellence and a shared sense of initiative, we integrate the 
resources of real estate specialists worldwide to accelerate the success of our partners. 
When you choose to work with Colliers, you choose to work with the best. In addition to being highly 
skilled experts in their 
eld, our people are passionate about what they do. And they know we are invested 
in their success just as much as we are in our clients’ success. 
This is evident throughout our platform—from Colliers University, our proprietary education and professional 
development platform, to our client engagement strategy that encourages cross-functional service integration, 
to our culture of caring. 
We connect through a shared set of values that shape a collaborative environment throughout our 
organization that is unsurpassed in the industry. That’s why we attract top recruits and have one of the highest 
retention rates in the industry. Colliers International has also been recognized as one of the “best places 
to work” by top business organizations in many of our markets across the globe. 
Colliers International offers a comprehensive portfolio of real estate services to occupiers, owners and investors 
on a local, regional, national and international basis. 
LISA R. BRIDGES 
Director of Market Research | Houston 
Direct +1 713 830 2125 
Fax +1 713 830 2118 
lisa.bridges@colliers.com 
COLLIERS INTERNATIONAL 
1233 W. Loop South 
Suite 900 
Houston, Texas 77027 
Main +1 713 222 2111 
$75B 
TRANSACTION VALUE 
1.46B 
* 
SF UNDER MANAGEMENT 
$2.1B 
IN REVENUE 
485 
OFFICES 
15,800 
PROFESSIONALS  STAFF 
SIOR 
238 
ACCREDITED MEMBERS 
63 
COUNTRIES 
*2013 stats include office, industrial, and 
retail properties under management. Residential 
properties are excluded from this total. 
Accelerating success. 
HOUSTON ECONOMIC OUTLOOK 
*Information herein has been obtained from sources deemed reliable, however its accuracy cannot be guaranteed

More Related Content

What's hot

An ‘econographic’ analysis of the relevance of the thomas malthus theory to n...
An ‘econographic’ analysis of the relevance of the thomas malthus theory to n...An ‘econographic’ analysis of the relevance of the thomas malthus theory to n...
An ‘econographic’ analysis of the relevance of the thomas malthus theory to n...Alexander Decker
 
2014 Charting international labor comparisons
2014 Charting international labor comparisons2014 Charting international labor comparisons
2014 Charting international labor comparisonsRichard Han
 
Texas is the Fastest Growing State in the Union
Texas is the Fastest Growing State in the UnionTexas is the Fastest Growing State in the Union
Texas is the Fastest Growing State in the UnionWorldFuture2015
 
Plus Review 3Q 2010
Plus Review 3Q 2010Plus Review 3Q 2010
Plus Review 3Q 2010Team NEO
 
A Theoretical Statistical Measurement Model Analysis on Human Capital Economi...
A Theoretical Statistical Measurement Model Analysis on Human Capital Economi...A Theoretical Statistical Measurement Model Analysis on Human Capital Economi...
A Theoretical Statistical Measurement Model Analysis on Human Capital Economi...paperpublications3
 
Jason madison's final presentation
Jason madison's final presentationJason madison's final presentation
Jason madison's final presentationJason Madison
 
Tourism and the labor marke
Tourism and the labor markeTourism and the labor marke
Tourism and the labor markeDr. Ali Alalmai
 
The enigma of us productivity slowdown a theoretical analysis
The enigma of us productivity slowdown a theoretical analysisThe enigma of us productivity slowdown a theoretical analysis
The enigma of us productivity slowdown a theoretical analysisAlexander Decker
 
Development Q & A Powerpoint
Development Q & A PowerpointDevelopment Q & A Powerpoint
Development Q & A PowerpointDustin Blohm
 
Georgia Economic Outlook By Vitner July2010
Georgia Economic Outlook By Vitner July2010Georgia Economic Outlook By Vitner July2010
Georgia Economic Outlook By Vitner July2010LenderJason
 
E442745
E442745E442745
E442745aijbm
 
16.09.14 AmchamInvestmentReport FULL
16.09.14 AmchamInvestmentReport FULL16.09.14 AmchamInvestmentReport FULL
16.09.14 AmchamInvestmentReport FULLPeter Milne
 
An Unintended Curse of Gifts, Workers Remittances and International Competiti...
An Unintended Curse of Gifts, Workers Remittances and International Competiti...An Unintended Curse of Gifts, Workers Remittances and International Competiti...
An Unintended Curse of Gifts, Workers Remittances and International Competiti...Gregory Loshkajian
 
B440513
B440513B440513
B440513aijbm
 
Holst Robin Paper
Holst Robin PaperHolst Robin Paper
Holst Robin PaperRobin Holst
 
Futuring Trends and Its Implications on the Financial Industry
Futuring Trends and Its Implications on the Financial IndustryFuturing Trends and Its Implications on the Financial Industry
Futuring Trends and Its Implications on the Financial IndustryMatthew Blum
 

What's hot (17)

An ‘econographic’ analysis of the relevance of the thomas malthus theory to n...
An ‘econographic’ analysis of the relevance of the thomas malthus theory to n...An ‘econographic’ analysis of the relevance of the thomas malthus theory to n...
An ‘econographic’ analysis of the relevance of the thomas malthus theory to n...
 
2014 Charting international labor comparisons
2014 Charting international labor comparisons2014 Charting international labor comparisons
2014 Charting international labor comparisons
 
Texas is the Fastest Growing State in the Union
Texas is the Fastest Growing State in the UnionTexas is the Fastest Growing State in the Union
Texas is the Fastest Growing State in the Union
 
Wcms 181836
Wcms 181836Wcms 181836
Wcms 181836
 
Plus Review 3Q 2010
Plus Review 3Q 2010Plus Review 3Q 2010
Plus Review 3Q 2010
 
A Theoretical Statistical Measurement Model Analysis on Human Capital Economi...
A Theoretical Statistical Measurement Model Analysis on Human Capital Economi...A Theoretical Statistical Measurement Model Analysis on Human Capital Economi...
A Theoretical Statistical Measurement Model Analysis on Human Capital Economi...
 
Jason madison's final presentation
Jason madison's final presentationJason madison's final presentation
Jason madison's final presentation
 
Tourism and the labor marke
Tourism and the labor markeTourism and the labor marke
Tourism and the labor marke
 
The enigma of us productivity slowdown a theoretical analysis
The enigma of us productivity slowdown a theoretical analysisThe enigma of us productivity slowdown a theoretical analysis
The enigma of us productivity slowdown a theoretical analysis
 
Development Q & A Powerpoint
Development Q & A PowerpointDevelopment Q & A Powerpoint
Development Q & A Powerpoint
 
Georgia Economic Outlook By Vitner July2010
Georgia Economic Outlook By Vitner July2010Georgia Economic Outlook By Vitner July2010
Georgia Economic Outlook By Vitner July2010
 
E442745
E442745E442745
E442745
 
16.09.14 AmchamInvestmentReport FULL
16.09.14 AmchamInvestmentReport FULL16.09.14 AmchamInvestmentReport FULL
16.09.14 AmchamInvestmentReport FULL
 
An Unintended Curse of Gifts, Workers Remittances and International Competiti...
An Unintended Curse of Gifts, Workers Remittances and International Competiti...An Unintended Curse of Gifts, Workers Remittances and International Competiti...
An Unintended Curse of Gifts, Workers Remittances and International Competiti...
 
B440513
B440513B440513
B440513
 
Holst Robin Paper
Holst Robin PaperHolst Robin Paper
Holst Robin Paper
 
Futuring Trends and Its Implications on the Financial Industry
Futuring Trends and Its Implications on the Financial IndustryFuturing Trends and Its Implications on the Financial Industry
Futuring Trends and Its Implications on the Financial Industry
 

Viewers also liked

Knowledge Leader - October 2011
Knowledge Leader - October 2011Knowledge Leader - October 2011
Knowledge Leader - October 2011Chris Fyvie
 
Government Transparency at Politics Online Conference in Washington, DC
Government Transparency at Politics Online Conference in Washington, DCGovernment Transparency at Politics Online Conference in Washington, DC
Government Transparency at Politics Online Conference in Washington, DCGreg Palmer
 
2 fc 2 may Toronto Commercial real estate
2 fc 2 may Toronto Commercial real estate2 fc 2 may Toronto Commercial real estate
2 fc 2 may Toronto Commercial real estateChris Fyvie
 
Office fall2010 final
Office fall2010 finalOffice fall2010 final
Office fall2010 finalChris Fyvie
 
Actionable Data Governance
Actionable Data GovernanceActionable Data Governance
Actionable Data Governancespearcy
 
SEB Resultatpresentation 2009, Annika Falkengren, Ceo
SEB Resultatpresentation 2009, Annika Falkengren, CeoSEB Resultatpresentation 2009, Annika Falkengren, Ceo
SEB Resultatpresentation 2009, Annika Falkengren, CeoSEBgroup
 
Pitney Bowes: How to Organize Internally for Reputation Management Externally...
Pitney Bowes: How to Organize Internally for Reputation Management Externally...Pitney Bowes: How to Organize Internally for Reputation Management Externally...
Pitney Bowes: How to Organize Internally for Reputation Management Externally...Business Development Institute
 
"BetriebsrätInnen treffen prekäre Nerds" - Soziale Bewegungen und Social Media
"BetriebsrätInnen treffen prekäre Nerds" - Soziale Bewegungen und Social Media"BetriebsrätInnen treffen prekäre Nerds" - Soziale Bewegungen und Social Media
"BetriebsrätInnen treffen prekäre Nerds" - Soziale Bewegungen und Social MediaThomas Kreiml
 
Ferdinand porsche
Ferdinand porscheFerdinand porsche
Ferdinand porscheasylum_uss
 
Spark the changing work environment
Spark   the changing work environmentSpark   the changing work environment
Spark the changing work environmentChris Fyvie
 
Dte cool - sept 2011
Dte   cool - sept 2011Dte   cool - sept 2011
Dte cool - sept 2011Chris Fyvie
 
1. over view and history of c
1. over view and history of c1. over view and history of c
1. over view and history of cHarish Kumawat
 
Applied theatre by Prof John OToole
Applied theatre by Prof John OTooleApplied theatre by Prof John OToole
Applied theatre by Prof John OTooleSue Davis
 
Vernon Vela Vista (WEB)
Vernon Vela Vista (WEB)Vernon Vela Vista (WEB)
Vernon Vela Vista (WEB)Aly Alidina
 
TechTarget Sec Filing 8k Notice Of Delisting Or Failure To Satisfy A Continue...
TechTarget Sec Filing 8k Notice Of Delisting Or Failure To Satisfy A Continue...TechTarget Sec Filing 8k Notice Of Delisting Or Failure To Satisfy A Continue...
TechTarget Sec Filing 8k Notice Of Delisting Or Failure To Satisfy A Continue...Manya Mohan
 
Paul Maverick Ward - VERTSOL Reader
Paul Maverick Ward - VERTSOL ReaderPaul Maverick Ward - VERTSOL Reader
Paul Maverick Ward - VERTSOL ReaderPaul Ward
 
Avison Toronto office market report q2 2015 cre
Avison Toronto office market report q2 2015 creAvison Toronto office market report q2 2015 cre
Avison Toronto office market report q2 2015 creChris Fyvie
 
A Technology Revolution In Commercial Real Estate
A Technology Revolution In Commercial Real EstateA Technology Revolution In Commercial Real Estate
A Technology Revolution In Commercial Real EstateChris Fyvie
 
Lennard Commercial - Office Space Toronto - August 2015
Lennard Commercial - Office Space Toronto - August 2015Lennard Commercial - Office Space Toronto - August 2015
Lennard Commercial - Office Space Toronto - August 2015Chris Fyvie
 

Viewers also liked (20)

Knowledge Leader - October 2011
Knowledge Leader - October 2011Knowledge Leader - October 2011
Knowledge Leader - October 2011
 
Government Transparency at Politics Online Conference in Washington, DC
Government Transparency at Politics Online Conference in Washington, DCGovernment Transparency at Politics Online Conference in Washington, DC
Government Transparency at Politics Online Conference in Washington, DC
 
2 fc 2 may Toronto Commercial real estate
2 fc 2 may Toronto Commercial real estate2 fc 2 may Toronto Commercial real estate
2 fc 2 may Toronto Commercial real estate
 
Office fall2010 final
Office fall2010 finalOffice fall2010 final
Office fall2010 final
 
Actionable Data Governance
Actionable Data GovernanceActionable Data Governance
Actionable Data Governance
 
SEB Resultatpresentation 2009, Annika Falkengren, Ceo
SEB Resultatpresentation 2009, Annika Falkengren, CeoSEB Resultatpresentation 2009, Annika Falkengren, Ceo
SEB Resultatpresentation 2009, Annika Falkengren, Ceo
 
Pitney Bowes: How to Organize Internally for Reputation Management Externally...
Pitney Bowes: How to Organize Internally for Reputation Management Externally...Pitney Bowes: How to Organize Internally for Reputation Management Externally...
Pitney Bowes: How to Organize Internally for Reputation Management Externally...
 
"BetriebsrätInnen treffen prekäre Nerds" - Soziale Bewegungen und Social Media
"BetriebsrätInnen treffen prekäre Nerds" - Soziale Bewegungen und Social Media"BetriebsrätInnen treffen prekäre Nerds" - Soziale Bewegungen und Social Media
"BetriebsrätInnen treffen prekäre Nerds" - Soziale Bewegungen und Social Media
 
Ferdinand porsche
Ferdinand porscheFerdinand porsche
Ferdinand porsche
 
Spark the changing work environment
Spark   the changing work environmentSpark   the changing work environment
Spark the changing work environment
 
Dte cool - sept 2011
Dte   cool - sept 2011Dte   cool - sept 2011
Dte cool - sept 2011
 
Top 10 internet uses
Top 10 internet usesTop 10 internet uses
Top 10 internet uses
 
1. over view and history of c
1. over view and history of c1. over view and history of c
1. over view and history of c
 
Applied theatre by Prof John OToole
Applied theatre by Prof John OTooleApplied theatre by Prof John OToole
Applied theatre by Prof John OToole
 
Vernon Vela Vista (WEB)
Vernon Vela Vista (WEB)Vernon Vela Vista (WEB)
Vernon Vela Vista (WEB)
 
TechTarget Sec Filing 8k Notice Of Delisting Or Failure To Satisfy A Continue...
TechTarget Sec Filing 8k Notice Of Delisting Or Failure To Satisfy A Continue...TechTarget Sec Filing 8k Notice Of Delisting Or Failure To Satisfy A Continue...
TechTarget Sec Filing 8k Notice Of Delisting Or Failure To Satisfy A Continue...
 
Paul Maverick Ward - VERTSOL Reader
Paul Maverick Ward - VERTSOL ReaderPaul Maverick Ward - VERTSOL Reader
Paul Maverick Ward - VERTSOL Reader
 
Avison Toronto office market report q2 2015 cre
Avison Toronto office market report q2 2015 creAvison Toronto office market report q2 2015 cre
Avison Toronto office market report q2 2015 cre
 
A Technology Revolution In Commercial Real Estate
A Technology Revolution In Commercial Real EstateA Technology Revolution In Commercial Real Estate
A Technology Revolution In Commercial Real Estate
 
Lennard Commercial - Office Space Toronto - August 2015
Lennard Commercial - Office Space Toronto - August 2015Lennard Commercial - Office Space Toronto - August 2015
Lennard Commercial - Office Space Toronto - August 2015
 

Similar to 2014 Houston Economic Outlook

2014 Houston Economic Outlook
2014 Houston Economic Outlook2014 Houston Economic Outlook
2014 Houston Economic OutlookCoy Davidson
 
Graebel_CitySynopsis_Houston
Graebel_CitySynopsis_HoustonGraebel_CitySynopsis_Houston
Graebel_CitySynopsis_HoustonPat Liberati
 
The Future of Texas: The Fastest Growing State in the Union
The Future of Texas: The Fastest Growing State in the UnionThe Future of Texas: The Fastest Growing State in the Union
The Future of Texas: The Fastest Growing State in the UnionWorldFuture2015
 
Houston Facts :: How Many Do You Know?
Houston Facts :: How Many Do You Know?Houston Facts :: How Many Do You Know?
Houston Facts :: How Many Do You Know?Brian Trimble
 
GHP Houston: The Economy at a Glance
GHP Houston: The Economy at a GlanceGHP Houston: The Economy at a Glance
GHP Houston: The Economy at a GlanceBob Lowery
 
Houston’s Energy Angst - Yardi Matrix Multifamily Winter 2016 Report
Houston’s Energy Angst - Yardi Matrix Multifamily Winter 2016 ReportHouston’s Energy Angst - Yardi Matrix Multifamily Winter 2016 Report
Houston’s Energy Angst - Yardi Matrix Multifamily Winter 2016 ReportAdelina Osan
 
GHP: The Economy At A Glance (August 2010)
GHP: The Economy At A Glance (August 2010)GHP: The Economy At A Glance (August 2010)
GHP: The Economy At A Glance (August 2010)Bob Lowery
 
Houston Economy at a Glance
Houston Economy at a GlanceHouston Economy at a Glance
Houston Economy at a GlanceDan Hutchins
 
Paine Wetzel/TCN 2016 Q4 State of the Market: Central Edition
Paine Wetzel/TCN 2016 Q4 State of the Market: Central EditionPaine Wetzel/TCN 2016 Q4 State of the Market: Central Edition
Paine Wetzel/TCN 2016 Q4 State of the Market: Central EditionMarc Hale
 
Paine Wetzel/TCN 2016 Q4 State of the Market: Central Edition
Paine Wetzel/TCN 2016 Q4 State of the Market: Central EditionPaine Wetzel/TCN 2016 Q4 State of the Market: Central Edition
Paine Wetzel/TCN 2016 Q4 State of the Market: Central EditionMarc Hale
 
BoyarMiller Real Estate eBook August 2013 State of the Industry
BoyarMiller Real Estate eBook August 2013 State of the IndustryBoyarMiller Real Estate eBook August 2013 State of the Industry
BoyarMiller Real Estate eBook August 2013 State of the IndustryBoyarMiller
 
Reci Q1 2016 Houston MOB Report
Reci Q1 2016 Houston MOB ReportReci Q1 2016 Houston MOB Report
Reci Q1 2016 Houston MOB ReportThomas Amato
 
RECI Q1 2016 Houston MOB Report
RECI Q1 2016 Houston MOB ReportRECI Q1 2016 Houston MOB Report
RECI Q1 2016 Houston MOB ReportThomas Amato
 
Houston Economy at a Glance November 2013
Houston Economy at a Glance November 2013Houston Economy at a Glance November 2013
Houston Economy at a Glance November 2013Coy Davidson
 
Net leased Walgreens for sale
Net leased Walgreens for saleNet leased Walgreens for sale
Net leased Walgreens for saleThe Boulder Group
 
Summer Indicator
Summer IndicatorSummer Indicator
Summer IndicatorPolly Sue Webb
 
Issue Issue 2 SHAPE MERGEF.docx
Issue                    Issue       2 SHAPE   MERGEF.docxIssue                    Issue       2 SHAPE   MERGEF.docx
Issue Issue 2 SHAPE MERGEF.docxchristiandean12115
 

Similar to 2014 Houston Economic Outlook (20)

2014 Houston Economic Outlook
2014 Houston Economic Outlook2014 Houston Economic Outlook
2014 Houston Economic Outlook
 
Graebel_CitySynopsis_Houston
Graebel_CitySynopsis_HoustonGraebel_CitySynopsis_Houston
Graebel_CitySynopsis_Houston
 
The Future of Texas: The Fastest Growing State in the Union
The Future of Texas: The Fastest Growing State in the UnionThe Future of Texas: The Fastest Growing State in the Union
The Future of Texas: The Fastest Growing State in the Union
 
Houston Facts :: How Many Do You Know?
Houston Facts :: How Many Do You Know?Houston Facts :: How Many Do You Know?
Houston Facts :: How Many Do You Know?
 
GHP Houston: The Economy at a Glance
GHP Houston: The Economy at a GlanceGHP Houston: The Economy at a Glance
GHP Houston: The Economy at a Glance
 
Houston’s Energy Angst - Yardi Matrix Multifamily Winter 2016 Report
Houston’s Energy Angst - Yardi Matrix Multifamily Winter 2016 ReportHouston’s Energy Angst - Yardi Matrix Multifamily Winter 2016 Report
Houston’s Energy Angst - Yardi Matrix Multifamily Winter 2016 Report
 
GHP: The Economy At A Glance (August 2010)
GHP: The Economy At A Glance (August 2010)GHP: The Economy At A Glance (August 2010)
GHP: The Economy At A Glance (August 2010)
 
Houston Economy at a Glance
Houston Economy at a GlanceHouston Economy at a Glance
Houston Economy at a Glance
 
Paine Wetzel/TCN 2016 Q4 State of the Market: Central Edition
Paine Wetzel/TCN 2016 Q4 State of the Market: Central EditionPaine Wetzel/TCN 2016 Q4 State of the Market: Central Edition
Paine Wetzel/TCN 2016 Q4 State of the Market: Central Edition
 
Paine Wetzel/TCN 2016 Q4 State of the Market: Central Edition
Paine Wetzel/TCN 2016 Q4 State of the Market: Central EditionPaine Wetzel/TCN 2016 Q4 State of the Market: Central Edition
Paine Wetzel/TCN 2016 Q4 State of the Market: Central Edition
 
2010 HAR H-Town Day- Daniel G. Bellow, CRE, SIOR, CCIM
2010 HAR H-Town Day- Daniel G. Bellow, CRE, SIOR, CCIM2010 HAR H-Town Day- Daniel G. Bellow, CRE, SIOR, CCIM
2010 HAR H-Town Day- Daniel G. Bellow, CRE, SIOR, CCIM
 
BoyarMiller Real Estate eBook August 2013 State of the Industry
BoyarMiller Real Estate eBook August 2013 State of the IndustryBoyarMiller Real Estate eBook August 2013 State of the Industry
BoyarMiller Real Estate eBook August 2013 State of the Industry
 
Barometer2016
Barometer2016Barometer2016
Barometer2016
 
Reci Q1 2016 Houston MOB Report
Reci Q1 2016 Houston MOB ReportReci Q1 2016 Houston MOB Report
Reci Q1 2016 Houston MOB Report
 
RECI Q1 2016 Houston MOB Report
RECI Q1 2016 Houston MOB ReportRECI Q1 2016 Houston MOB Report
RECI Q1 2016 Houston MOB Report
 
Houston Economy at a Glance November 2013
Houston Economy at a Glance November 2013Houston Economy at a Glance November 2013
Houston Economy at a Glance November 2013
 
Net leased Walgreens for sale
Net leased Walgreens for saleNet leased Walgreens for sale
Net leased Walgreens for sale
 
Summer Indicator
Summer IndicatorSummer Indicator
Summer Indicator
 
Why Austin Book
Why Austin BookWhy Austin Book
Why Austin Book
 
Issue Issue 2 SHAPE MERGEF.docx
Issue                    Issue       2 SHAPE   MERGEF.docxIssue                    Issue       2 SHAPE   MERGEF.docx
Issue Issue 2 SHAPE MERGEF.docx
 

More from Colliers International | Houston

Q1 2021 | Austin Industrial | Research & Forecast Commericial Real Estate Report
Q1 2021 | Austin Industrial | Research & Forecast Commericial Real Estate ReportQ1 2021 | Austin Industrial | Research & Forecast Commericial Real Estate Report
Q1 2021 | Austin Industrial | Research & Forecast Commericial Real Estate ReportColliers International | Houston
 
Q4 2020 | Houston Office | Research & Forecast Report
Q4 2020 | Houston Office | Research & Forecast ReportQ4 2020 | Houston Office | Research & Forecast Report
Q4 2020 | Houston Office | Research & Forecast ReportColliers International | Houston
 
Q3 2020 | Austin Industrial | Research & Forecast Report
Q3 2020 | Austin Industrial | Research & Forecast ReportQ3 2020 | Austin Industrial | Research & Forecast Report
Q3 2020 | Austin Industrial | Research & Forecast ReportColliers International | Houston
 
Q3 2020 | Austin Office | Research & Forecast Report
Q3 2020 | Austin Office | Research & Forecast ReportQ3 2020 | Austin Office | Research & Forecast Report
Q3 2020 | Austin Office | Research & Forecast ReportColliers International | Houston
 
Q3 2020 | Houston Office | Research & Forecast Report
Q3 2020 | Houston Office | Research & Forecast ReportQ3 2020 | Houston Office | Research & Forecast Report
Q3 2020 | Houston Office | Research & Forecast ReportColliers International | Houston
 
Q2 2020 | Austin Office | Research & Forecast Report
Q2 2020 | Austin Office | Research & Forecast ReportQ2 2020 | Austin Office | Research & Forecast Report
Q2 2020 | Austin Office | Research & Forecast ReportColliers International | Houston
 
Q1 2020 | Austin Industrial | Research & Forecast Report
Q1 2020 | Austin Industrial | Research & Forecast ReportQ1 2020 | Austin Industrial | Research & Forecast Report
Q1 2020 | Austin Industrial | Research & Forecast ReportColliers International | Houston
 

More from Colliers International | Houston (20)

Q1 2022 Austin Industrial Report
Q1 2022 Austin Industrial ReportQ1 2022 Austin Industrial Report
Q1 2022 Austin Industrial Report
 
Q1 2022 Austin Office Market Report
Q1 2022 Austin Office Market ReportQ1 2022 Austin Office Market Report
Q1 2022 Austin Office Market Report
 
2021 Q3 Office Austin Report
2021 Q3 Office Austin Report2021 Q3 Office Austin Report
2021 Q3 Office Austin Report
 
Q2 2021 Austin Industrial Report
Q2 2021 Austin Industrial ReportQ2 2021 Austin Industrial Report
Q2 2021 Austin Industrial Report
 
Q2 2021 Austin Office Report
Q2 2021 Austin Office ReportQ2 2021 Austin Office Report
Q2 2021 Austin Office Report
 
Q1 2021 | Austin Industrial | Research & Forecast Commericial Real Estate Report
Q1 2021 | Austin Industrial | Research & Forecast Commericial Real Estate ReportQ1 2021 | Austin Industrial | Research & Forecast Commericial Real Estate Report
Q1 2021 | Austin Industrial | Research & Forecast Commericial Real Estate Report
 
Q1 2021 Austin Office Report
Q1 2021 Austin Office ReportQ1 2021 Austin Office Report
Q1 2021 Austin Office Report
 
Colliers Q4 2020 Austin Industrial Report
Colliers Q4 2020 Austin Industrial ReportColliers Q4 2020 Austin Industrial Report
Colliers Q4 2020 Austin Industrial Report
 
Q4 2020 Austin Office Report
Q4 2020 Austin Office ReportQ4 2020 Austin Office Report
Q4 2020 Austin Office Report
 
Q4 2020 | Houston Office | Research & Forecast Report
Q4 2020 | Houston Office | Research & Forecast ReportQ4 2020 | Houston Office | Research & Forecast Report
Q4 2020 | Houston Office | Research & Forecast Report
 
Q3 2020 | Austin Industrial | Research & Forecast Report
Q3 2020 | Austin Industrial | Research & Forecast ReportQ3 2020 | Austin Industrial | Research & Forecast Report
Q3 2020 | Austin Industrial | Research & Forecast Report
 
Q3 2020 | The Woodlands Office | Research Snapshot
Q3 2020 | The Woodlands Office | Research SnapshotQ3 2020 | The Woodlands Office | Research Snapshot
Q3 2020 | The Woodlands Office | Research Snapshot
 
Q3 2020 | Fort Bend | Submarket Snapshot
Q3 2020 | Fort Bend | Submarket SnapshotQ3 2020 | Fort Bend | Submarket Snapshot
Q3 2020 | Fort Bend | Submarket Snapshot
 
Q3 2020 | Austin Office | Research & Forecast Report
Q3 2020 | Austin Office | Research & Forecast ReportQ3 2020 | Austin Office | Research & Forecast Report
Q3 2020 | Austin Office | Research & Forecast Report
 
Q3 2020 | Houston Office | Research & Forecast Report
Q3 2020 | Houston Office | Research & Forecast ReportQ3 2020 | Houston Office | Research & Forecast Report
Q3 2020 | Houston Office | Research & Forecast Report
 
Q2 2020 | The Woodlands Office | Research Snapshot
Q2 2020 | The Woodlands Office | Research SnapshotQ2 2020 | The Woodlands Office | Research Snapshot
Q2 2020 | The Woodlands Office | Research Snapshot
 
Q2 2020 | E Fort Bend Commercial Real Estate Trends
Q2 2020 | E Fort Bend Commercial Real Estate TrendsQ2 2020 | E Fort Bend Commercial Real Estate Trends
Q2 2020 | E Fort Bend Commercial Real Estate Trends
 
Mid-Year 2020 | Houston Healthcare | Market Report
Mid-Year 2020 | Houston Healthcare | Market ReportMid-Year 2020 | Houston Healthcare | Market Report
Mid-Year 2020 | Houston Healthcare | Market Report
 
Q2 2020 | Austin Office | Research & Forecast Report
Q2 2020 | Austin Office | Research & Forecast ReportQ2 2020 | Austin Office | Research & Forecast Report
Q2 2020 | Austin Office | Research & Forecast Report
 
Q1 2020 | Austin Industrial | Research & Forecast Report
Q1 2020 | Austin Industrial | Research & Forecast ReportQ1 2020 | Austin Industrial | Research & Forecast Report
Q1 2020 | Austin Industrial | Research & Forecast Report
 

Recently uploaded

Call Girls In The Lalit New Delhi ❤️8860477959 Good Looking Escorts In 24/7 D...
Call Girls In The Lalit New Delhi ❤️8860477959 Good Looking Escorts In 24/7 D...Call Girls In The Lalit New Delhi ❤️8860477959 Good Looking Escorts In 24/7 D...
Call Girls In The Lalit New Delhi ❤️8860477959 Good Looking Escorts In 24/7 D...lizamodels9
 
Call Girls In Peeragarhi, Delhi↫8447779280↬Call Girls in Peeragarhi Delhi NCR
Call Girls In Peeragarhi, Delhi↫8447779280↬Call Girls in Peeragarhi Delhi NCRCall Girls In Peeragarhi, Delhi↫8447779280↬Call Girls in Peeragarhi Delhi NCR
Call Girls In Peeragarhi, Delhi↫8447779280↬Call Girls in Peeragarhi Delhi NCRasmaqueen5
 
Call Girls in Khan Market 9654467111 ESCORTS SERVICE
Call Girls in Khan Market 9654467111 ESCORTS SERVICECall Girls in Khan Market 9654467111 ESCORTS SERVICE
Call Girls in Khan Market 9654467111 ESCORTS SERVICESapana Sha
 
Eco-Efficient Living: Redefining Sustainability through Leech's Green Design ...
Eco-Efficient Living: Redefining Sustainability through Leech's Green Design ...Eco-Efficient Living: Redefining Sustainability through Leech's Green Design ...
Eco-Efficient Living: Redefining Sustainability through Leech's Green Design ...Newman George Leech
 
Purva Palm Hills Devanahalli, Bangalore E- Brochure.pdf
Purva Palm Hills Devanahalli, Bangalore E- Brochure.pdfPurva Palm Hills Devanahalli, Bangalore E- Brochure.pdf
Purva Palm Hills Devanahalli, Bangalore E- Brochure.pdffaheemali990101
 
8 Key Elements for Comfortable Farmland Living
8 Key Elements for Comfortable Farmland Living 8 Key Elements for Comfortable Farmland Living
8 Key Elements for Comfortable Farmland Living Farmland Bazaar
 
Ajmera Prive at Juhu, Mumbai E-Brochure.pdf
Ajmera Prive at Juhu, Mumbai  E-Brochure.pdfAjmera Prive at Juhu, Mumbai  E-Brochure.pdf
Ajmera Prive at Juhu, Mumbai E-Brochure.pdfManishSaxena95
 
A Brief History of Intangibles in Ad Valorem Taxation.pdf
A Brief History of Intangibles in Ad Valorem Taxation.pdfA Brief History of Intangibles in Ad Valorem Taxation.pdf
A Brief History of Intangibles in Ad Valorem Taxation.pdfTim Wilmath
 
SVN Live 4.22.24 Weekly Property Broadcast
SVN Live 4.22.24 Weekly Property BroadcastSVN Live 4.22.24 Weekly Property Broadcast
SVN Live 4.22.24 Weekly Property BroadcastSVN International Corp.
 
Partner With the Golden Life Community for Single Women Over 55
Partner With the Golden Life Community for Single Women Over 55Partner With the Golden Life Community for Single Women Over 55
Partner With the Golden Life Community for Single Women Over 55Ron Surz
 
MADHUGIRI FARM LAND BROCHURES (11)_compressed (1).pdf
MADHUGIRI FARM LAND BROCHURES (11)_compressed (1).pdfMADHUGIRI FARM LAND BROCHURES (11)_compressed (1).pdf
MADHUGIRI FARM LAND BROCHURES (11)_compressed (1).pdfknoxdigital1
 
Nanke Area Estate commercial ( Dir. Kat Kuo)
Nanke Area Estate commercial ( Dir. Kat Kuo)Nanke Area Estate commercial ( Dir. Kat Kuo)
Nanke Area Estate commercial ( Dir. Kat Kuo)jessica288382
 
Sobha Aranya Sector 80 Gurgaon E- Brochure.pdf
Sobha Aranya Sector 80 Gurgaon E- Brochure.pdfSobha Aranya Sector 80 Gurgaon E- Brochure.pdf
Sobha Aranya Sector 80 Gurgaon E- Brochure.pdffaheemali990101
 
Brigade Neopolis Kokapet, Hyderabad E- Brochure
Brigade Neopolis Kokapet, Hyderabad E- BrochureBrigade Neopolis Kokapet, Hyderabad E- Brochure
Brigade Neopolis Kokapet, Hyderabad E- Brochurefaheemali990101
 
The Omaxe State Dwarka Delhi-broucher.pdf.pdf
The Omaxe State Dwarka Delhi-broucher.pdf.pdfThe Omaxe State Dwarka Delhi-broucher.pdf.pdf
The Omaxe State Dwarka Delhi-broucher.pdf.pdfkratirudram
 
Experion Elements Sector 45 Noida_Brochure.pdf.pdf
Experion Elements Sector 45 Noida_Brochure.pdf.pdfExperion Elements Sector 45 Noida_Brochure.pdf.pdf
Experion Elements Sector 45 Noida_Brochure.pdf.pdfkratirudram
 
Call Girls in Nehru Place Delhi 💯Call Us 🔝8264348440🔝
Call Girls in Nehru Place Delhi 💯Call Us 🔝8264348440🔝Call Girls in Nehru Place Delhi 💯Call Us 🔝8264348440🔝
Call Girls in Nehru Place Delhi 💯Call Us 🔝8264348440🔝soniya singh
 

Recently uploaded (20)

Call Girls In The Lalit New Delhi ❤️8860477959 Good Looking Escorts In 24/7 D...
Call Girls In The Lalit New Delhi ❤️8860477959 Good Looking Escorts In 24/7 D...Call Girls In The Lalit New Delhi ❤️8860477959 Good Looking Escorts In 24/7 D...
Call Girls In The Lalit New Delhi ❤️8860477959 Good Looking Escorts In 24/7 D...
 
Call Girls In Peeragarhi, Delhi↫8447779280↬Call Girls in Peeragarhi Delhi NCR
Call Girls In Peeragarhi, Delhi↫8447779280↬Call Girls in Peeragarhi Delhi NCRCall Girls In Peeragarhi, Delhi↫8447779280↬Call Girls in Peeragarhi Delhi NCR
Call Girls In Peeragarhi, Delhi↫8447779280↬Call Girls in Peeragarhi Delhi NCR
 
9953056974 Low Rate Call Girls In Saket, Delhi NCR
9953056974 Low Rate Call Girls In Saket, Delhi NCR9953056974 Low Rate Call Girls In Saket, Delhi NCR
9953056974 Low Rate Call Girls In Saket, Delhi NCR
 
Call Girls in Khan Market 9654467111 ESCORTS SERVICE
Call Girls in Khan Market 9654467111 ESCORTS SERVICECall Girls in Khan Market 9654467111 ESCORTS SERVICE
Call Girls in Khan Market 9654467111 ESCORTS SERVICE
 
Eco-Efficient Living: Redefining Sustainability through Leech's Green Design ...
Eco-Efficient Living: Redefining Sustainability through Leech's Green Design ...Eco-Efficient Living: Redefining Sustainability through Leech's Green Design ...
Eco-Efficient Living: Redefining Sustainability through Leech's Green Design ...
 
Purva Palm Hills Devanahalli, Bangalore E- Brochure.pdf
Purva Palm Hills Devanahalli, Bangalore E- Brochure.pdfPurva Palm Hills Devanahalli, Bangalore E- Brochure.pdf
Purva Palm Hills Devanahalli, Bangalore E- Brochure.pdf
 
8 Key Elements for Comfortable Farmland Living
8 Key Elements for Comfortable Farmland Living 8 Key Elements for Comfortable Farmland Living
8 Key Elements for Comfortable Farmland Living
 
Ajmera Prive at Juhu, Mumbai E-Brochure.pdf
Ajmera Prive at Juhu, Mumbai  E-Brochure.pdfAjmera Prive at Juhu, Mumbai  E-Brochure.pdf
Ajmera Prive at Juhu, Mumbai E-Brochure.pdf
 
A Brief History of Intangibles in Ad Valorem Taxation.pdf
A Brief History of Intangibles in Ad Valorem Taxation.pdfA Brief History of Intangibles in Ad Valorem Taxation.pdf
A Brief History of Intangibles in Ad Valorem Taxation.pdf
 
Hot call girls in Moti Bagh🔝 9953056974 🔝 escort Service
Hot call girls in Moti Bagh🔝 9953056974 🔝 escort ServiceHot call girls in Moti Bagh🔝 9953056974 🔝 escort Service
Hot call girls in Moti Bagh🔝 9953056974 🔝 escort Service
 
SVN Live 4.22.24 Weekly Property Broadcast
SVN Live 4.22.24 Weekly Property BroadcastSVN Live 4.22.24 Weekly Property Broadcast
SVN Live 4.22.24 Weekly Property Broadcast
 
Call Girls in Mahavir Nagar whatsaap call US +919953056974
Call Girls in Mahavir Nagar  whatsaap call US  +919953056974Call Girls in Mahavir Nagar  whatsaap call US  +919953056974
Call Girls in Mahavir Nagar whatsaap call US +919953056974
 
Partner With the Golden Life Community for Single Women Over 55
Partner With the Golden Life Community for Single Women Over 55Partner With the Golden Life Community for Single Women Over 55
Partner With the Golden Life Community for Single Women Over 55
 
MADHUGIRI FARM LAND BROCHURES (11)_compressed (1).pdf
MADHUGIRI FARM LAND BROCHURES (11)_compressed (1).pdfMADHUGIRI FARM LAND BROCHURES (11)_compressed (1).pdf
MADHUGIRI FARM LAND BROCHURES (11)_compressed (1).pdf
 
Nanke Area Estate commercial ( Dir. Kat Kuo)
Nanke Area Estate commercial ( Dir. Kat Kuo)Nanke Area Estate commercial ( Dir. Kat Kuo)
Nanke Area Estate commercial ( Dir. Kat Kuo)
 
Sobha Aranya Sector 80 Gurgaon E- Brochure.pdf
Sobha Aranya Sector 80 Gurgaon E- Brochure.pdfSobha Aranya Sector 80 Gurgaon E- Brochure.pdf
Sobha Aranya Sector 80 Gurgaon E- Brochure.pdf
 
Brigade Neopolis Kokapet, Hyderabad E- Brochure
Brigade Neopolis Kokapet, Hyderabad E- BrochureBrigade Neopolis Kokapet, Hyderabad E- Brochure
Brigade Neopolis Kokapet, Hyderabad E- Brochure
 
The Omaxe State Dwarka Delhi-broucher.pdf.pdf
The Omaxe State Dwarka Delhi-broucher.pdf.pdfThe Omaxe State Dwarka Delhi-broucher.pdf.pdf
The Omaxe State Dwarka Delhi-broucher.pdf.pdf
 
Experion Elements Sector 45 Noida_Brochure.pdf.pdf
Experion Elements Sector 45 Noida_Brochure.pdf.pdfExperion Elements Sector 45 Noida_Brochure.pdf.pdf
Experion Elements Sector 45 Noida_Brochure.pdf.pdf
 
Call Girls in Nehru Place Delhi 💯Call Us 🔝8264348440🔝
Call Girls in Nehru Place Delhi 💯Call Us 🔝8264348440🔝Call Girls in Nehru Place Delhi 💯Call Us 🔝8264348440🔝
Call Girls in Nehru Place Delhi 💯Call Us 🔝8264348440🔝
 

2014 Houston Economic Outlook

  • 1. Houston Ranked in TOP 10 “Best Cities for Job Growth” HOUSTON MSA EMPLOYMENT EXEC U T I V E S U M M A RY JOBS GAINED 2013 82,000 2012 97,700 2011 75,800 HOUSTON UNEMPLOYMENT PERCENT (%) 04/2014 4.6 04/2013 5.9 04/2012 6.6 HOUSTON MSA POPULATION IN MILLIONS GROWTH (%) 2014 6.4 2.2 2013 6.3 2.0 2012 6.2 2.3 ENERGY: OIL & NATURAL GAS WTI CRUDE OIL: PER BARREL 06/2014 $105.09 06/2013 $95.82 06/2012 $84.10 06/2011 $105.93 NATURAL GAS: PER MMBtu 06/2014 $4.61 06/2013 $3.94 06/2012 $2.37 06/2011 $4.65 IMPORT / EXPORT TRADE HAS AIR FREIGHT: IN MILLION LBS. 2013 914.2 2012 924.2 2011 934.2 2010 882.5 PHA TOTAL TONNAGE (short tons): IN MILLION TONS 2013 35.8 2012 35.1 2011 33.5 2010 28.8 Houston ranked among the top-performing U.S. metros in 2013 and continues to be among the top 10 metros leading the nation in population and job growth in 2014. Houston is once again making headlines as having one of the healthiest economies in the U.S. In July 2014, Forbes published its list of “Best Cities for Job Growth”, and Houston was in the top 10. Further, Texas dominated the top 10 with ve metros, which are expected to have annual job growth of at least 3.5% in 2014. As expected, a large majority of the jobs Houston gained are related to the energy sector; however, Houston is also a top 10 city for STEM occupations, jobs requiring a degree in science, technology, engineering and math related subjects. In June 2014, Forbes ranked Houston in the top 10 for companies with the greatest number of STEM positions currently open with 10,278 positions listed. Houston also made Forbes’ list of “The Top 10 Cities For Relocation”, with the highest gains in Engineering and Operations jobs. HOUSTON SAN JACINTO MONTGOMERY HARRIS WALLER AUSTIN LIBERTY CHAMBERS FORT BEND BRAZORIA GALVESTON HOUSTON, TEXAS METRO AREA DETAIL Houston’s economic base is comprised of a variety of industries led by the energy sector, which accounts for just over 50 percent of Houston’s employment. Houston is known as the “Energy Capital of the World”, and is home to more than 5,000 energy related companies. It’s no surprise that Texas is the #1 ranked U.S. state by the U.S. Energy Information Administration (EIA) in total energy production, and the production of crude oil, natural gas, and electricity production. Texas ranks 6th in coal production. Texas is home to several shale plays and one of those is the Eagle Ford, which produces more than 1 million barrels of oil equivalent per day, or 7 billion cubic feet equivalent per day and that production level has helped to increase local employment in the industry. Houston’s strategic location and core strengths, including an expanding energy sector, strong import/export trade activity, cutting-edge medical advancements, and technological breakthroughs across industries, uniquely position it to play a vital role in meeting national and global market demands. At a time of unprecedented geopolitical demographic shifts aecting markets worldwide, Houston stands as a leader among U.S. metros.
  • 2. HOUSTON ECONOMIC OUTLOOK PAGE 2 Population Growth HOUSTO N P O P U L AT I O N AS OF JULY 1 2013 2,195,914 2012 2,160,712 2011 2,127,412 2010 2,102,587 Houston ranks among the leading metropolitan areas in the U.S., and is the fourth largest city and the fth largest Metropolitan Statistical Area (MSA) in the nation. The U.S. Census Bureau announced that the Houston MSA, which consists of 10 counties, ranked rst in the nation for population growth between 2000 and 2010 when the last census was taken. During that time the Houston MSA increased an impressive 26.1 percent, from 4.7M to 5.9M residents. Since then, Houston’s MSA has added close to 400,000 residents. On a more long-term basis, demographers project strong population growth for the area over the next thirty years as domestic and international migration trends favor Houston’s geographical, cultural, and economic strengths. According to the U.S. Census Bureau, Houston had a net gain of more than 35,000 new residents in 2013, second only to New York. The 2010 U.S. Census also showed a dramatic increase of 23.5 percent in Houston metro area households from 1.7M in 2000 to 2.1M in 2010. The average household income for the metro area was estimated at $76,301 in 2009, with a 11.9 percent projected increase to $85,409 by 2014. The median household income was estimated at $53,942 in 2010, an annual decrease of 0.4 percent from $54,146 in 2009. By comparison, the national income levels fell below the Houston market, with 2010 U.S. household median income at $50,046, an annual decrease of 0.3 percent from $50,221 in 2009. As of June 2014, the average annual income for employees on private non-farm payrolls in the Houston MSA was $52,615, which was slightly higher than the $52,438 average annual income for individuals in the New York-Northern New Jersey-Long Island metro. HOUSTO N TOP 5 F O RT U N E 5 0 0 NATIONAL RANK COMPANY REVENUE in millions 6 PHILLIPS 66 $161.2 47 CONOCO PHILLIPS $59.4 56 ENTERPRISE PRODUCTS PARTNERS $47.7 63 SYSCO CORP $44.4 70 PLAINS GP HOLDINGS $42.3 Houston ranked 2nd among U.S. cities with the most Fortune 500 headquarters with twenty-six companies on the 2014 list. Houston’s strong economic base continues to be a key factor driving both domestic and international migration trends. Houston ranked 2nd among U.S. cities with the most Fortune 500 headquarters with twenty-six (26) companies on the 2014 list, following New York, with a total of forty-seven (47). Statewide, Texas was the No. 2 ranking state with fty-two (52) companies on the list, after a tie by New York and California, each states having fty-four (54) companies on the list. All but three (3) of the Houston companies on the list are in the energy industry. Locally based Phillips 66 took the number 6 spot on the list of 500 companies, with $161.18 billion in revenue. Houston area residents are well-educated, with the majority of the population over 25 years of age holding a high school diploma and residents with college/graduate educational studies outnumbering those with less than a high school education. This high level of educational achievement is not surprising given Houston’s numerous nationally recognized colleges and universities, as well as technical and trade schools, including Rice University, University of Houston, University of St. Thomas, Texas Southern University, Houston Baptist University, Baylor College of Medicine, San Jacinto College, Lone Star College, and Houston Community College. Rice University ranks in the top 20 in U.S. News World Reports National University Rankings 2014 guide to America’s best colleges. In the No.18 spot, it is the only Texas college in the top 20. Bolstered by above-average demographic trends and a strong base of diverse industries, Houston is well-positioned to compete in today’s global markets. Long recognized as the energy capital of the world, with every major energy company represented locally, Houston now stands as a global example of economic diversity. The area is home to a thriving base of industries including medical/biomedical technology, global trade (particularly airborne and waterborne domestic/international cargo), aeronautics, plastics manufacturing, electronics, computers, software design and integrated power. SOURCES: : U.S. Census Bureau, Greater Houston Partnership; Fortune Magazine
  • 3. HOUSTON ECONOMIC OUTLOOK Employment Sector S E L EC T M A J O R A R E A EMPLOYERS PAGE 3 Houston’s employment sector weathered the last recession better than most major metro areas. The downturn here was short-lived and the Houston MSA began recovering jobs sooner than most, recovering more than the jobs it lost in the recession. Between June 2013 and June 2014, Houston added more than 87,500 jobs, which increased the job growth by 3.1%. Among the largest populated U.S. cities, Houston out-performed all but Dallas, and Texas ranked 4th. Texas experienced a 3.3% increase adding 370,300 jobs, while the United States as a whole saw a 1.9% increase adding 2.6 million jobs. Houston was ranked 2nd in the U.S. when looking at the overall percent change in employment in the 10 most populous U.S. major metros as noted in the chart below. Natural gas prices have remained relatively static due in part to the development and perfection of hydraulic fracturing of shale formations for natural gas production. As natural gas is the primary material used in the petrochemical industry, the region looks to gain new capital investment, plants and jobs as one-half of the petrochemical industry jobs in Texas are in the Houston region. This type of job growth is evident as Houston’s Mining and Logging industry sector had one of the largest annual changes in employment at 5.8%, boosted by oil gas extraction. Additional Houston employment industry sectors that reported annual growth above 5.0% include: Nondurable goods Manufacturing at 6.4%, Wholesale Trade at 5.0%, Architectural, Engineering Related Services at 10.1%, Educational Services at 6.8%, and Arts, Entertainment Recreation jumped by 11.7% Houston was ranked 2nd in the U.S. when looking at the overall percent change in employment in the 10 most populous major metros. PE RC E N T C H A N G E I N E M P LOYMENT JUNE 2013 TO JUNE 2014 4.0% 3.5% 3.0% 2.5% 2.0% 1.5% 1.0% 0.5% 0.0% DALLAS HOUSTON MIAMI ATLANTA BOSTON LOS ANGELES UNITED STATES NEW YORK WASHINGTON PHILIDELPHIA CHICAGO SOURCES: U.S. Bureau of Labor Statistics
  • 4. HOUSTON ECONOMIC OUTLOOK PAGE 4 Strong Business Climate Houston has long been recognized among the most competitive U.S. cities for corporate relocation and expansion activity. In its March 2014 issue, Site Selection ranked Houston #2 for Tier One New and Expanded Facilities in 2013 of MSA’s with population over 1 million, securing 325 corporate facility expansion projects. Houston was last years winner. In addition, Chief Executive Magazine (for the tenth straight year) named Texas as the “Best State for Business”, in which Houston’s Energy Industry played a huge part. In Summer 2014, Forbes named Houston #1 for “Most Competitive Metro in America” and “Best City for Manufacturing”. In addition to its diverse growth industries and educated/skilled workforce, a key factor underscoring Houston’s business appeal is the fact that it is one of the least expensive major U.S. cities in which to conduct business. Signi“cant bene“ts include the absence of state or city income taxes, no state property tax, as well l as an exceptionally low cost of livin living index. HOUSTO N - S U G A R L A N D - B AY TOW N MSA M S A 2 0 1 3 W BIL GR GROSS AREA PRODUCT $480.6 BILLION LLIO As a major transportation hub with two major airports, a world-renowned port, and superior rail and road infrastructure, Houston facilitates the interconnection of global business locations. Business alliances with major U.S. and international markets is further enhanced by the presence of 92 foreign consulate offices in Houston. In 2013, Houston ranked third in the U.S. – following New York and Los Angeles – in foreign consulate representation. Houston’s ability to foster continued expansion in future-growth industries responsible for generating high quality, well-paid jobs across all business sectors has placed it in the top tier among U.S. cities. With its numerous business advantages, Houston is well-positioned HOUSTON SEATTLE DENVER LOS ANGELES CHICAGO NEW YORK ATLANTA MIAMI to successfully compete in today’s global marketplace. TRAV E L T I M E F R O M H O USTON CITY DISTANCE AIR RAIL TRUCK in hours Atlanta 793 miles 2.5 66 13 Chicago 1,090 miles 2.5 86 18 Denver 1,119 miles 2.5 60 17 Los Angeles 1,550 miles 3.5 90 24 Miami 1,188 miles 2.5 NA 20 New York 1,631 miles 2.5 NA 20 Seattle 2,443 miles 5.0 60 36 SOURCES: mapquest.com, Official Airlines Guide, BNSF Railway, Union Pacific Railroad, and Greater Houston Parntership Research Department BAY T B AN OSS ON Port of Houston Ranked #1 U.S. Foreign Tonnage Ranked #2 U.S. Total Cargo Value Ranked #7 U.S. Total Container Energy Industry Global Energy Capital Over 5,000 rms in the region 40 percent of the national’s base petrochemical capacity Airport System Ranked #6 U.S. Airport Passengers Ranked #9 Global Aircraft Movement 50.0M Passengers in 2013 914.2M lbs of Air Freight in 2013 Texas Medical Center World’s Largest Medical Complex (1,345 Acres) 106K Employees 54 Member Institutions 7.2M Patients Annually 16K International Patients Annually NASA / Johnson Space Center 1,700-acre Complex Major Employers Boeing Company Lockheed Martin Jacobs Engineering United Space Alliance SOURCES: Federal Reserve Bank of Dallas; Port of Houston Authority; Fly2Houston.com; Greater Houston Partnership; Perryman Report; NASA Acquisition Internet Service (NAIS) * Statewide Economic Impact
  • 5. HOUSTON ECONOMIC OUTLOOK PAGE 5 Global Energy Capital Houston is internationally recognized as the global energy capital, with virtually every segment of the energy industry represented by over 5,000 rms in the region. It is also known as the global center for integrated power, a fast-growing new sector of the energy industry. In just over a decade, the number of Houston-based energy trading companies has tripled, with petrochemical capacity in the area nearly four times larger than the nearest competing U.S. site. All major oil and gas companies have extensive operations in the area, including ExxonMobil, Chevron, BP America, Citgo, ConocoPhillips, Shell Oil Company, BHP Billiton, El Paso Corp., TOTAL, BG Group, Devon Energy, LyondellBasell, Halliburton, Occidental Petroleum, Petrobras, Marathon Oil, Anadarko Petroleum, Transocean, Apache, Hess Corporation, Neweld Exploration, Enterprise Products Partners, and Plains All American Pipeline. $/bbl H I STO R I C C RU D E O I L P R I C ES June 2014: $105.79/bbl June 2008: $133.93/bbl 1992 1994 1996 1998 2000 2002 2004 2006 2008 2010 2012 2014 $140 $120 $100 $80 $60 $40 $20 $0 Rig Count U . S . R OTA RY R I G C O U N TS June 2014: 1,861 June 2011: 1,972 1992 1994 1996 1998 2000 2002 2004 2006 2008 2010 2012 2014 2100 1900 1700 1500 1300 1100 900 700 $0 $/MMBtu H I STO R I C N AT U R A L G A S P R I C ES June 2014: $4.64/MMBtu June 2008: $10.82/MMBtu 1992 1994 1996 1998 2000 2002 2004 2006 2008 2010 2012 2014 $12 $10 $8 $6 $4 $2 $0 SOURCES: Energy Information Administration; West Texas Intermediate; Baker Hughes; Greater Houston Partnership According to a June 2014 British Petroleum statistical review of world energy, global energy consumption growth in 2013 accelerated, despite a stagnant global economy. According to the study, global primary energy consumption increased by 2.3% in 2013, an increase over the 1.8% in 2012, but below the 10-year average of 2.5%. Emerging economies were responsible for nearly 80% of the net growth and consumption growth in North America was above average. Oil remains the world’s leading fuel, at 32.9% of global energy consumption. Natural Gas’s share of global primary energy consumption is 23.7%. Even though world natural gas consumption grew only 1.4% in 2013, below the historical average of 2.6%, consumption growth was above average North America. The U.S. Energy Information Administration’s (EIA) Annual Energy Outlook released in April 2014 indicates overall U.S. energy consumption will grow at an average annual rate of 0.9% from 2013 through 2014. West Texas Intermediate crude oil prices increased from $95.77 per barrel in June 2013 to $105.79 per barrel in June 2014 and predicts the price to fall to $95.17 per barrel in 2015. The Henry Hub natural gas prices are projected to average $4.64 per MMBtu in 2015 decreasing from to $4.58 per MMBtu by 2014. The U.S. rotary rig count increased annually by 5.7% to 1,861 rigs in June 2014, from 1,761 in June 2013.
  • 6. HOUSTON ECONOMIC OUTLOOK Petrochemical Plastics Industry PAGE 6 Texas is the largest chemical-producing state, generating $145 billion in annual revenues. Houston is a global leader in manufacturing petrochemicals, with the Houston Ship Channel recognized as the largest petrochemical complex in the U.S. The area is home to more than 125 rening and petrochemical manufacturing companies operateing the region’s largest petrochemical plants including; Bayport Industrial District, Battleground Industrial Complex, Bayport Shipping Terminal, and the Houston Ship Channel. Today, the chemical industry employs more than 100,000 workers in Texas, nearly 16.0 percent of the industry's total U.S. workforce, according to Labor Department gures. About half of those jobs are in the Houston region, spread across more than 430 chemical plants and reneries. In 2013, Texas led the nation in crude oil production, with 27 petroleum reneries producing over 5.1 million barrels of crude oil per day, 28.8% of total U.S. rening capacity. Houston accounts for over 40 percent of the national’s base petrochemical capacity. The discovery of shale rock formations, rich with natural gas and natural gas liquids, has had a huge impact on the region’s economy as many of the major energy companies headquartered in Houston have expanded into natural gas production. Chemical companies are racing to make investments to take advantage of low natural gas prices, since natural gas is used as a feedstock in chemical production. Over the past several years, oil companies have expanded quickly to tap shale oilelds in Texas, increasing the states percentage of US oil production. Sanchez Energy Corp recently paid $256 million in 2013 for Hess Corp.’s Eagle Ford assets and has recently announced they have entered an agreement to purchase Royal Dutch Shell’s Eagle Ford assets for $639 million. According to a new study from the University of Texas at San Antonio’s Institute for Economic Development, oil and gas development in the Eagle Ford Shale has more than a $60 billion economic impact on the local South Texas economy and over 116,000 jobs are supported in the 20 county area impacted by the play. MAJOR HOUSTO N R E G I O N C H E M I C A L P L ANTS Air Liquide USA Air Products Baker Petrolite Corpo ration BASF Corpo ration Bayer Material Scienc e BP Texas Cit y Celanese Chevron Phillips Chemical Dow Chemical Company E.I. du P ont de Nemou rs Company ExxonMobile Chemical Goodyear Tire Rubbe r Company INEOS Ole„ns P olymers LyondellBasell Industries Lubrizol Corpor ation OxyVinyls, LP Rohm and Hass T exas Shell Chemica l Solvay Chemicals, Inc. Total Petrochemicals USA ENERGY I N D UST RY EXPANSIONS, ACQUISITIONS NEW INVESTMENTS Aug 2014 EOG Resources increases Eagle Ford reserve p otential 45% Aug 2014 Houston oil company grabs assets in East Texas f or $278 million Aug 2014 Small gas-to-liquids plant planned for former H ouston power plant site Aug 2014 Houston energy startup lands $600M investment. Aug 2014 North Carolina energy engineering/construction c onsulting rm opens shop in Houston Aug 2014 Pattern Development acquires Texas wind farm d evelopment July 2014 Fast-growing Tennessee energy company to open d owntown Houston office July 2014 Los Angeles MLP acquires Houston energy company f or $1.6 billion July 2014 ExxonMobil restarts Pegasus pipeline in Texas July 2014 Texas’ oil and gas industry expands to near-record levels July 2014 New pipe mill near San Antonio will serve Eagle Ford July 2014 TETRA’s gas compression arm to make $825M a cquisition July 2014 Shell announces new Gulf of Mexico discovery May 2014 Energy MA hits 10-year high May 2014 Sanchez to buy Shell’s Eagle Ford assets in $ 639M deal May 2014 3-Freeport to buy Apache’s Gulf of Mexico assets a fter shale sale SOURCES: Energy Information Administration; Greater Houston Partnership SOURCES: Forbes; Houston and San Antonio Business Journal; Houston Chronicle
  • 7. HOUSTON ECONOMIC OUTLOOK e Port of Houston The Port of Houston’s market strength and strategic location represents a winning combination for business growth and increased industrial development. The economic impact of the Port of Houston is signicant, accounting for more than 1.1 million jobs and $179 billion of total economic activity in Texas. Business activities related to the port generate more than $4.5 billion in state and local tax revenue. Houston was ranked the No. 1 U.S. city for global trade by Global Trade magazine and according to a recent report by the U.S. Department of Commerce’s International Trade Administration, the Houston MSA is now the top U.S. market for exports based on 2013 statistics. The Port of Houston Authority (PHA) has planned signicant infrastructure improvements over the next few years to accommodate larger vessels and increased cargo resulting from the Panama Canal expansion. More than $220 million has been allocated for capital improvement projects in 2013. Approximately $146 million is allocated to continued development and modernization of Bayport and Barbours Cut container terminals. In addition, about $5 million has been allocated for maintenance dredging and related improvements of the 52-mile Houston Ship Channel. The remaining capital budget will be used primarily for projects at the general cargo and bulk terminals in the Turning Basin area and port security. In addition, private industries have invested over $35 billion in capital improvements along the ship channel. The PHA handled more than 1.9 million cargo containers in 2013, for a total of 19.1 million tons, placing the Port of Houston in the No. 7 spot in the U.S. An immense network of interstate highways and railways connect the port with an inland market of approximately 100 million customers. Over 25 million square feet of distribution centers near the port and other centers are growing around the Houston metro area in response to the port’s global trade and commerce. P O R T O F H O U STO N AU T H O R I T Y TOTAL TONNAGE HANDLED 2010-2013 40.00 35.00 30.00 25.00 20.00 15.00 10.00 5.00 0 2010 2011 2012 2013 Short Tons (in millions) PAGE 7
  • 8. HOUSTON ECONOMIC OUTLOOK Houston’s location in the south central U.S. strategically places it equidistant from the nation’s major population centers – New York (1,631 miles) and Los Angeles (1,550 miles). Connection to major national and international locations is facilitated through Houston’s excellent transportation infrastructure which includes the George Bush Intercontinental Airport, William P. Hobby Airport, Ellington Field, the Port of Houston, and the well-integrated mainline railroads and trucking system serving the area. In the Houston MSA, an extensive freeway system spans 575.5 miles and are continually being expanded as the regions population grows. Between 2003 and 2008, a boom in new construction projects for Houston’s major freeways and tollways signi–cantly improved mobility and accessibility for the region. Expansion of the Katy Freeway (Interstate 10) was one of the most signi–cant projects completed in October 2008, with other key improvement projects including Loop 610/West Loop, Southwest Freeway (U.S. Highway 59 South), Grand Parkway (State Highway 99), North Freeway (Interstate 45 North), Eastex Freeway (U.S. Highway 59 North), Crosby Freeway (U.S. Highway 90), Sam Houston Tollway (Beltway 8), and Westpark Tollway. New and existing projects in 2014 and beyond include the expansion of Hwy 290, IH 610 and U.S. Hwy 290 interchange, as well as Segment E and F of the Grand Parkway. The Houston-Galveston Area Council revised the 2035 and 2040 Regional Transportation Plans (RTP), which provides a 20-year capital projects improvement plan for area transportation, detailing capital priorities and projected expenditures. More than $61.1 billion of the $87.0 billion estimated cost for these projects is funded through toll revenues, property tax, and Metro sales tax. NASA/Johnson Space Center NASA’s Johnson Space Center (JSC) is a $1.8B complex occupying 1,700 acres, –rst established in 1961, and later renamed in 1973 in honor of the late President Lyndon B. Johnson, a native Texan. JSC is one of NASA’s largest research and development facilities and mission control for all U.S. manned space flight communications, including the International Space Station and Exploration Programs. From the early space exploration projects Gemini, Apollo and Skylab, came the historic moment when the –rst word from the moon was “Houston”, and deservedly so, as it took a 15,000-member team in Houston to develop, test and put into action what millions around the world watched on television in 1969. Since its inception, JSC continues to make signi–cant advances in science, aeronautics, technology, engineering and medicine. In 2013 JSC’s workforce represented over 15,000 jobs, including approximately 3,000 civil servants and 12,000 contractor personnel employed onsite or in facilities in the area. JSC’s top contractors include The Boeing Company, United Space Alliance, Lockheed Martin, Anadarko Industries, Jacobs Technology, Honeywell International, Bastion Technologies, Science Applications International Corporation (SAIC), Raytheon Technical Services, Oceaneering Space Systems, and Odyssey Space Research, among many others. The Mission Control Center at Johnson Space Center directs all space shuttle missions, including international space station assembly flights. MCC also manages all activity onboard the international space station. JSC serves as the lead NASA center for the International Space Station – a U.S.-led collaborative effort of 16 nations, and the largest, most powerful, complex human facility to ever operate in space. Mobility Infrastructure 2 0 3 5 RT P C A P I TA L P R I O R I T I ES ROADWAYS TRANSIT PED/BIKE SH99 Grand Pkwy $6.7B Bus Replacement $2.8B City of Houston $29.9M US 290 Corridor $3.7B North Corridor $1.6B Greenspoint $29.8M IH 45 South $1.5B Southeast Corridor 1.1B Galveston/Harris Co. $22.0M SH 288 $1.4B Northwest Corridor $1.1B City of La Porte $14.9M US 59 South $1.2B University Corridor $1.0B Westchase District $14.8M Beltway 8 $1.1B Southwest Commuter $0.7B City of Conroe $12.4M IH 610 $1.0B East End Corridor $0.7B Sims Bayou Trail $11.6M SH 146 $0.7B Uptown Corridor $0.6B ALL ROADWAYS $25.6B ALL TRANSIT $11.9B ALL PED/BIKE $0.3B 1961 PAGE 8
  • 9. HOUSTON ECONOMIC OUTLOOK PAGE 9 Airport System The Houston Airport System (HAS) is one of the world’s leading multi-airport facilities and includes George Bush Intercontinental Airport, William P. Hobby Airport, and Ellington Field. HAS ranked sixth nationally in passenger volume in 2013, carrying an impressive 50.9 million passengers and 914.2 million pounds of air freight. The Houston Airport System has a local economic impact of more than $27 billion annually. 1,000,000,000 900,000,000 800,000,000 700,000,000 600,000,000 500,000,000 400,000,000 GEORGE BUSH INTERCONTINENTAL AIRPORT/HOUSTON (IAH), situated twenty-three miles north of downtown Houston, is the nation’s 12th busiest airport serving 39.8 million passengers in 2013 and offering 200 domestic and international destinations, with nearly 650 daily departures including non-stop direct flights to major cities in Europe, Mexico, Latin America and Asia. IAH is served by 21 scheduled passenger airlines and numerous charter airlines. The airport is served by 12 all-cargo airlines handling more than 885 million pounds of cargo in 2013. Currently, IAH has —ve terminals, no takeoff and landing curfews, and ample land to expand its facilities as requirements demand. The scope and quality of IAH facilities make it one of the top U.S. airports for international air cargo traffic. WILLIAM P. HOBBY AIRPORT is located seven miles southeast of downtown Houston and is the nation’s 33rd busiest commercial airport, handling over 11 million passengers in 2013. Hobby Airport also serves as a major regional center for corporate and private aviation, with —ve passenger airlines offering scheduled service to approximately 117 U.S. destinations and 70 international destinations. There are 255 private aircraft based at Hobby, including 91 corporate jets and —ve —xed-base operators serving the airport. AIR CARGO A strong increase in domestic and international trade continues to drive activity at IAH where the 500,000-SF state-of-the-art Air Cargo Center handled over 885M pounds of cargo in 2013. With over 900 air freight-related businesses in the area, IAH is among the leading distribution hubs in the nation with a solid track record of growth and continued future expansion. SOURCES: Airport Council International; Houston Airport System 2013 2012 2011 2010 2009 2008 2007 2006 2005 2004 2003 2002 2001 2000 A I R F R E I G H T DOMESTIC INTERNATIONAL CARGO - IN POUNDS 300,000,000 International Domestic IAH Air Freight Statistics Trends IAH ranked 14th largest air cargo hub in the U.S. IAH is one of the fastest growing distribution hubs in the U.S. IAH 2013 air freight cargo exceeded 885M pounds. IAH has state-of-the-art facilities to globally transport time-sensitive products. Houston’s role as a major gateway for import-export trade is expected to continue expanding with the new Panama Canal lock open. IAH ranked #12 serving almost 40M passengers in 2013.
  • 10. HOUSTON ECONOMIC OUTLOOK PAGE 10 Texas Medical Center The Texas Medical Center (TMC) – the world’s largest medical center – represents one of Houston’s major economic drivers and core industries with an estimated regional annual economic impact of $15 billion. TMC is also one of Houston’s largest employers with 106,000 employees, including physicians, sc scientists, researchers and other advanced degree professionals in the life sciences. T E X A S M E D I C A L C E N T E R TMC Patient Care Institutions DePelchin Children’s Center The Menninger Clinic The University of Texas M.D. Anderson Cancer Center Texas Children’s Hospital Memorial Hermann Hospital System The Methodist Hospital St. Luke’s Episcopal Hospital Lyndon B. Johnson General Hospital Quentin Mease Community Hospital Ben Taub General Hospital The Institute for Rehabilitation and Research The Hospice at the Texas Medical Center Texas Heart Institute Shriners Hospitals for Children – Houston Veterans Affairs Medical Center in Houston TMC Academic Research Institutions Sabin Vaccine Institute The University of Houston – Victoria School of Nursing Texas Children’s Hospital Neurological Research Institute Baylor College of Medicine The University of Texas Health Science Center at Houston The University of Texas M.D. Anderson Cancer Center University of Houston College of Pharmacy Rice University Texas AM University Health Science Center Prairie View AM University College of Nursing Texas Woman’s University Institute of Health Sciences Texas Southern University College of Pharmacy and Health Sciences Harris County Psychiatric Center Houston Academy of Medicine The University of Texas M.D. Anderson Cancer Center in the Texas Medical Center, ranked #2 in U.S. News World Reports “Americas Best Hospitals 2014-2015” for cancer care. The internationally-renowned, 1,345-acre TMC is the world’s largest medical complex with 41 member institutions, including leading medical, academic and research institutions, all of which are non-pro ĹĄt and dedicated to the highest standards of research, education and patient and preventive care. Over 50,000 students, including more than 20,000 international students, are affiliated with TMC, including high school, college and health profession graduate programs. More than 7.2 million patients visit TMC each year, including approximately 16,000 international patient visits. In addition to the medical facilities and institutions of higher learning, TMC is also home to more than 290 professional buildings. Overall, the complex covers over 18 miles of public and private streets and roadways, with 45.8M SF of existing patient, education, and research space. TMC has continued to grow and expand over the past several decades with the majority of growth occurring in the past ten years. The Center is located in the 110-acre University of Texas Research Park, a joint effort between the University of Texas Health Science Center, M.D. Anderson, and General Electric Healthcare. TMC spends billions of dollars on research and charity care annually. KATY GALLERIA BELLAIRE SUGAR LAND RICHMOND PASADENA LEAGUE CITY IAH HOU EFD CBD H 610 290 249 90 59 59 610 288 225 146 I-45 I-45 I-10 I-10 8 8 8 8 SHIP CHANNEL GAL BAY 6 TEXAS MEDICAL CENTER LOCATION Texas Medical Center World’s Largest Medical Complex (1,345 Acres) 106,000 Employees 54 Member Institutions 7.2M Patients Annually 5,000 Physicians 49,000 Life Science Students $960 million in Charity Care Houston MSA Health Care 115 Hospitals 19,830 Hospital Beds 13,360 Physicians 299,600 Health Care Social Assistance jobs 3.5% annual employment growth
  • 11. HOUSTON ECONOMIC OUTLOOK Biosciences Biotechnology PAGE 11 Biotechnology and the life science industry continue expanding in the Houston region with more than 100 institutions and companies attracting over $1.8B in research and development funding annually. Since 2005, the Texas Emerging Technology Fund has allocated more than $205 million in funds to 145 early-stage companies, and $220 million in grant matching and research superiority funds to Texas universities. Since 2010, the state-funded Cancer Prevention and Research Institute of Texas has awarded $382 million in cancer research, commercialization and prevention grants. Leading research efforts in the area represent established and emerging industries, including nanotechnology, pharmaceuticals, nutraceuticals, genetics/genomics, biodefense and infectious diseases, stem cell research, and oncology. Long known for its research-centric Texas Medical Center (TMC), the Houston region is gaining momentum in the development and commercialization of products ensuring its place as a major biotechnology and life sciences cluster. Public and private sector support, including investments by entrepreneurs and venture capitalists, will continue to be crucial in creating the necessary infrastructure to facilitate the entrance of both established and start-up private companies committed to biotechnology. B I O S C I E N C ES I N 2 0 1 3 -2 0 1 4 FEB 2014 DNAtrix snags $10.8 million from Texas cancer-research institute. FEB 2014 Cancer Prevention and Research Institute of Texas (CPRIT) awards $22.9 million in research grants to DNAtrix Inc., The University of Texas Medical Branch at Galveston, Baylor College of Medicine, Rice University, The University of Texas Health Science Center at Houston and the University of Texas M.D. Anderson Cancer Center. JAN 2014 Early studies show microspheres could be key in preventing bone infections after joint replacement. JAN 2014 Houston Biotech company closes major funding round. OCT 2013 New company to manufacture heart pumps in Houston. HOUSTON AREA BIOTECHNOLOGY BUSINESS PARKS Outside of the TMC, the 1,000-acre Research Forest located in The Woodlands (30 miles north of downtown Houston) is a long-standing major research center designed speci”cally for scienti”c, research and biotechnology companies. More recently established business parks/organizations geared towards biotechnology commercialization in the Houston region include the Genesis Biotechnology Park and BioHouston, Inc. Genesis Biotechnology Park comprises 16 innovative life science companies and researchers located just south of the TMC. The Park was developed to increase venture capital interests in Houston and is committed to supporting start-up companies by providing tenant options for shared office, wet laboratory space (including equipment), and flexible leases. BioHouston, Inc., a non-pro”t corporation founded by Houston-area academic/research institutions, is actively leading a broad-based effort to strengthen Houston’s position as a global competitor in life science and biotechnology. BioHouston’s Resource Center, the ”rst incubator facility serving the Houston life sciences community, is housed at the Genesis Biotechnology Park, adding a key component to ongoing commercialization efforts. The Center is speci”cally designed to serve start-up biotech and life sciences companies by offering access to shared laboratory space, research resources, and networking opportunities with a community of biotech entrepreneurs. From its base of cutting-edge research, Houston has taken the next step in its evolution as a primary life science cluster by creating an environment conducive for private companies to develop and market life science products. With key initiatives in place to bring together the public and private sectors, as well as signi”cant improvements to the scope of services and incentives available to private companies, the infrastructure is in place to capitalize on Houston’s strong research base and convert it into commercialized product. With this process now in motion, the biotech future in Houston looks bright.
  • 12. e Colliers Advantage ENTERPRISING CULTURE Colliers International is a leader in global real estate services, de ned by our spirit of enterprise. Through a culture of service excellence and a shared sense of initiative, we integrate the resources of real estate specialists worldwide to accelerate the success of our partners. When you choose to work with Colliers, you choose to work with the best. In addition to being highly skilled experts in their eld, our people are passionate about what they do. And they know we are invested in their success just as much as we are in our clients’ success. This is evident throughout our platform—from Colliers University, our proprietary education and professional development platform, to our client engagement strategy that encourages cross-functional service integration, to our culture of caring. We connect through a shared set of values that shape a collaborative environment throughout our organization that is unsurpassed in the industry. That’s why we attract top recruits and have one of the highest retention rates in the industry. Colliers International has also been recognized as one of the “best places to work” by top business organizations in many of our markets across the globe. Colliers International offers a comprehensive portfolio of real estate services to occupiers, owners and investors on a local, regional, national and international basis. LISA R. BRIDGES Director of Market Research | Houston Direct +1 713 830 2125 Fax +1 713 830 2118 lisa.bridges@colliers.com COLLIERS INTERNATIONAL 1233 W. Loop South Suite 900 Houston, Texas 77027 Main +1 713 222 2111 $75B TRANSACTION VALUE 1.46B * SF UNDER MANAGEMENT $2.1B IN REVENUE 485 OFFICES 15,800 PROFESSIONALS STAFF SIOR 238 ACCREDITED MEMBERS 63 COUNTRIES *2013 stats include office, industrial, and retail properties under management. Residential properties are excluded from this total. Accelerating success. HOUSTON ECONOMIC OUTLOOK *Information herein has been obtained from sources deemed reliable, however its accuracy cannot be guaranteed