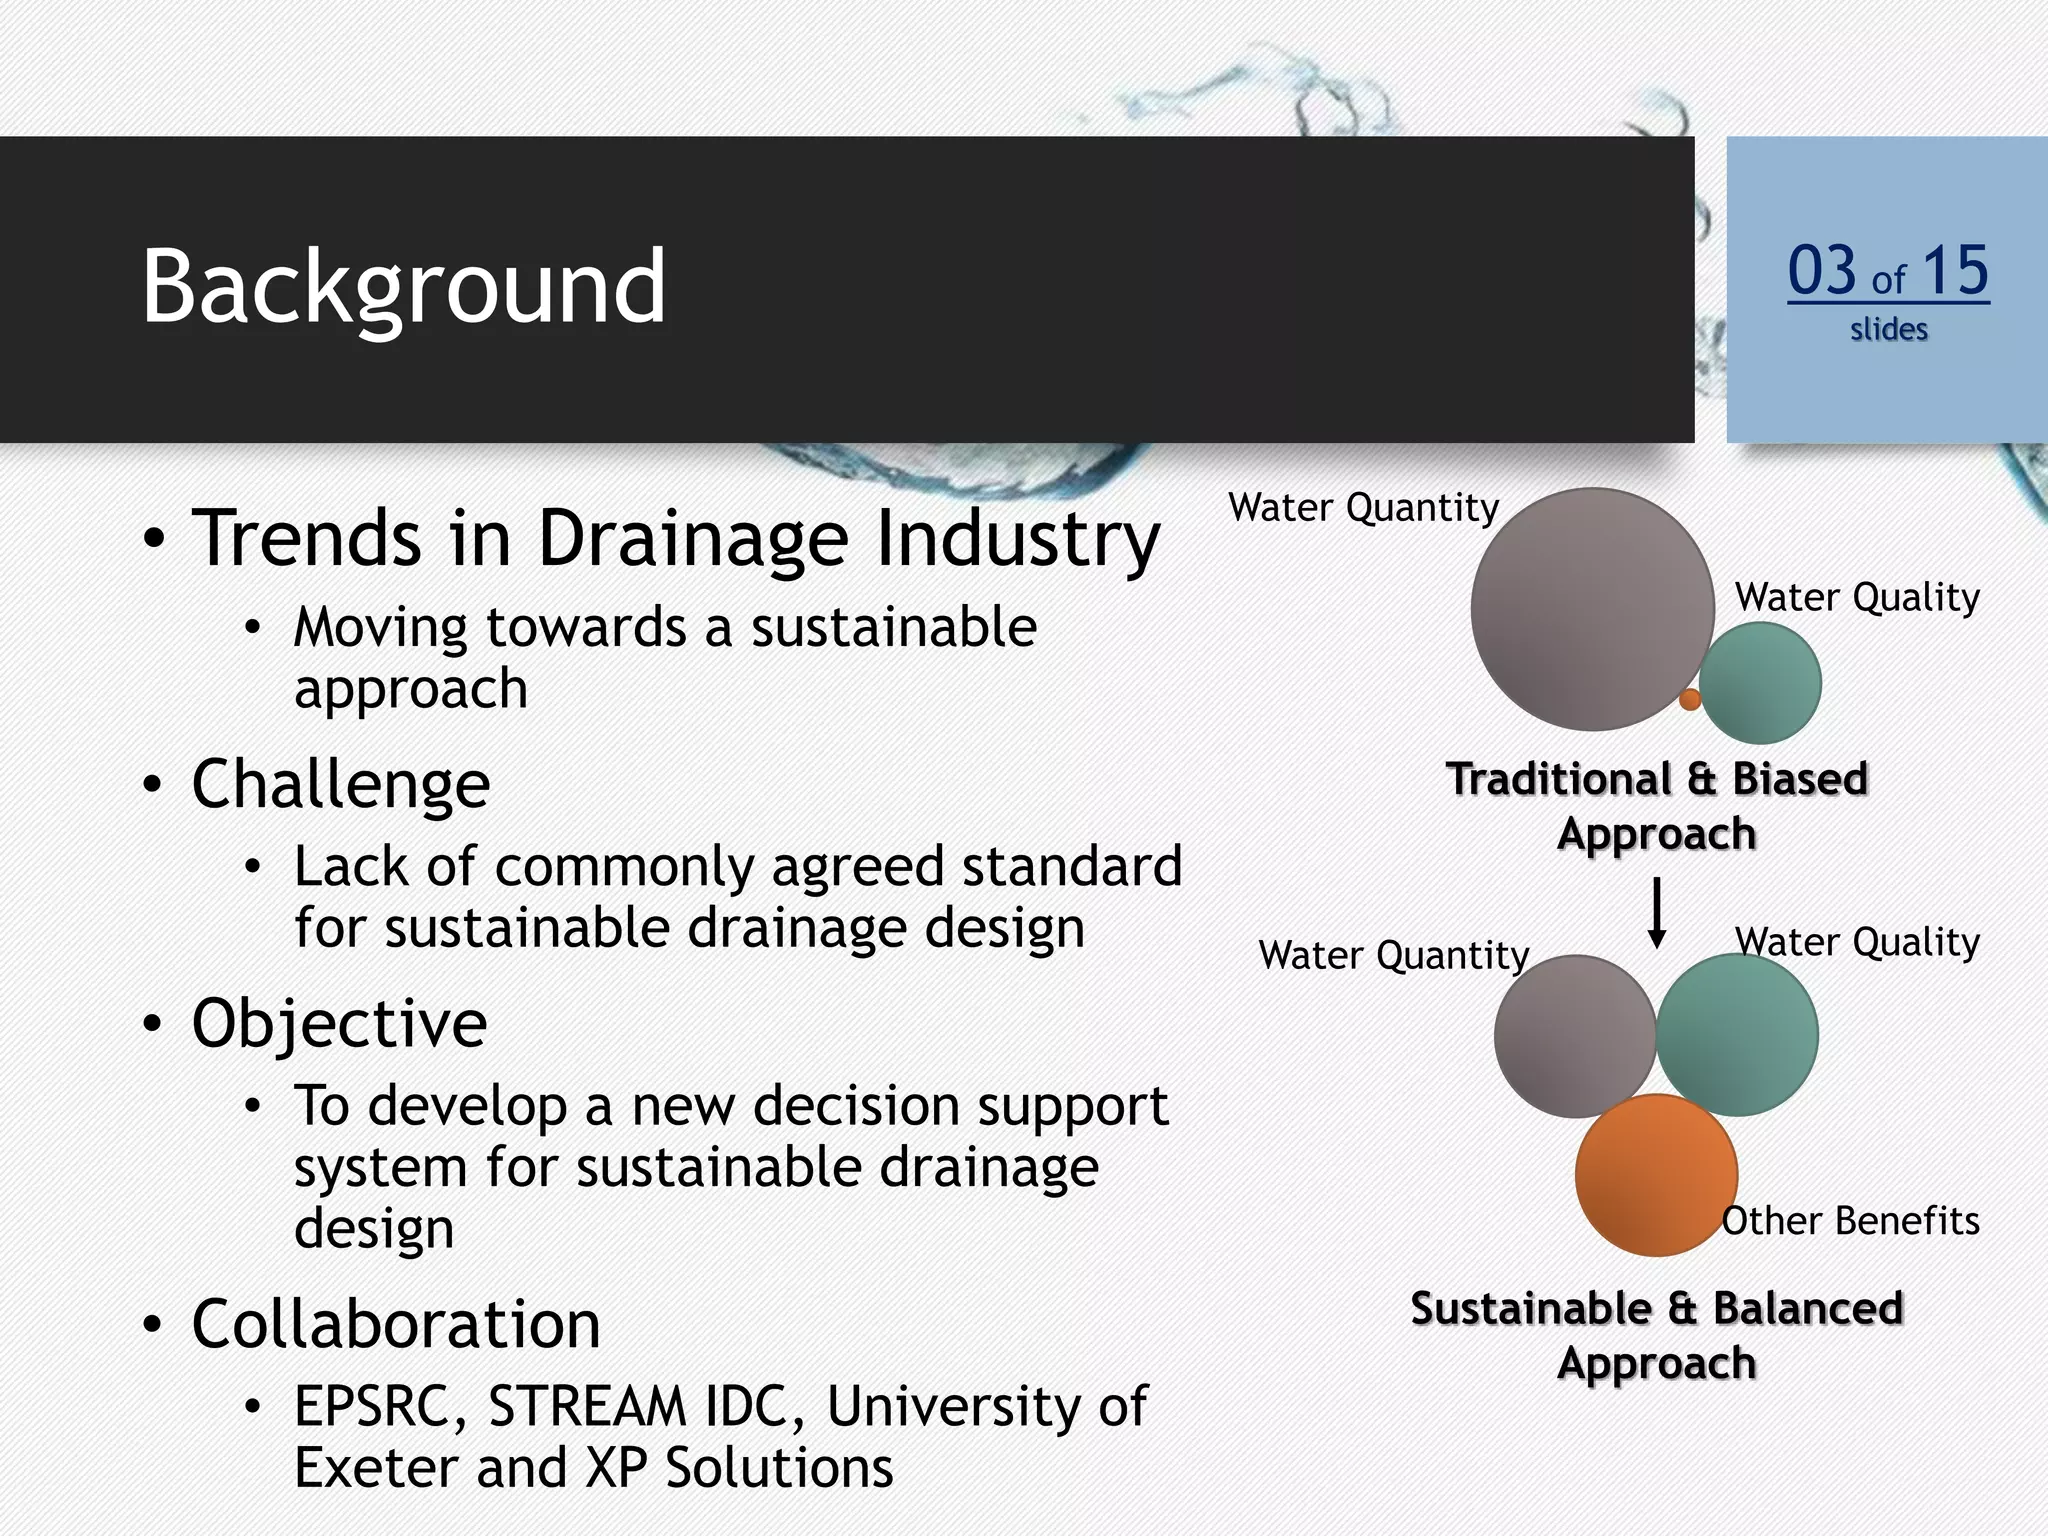
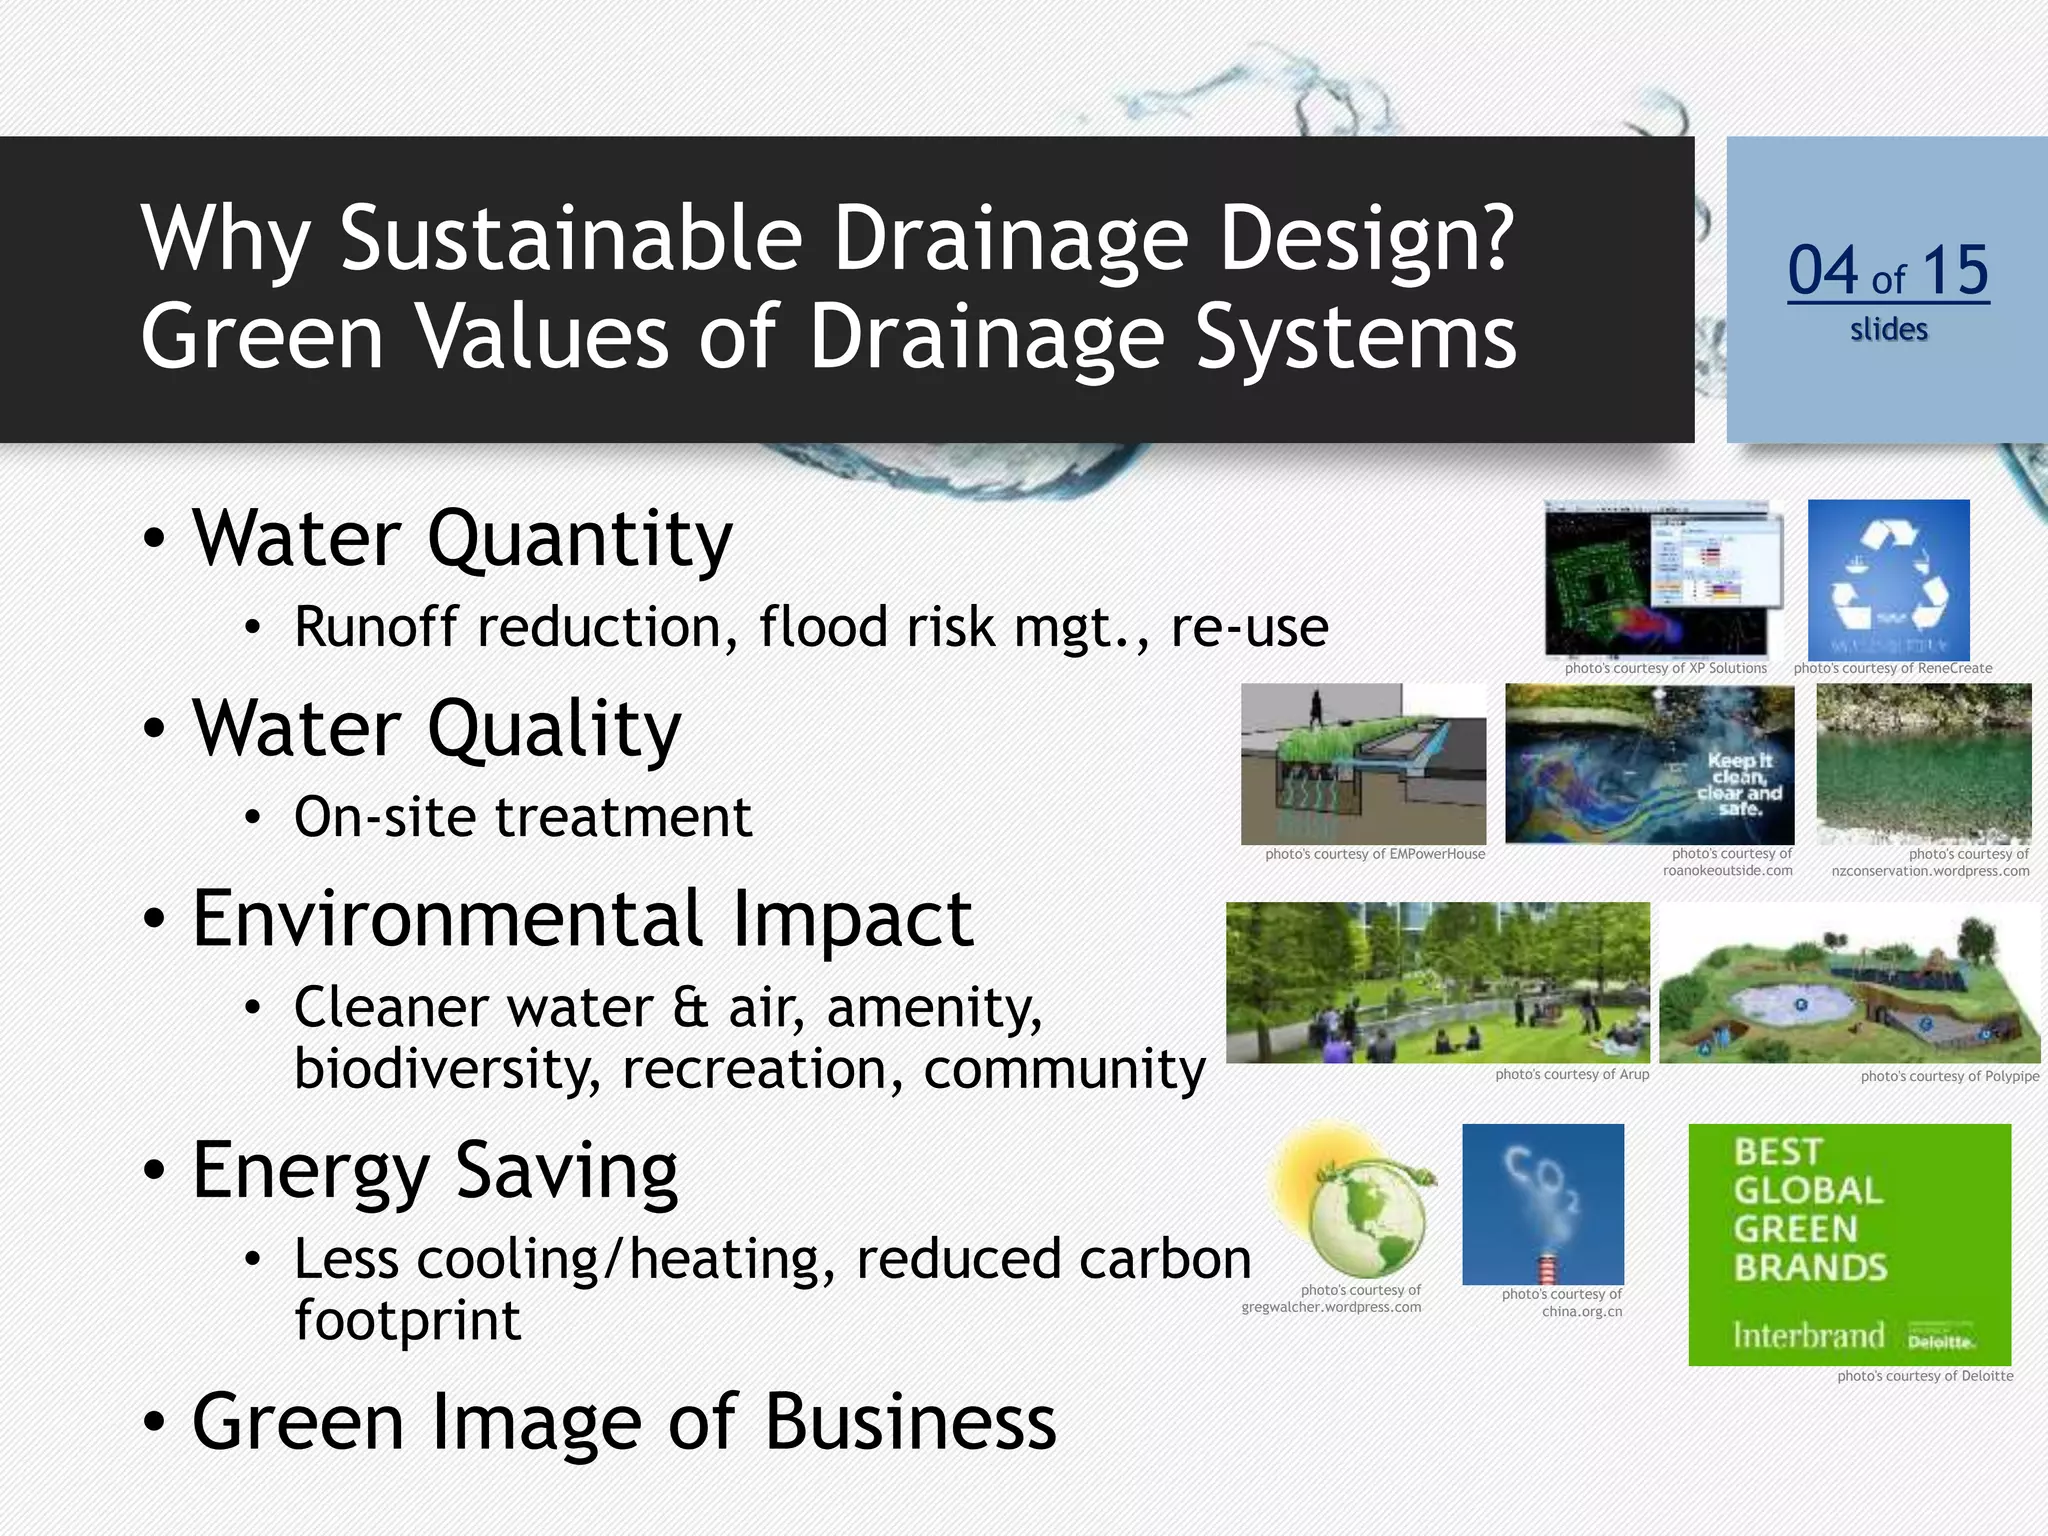
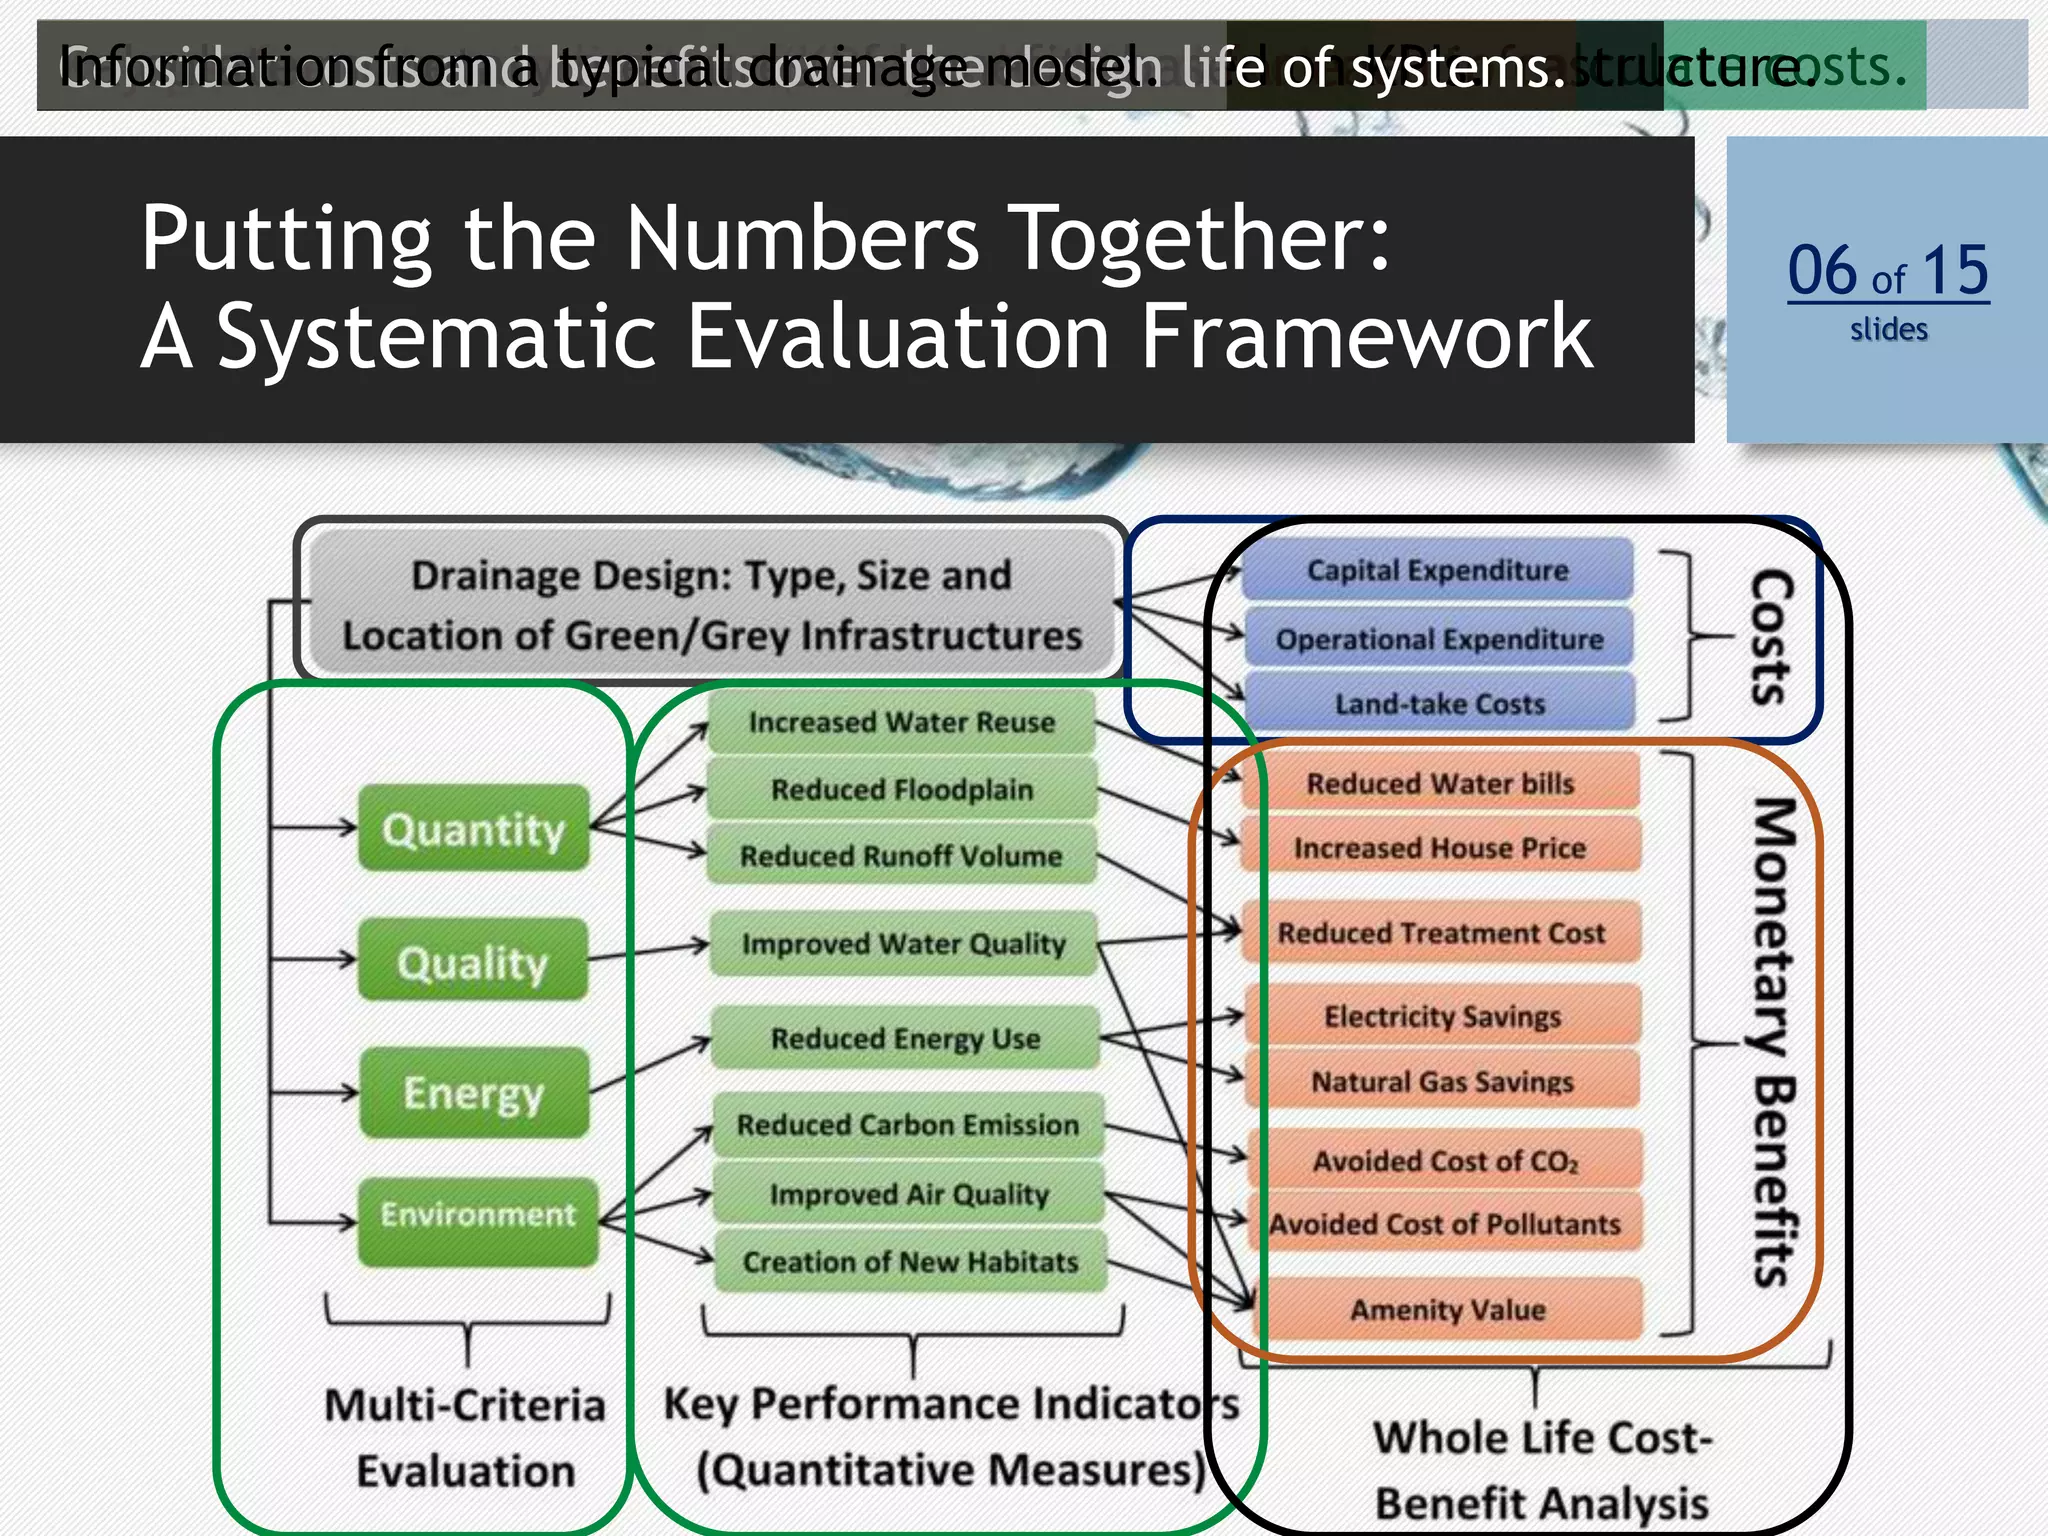
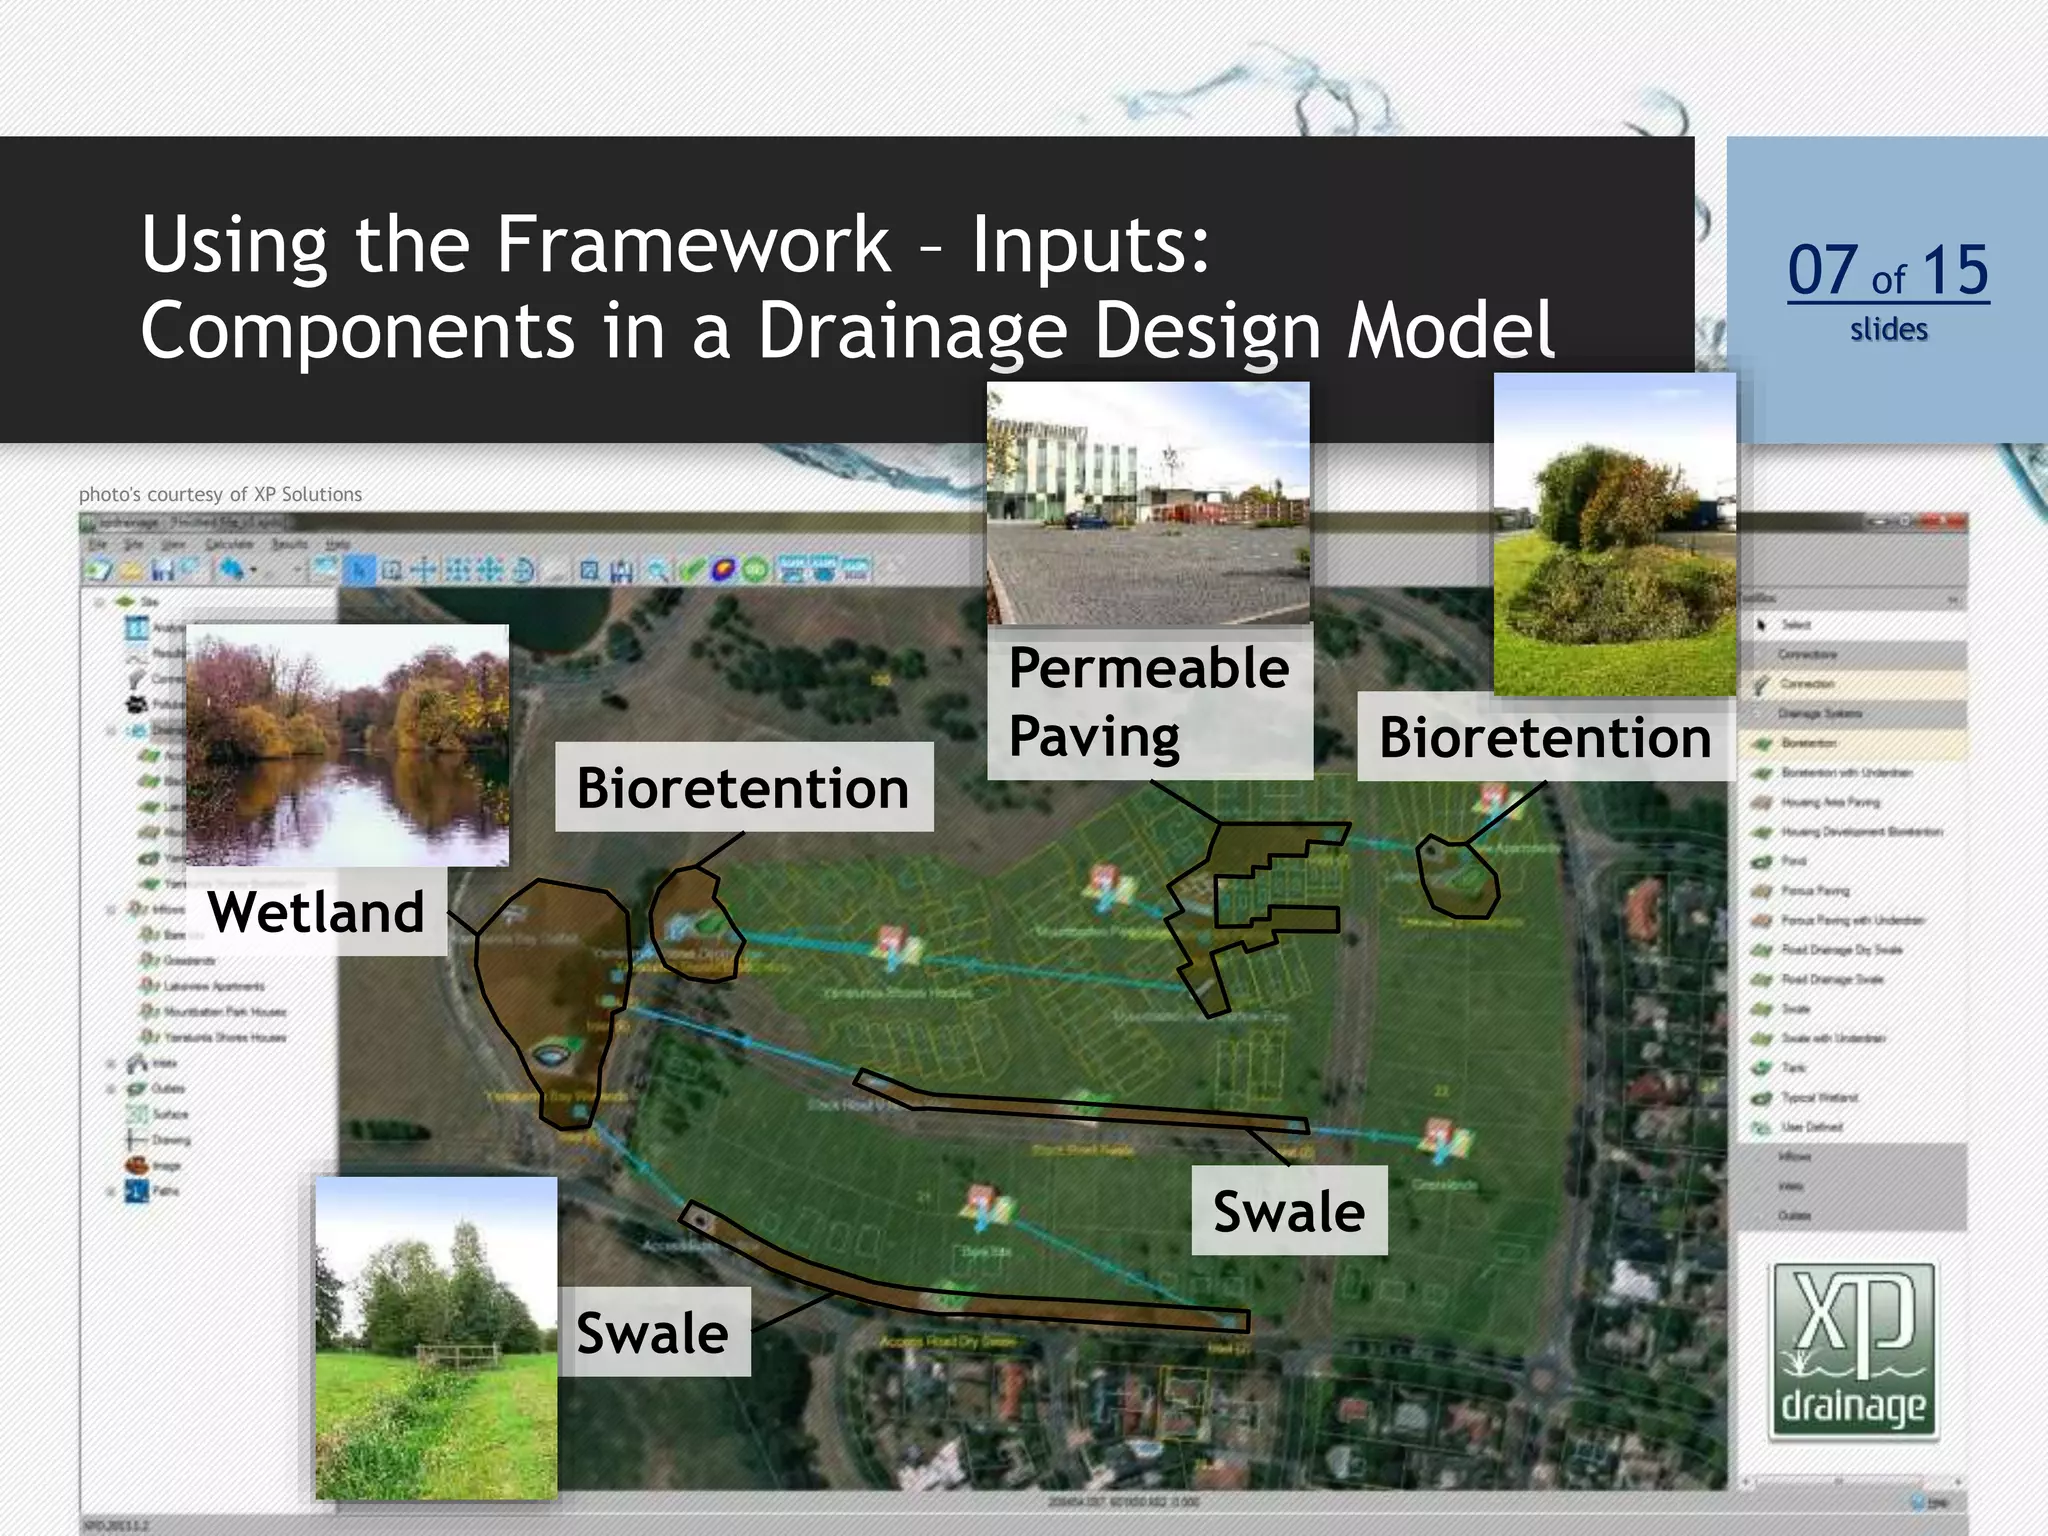
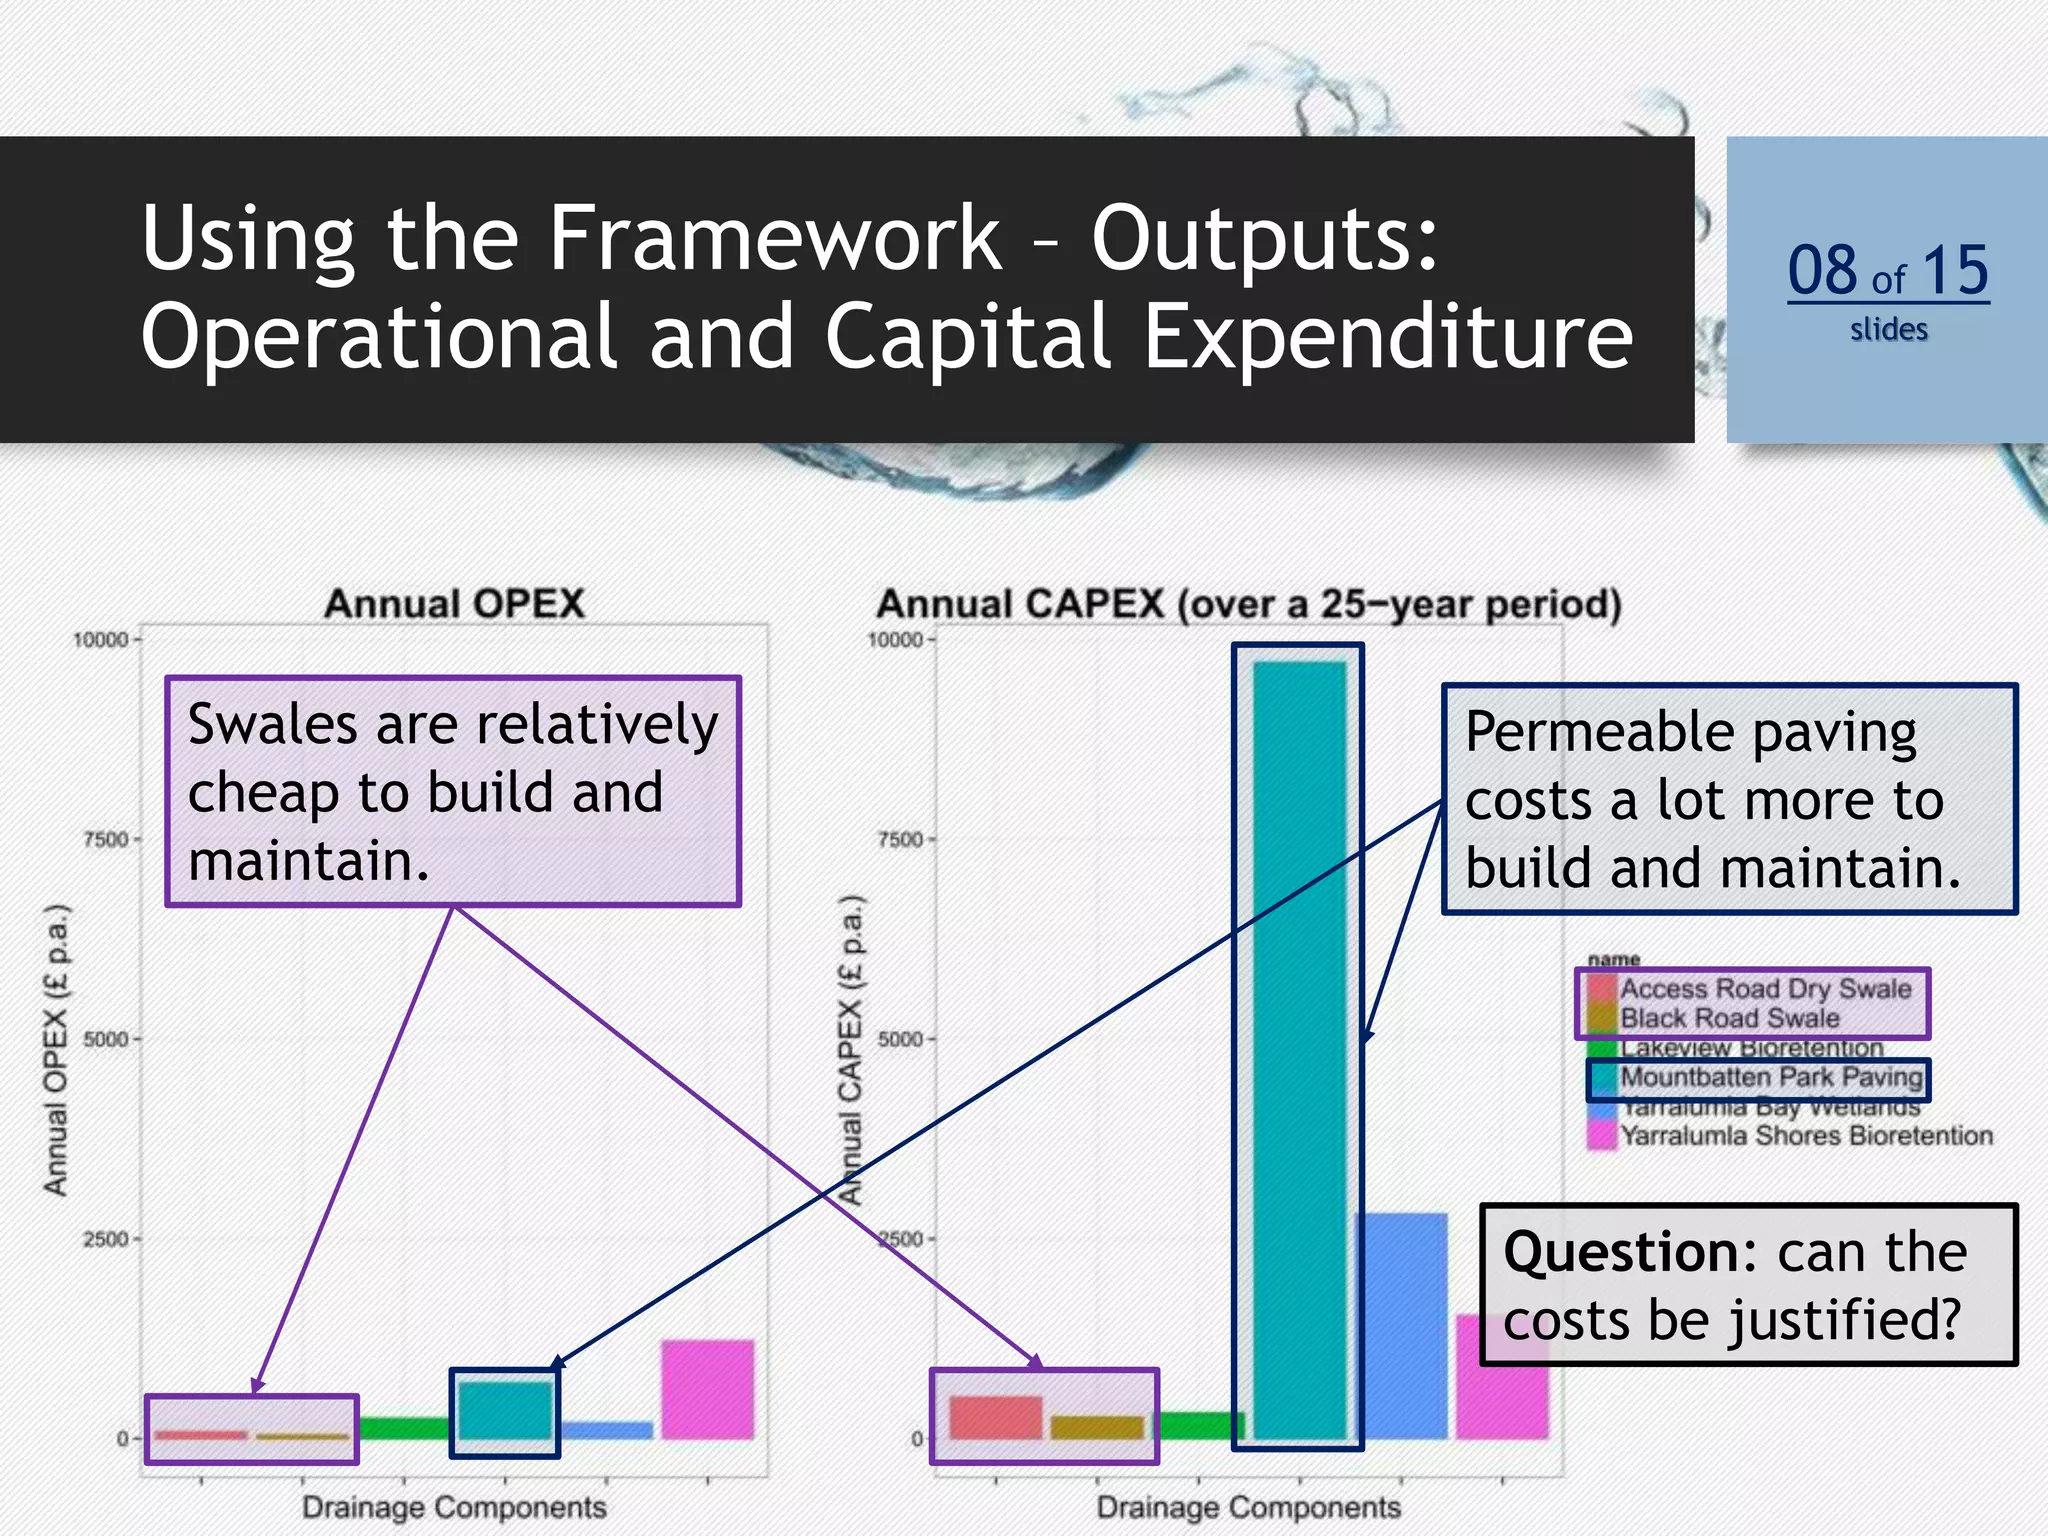
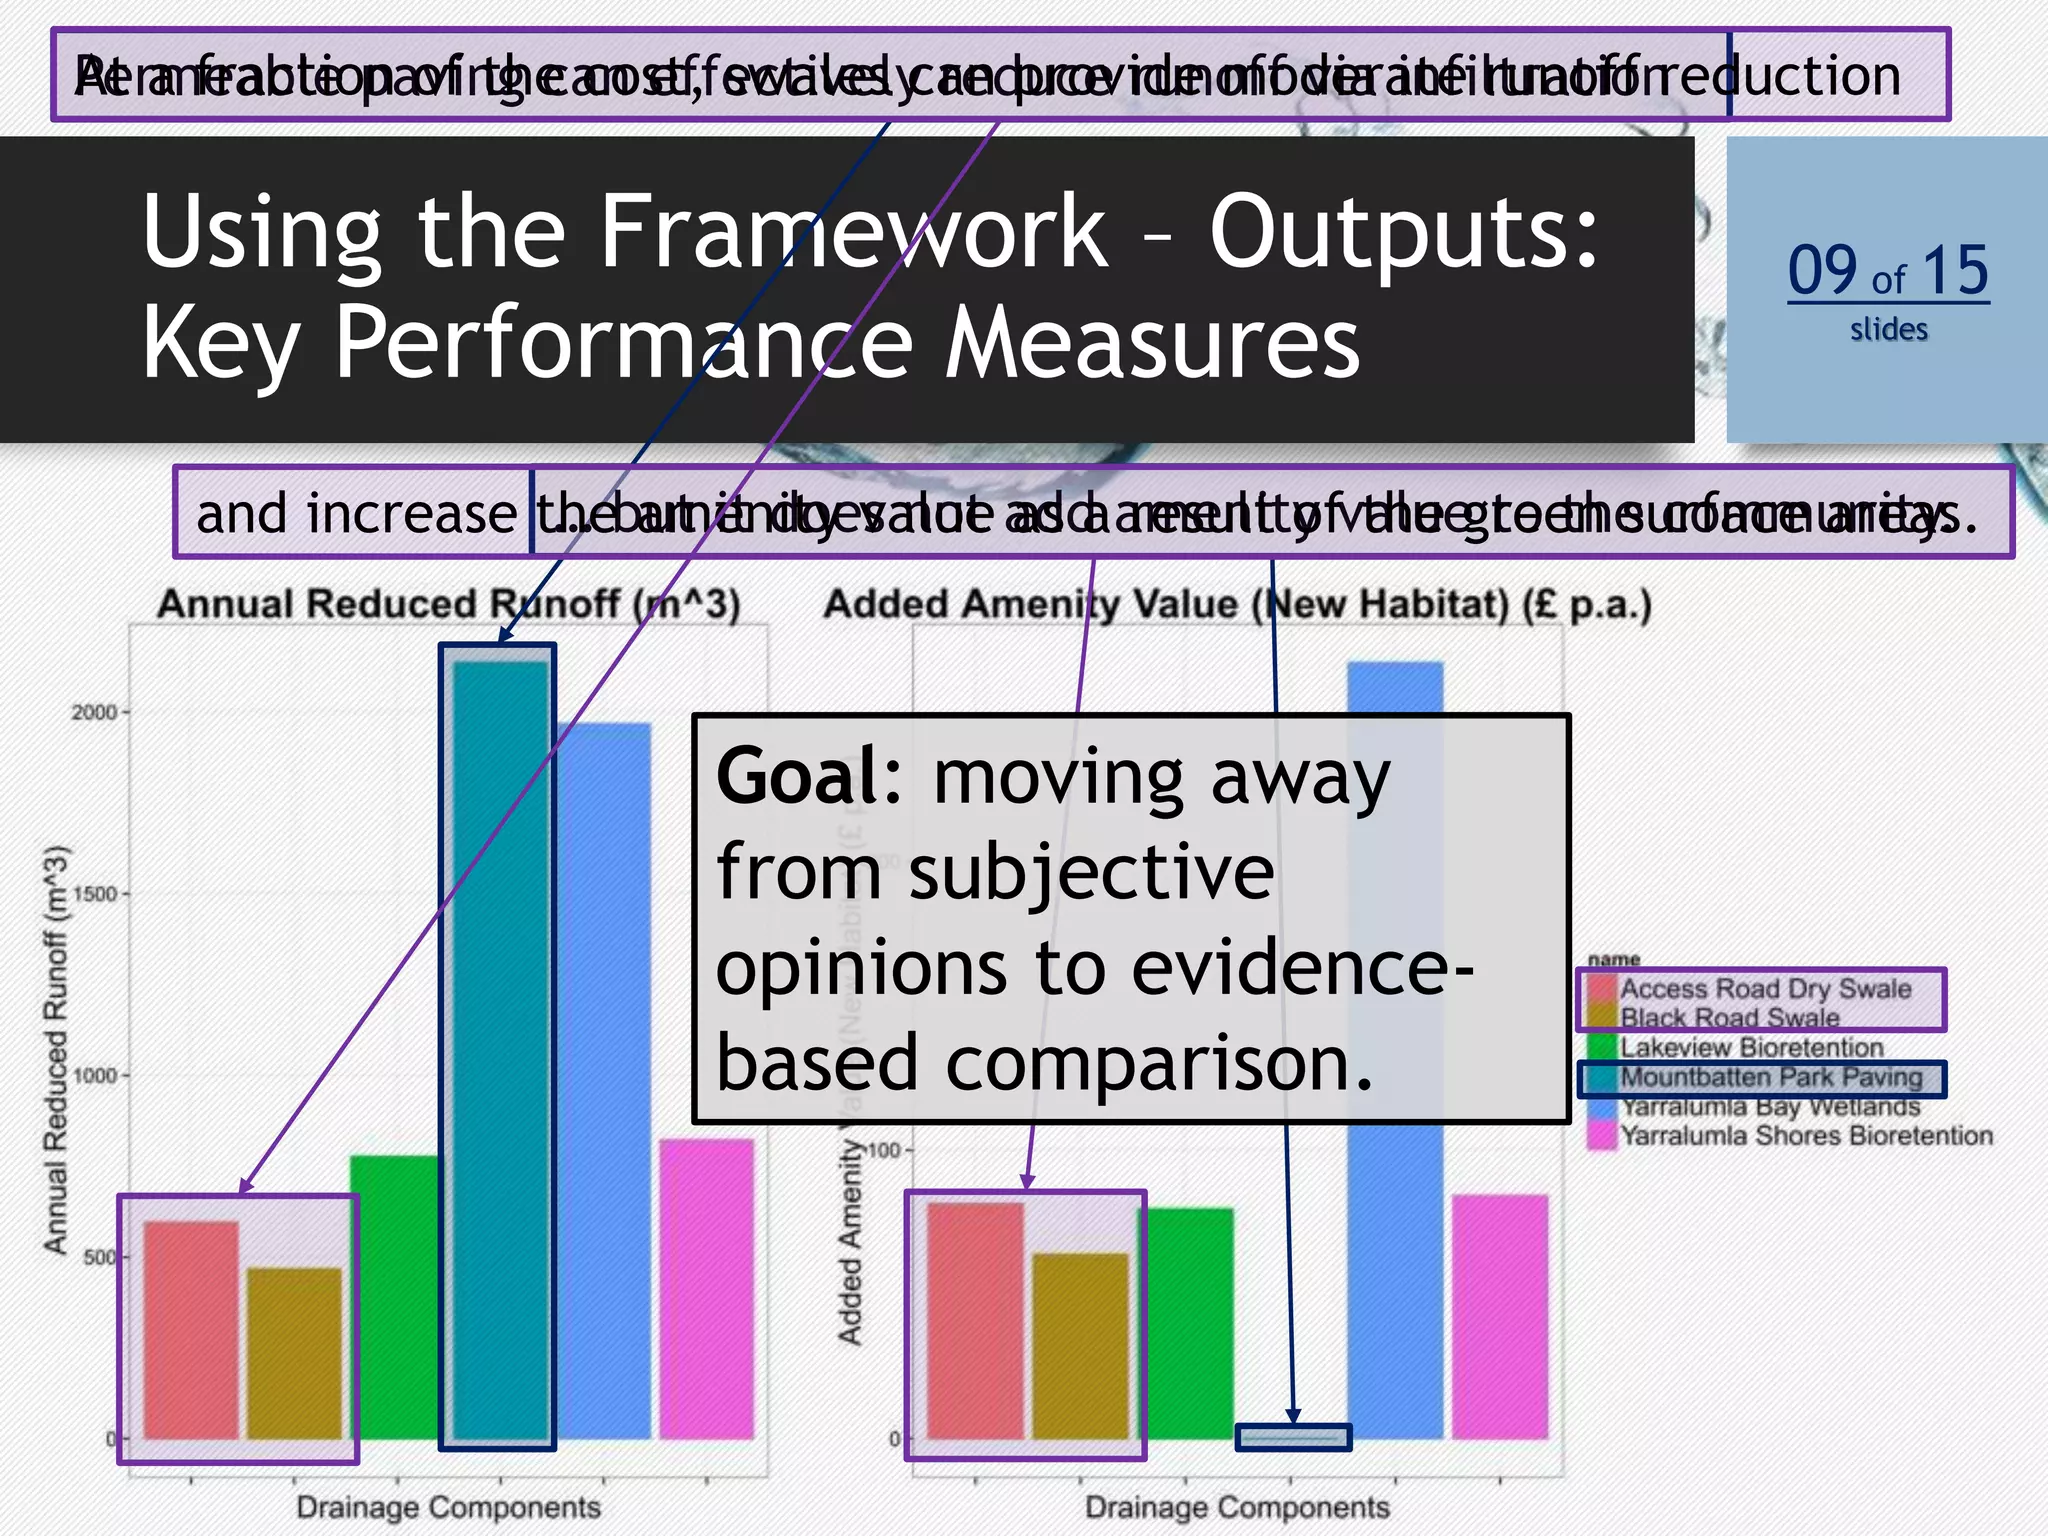
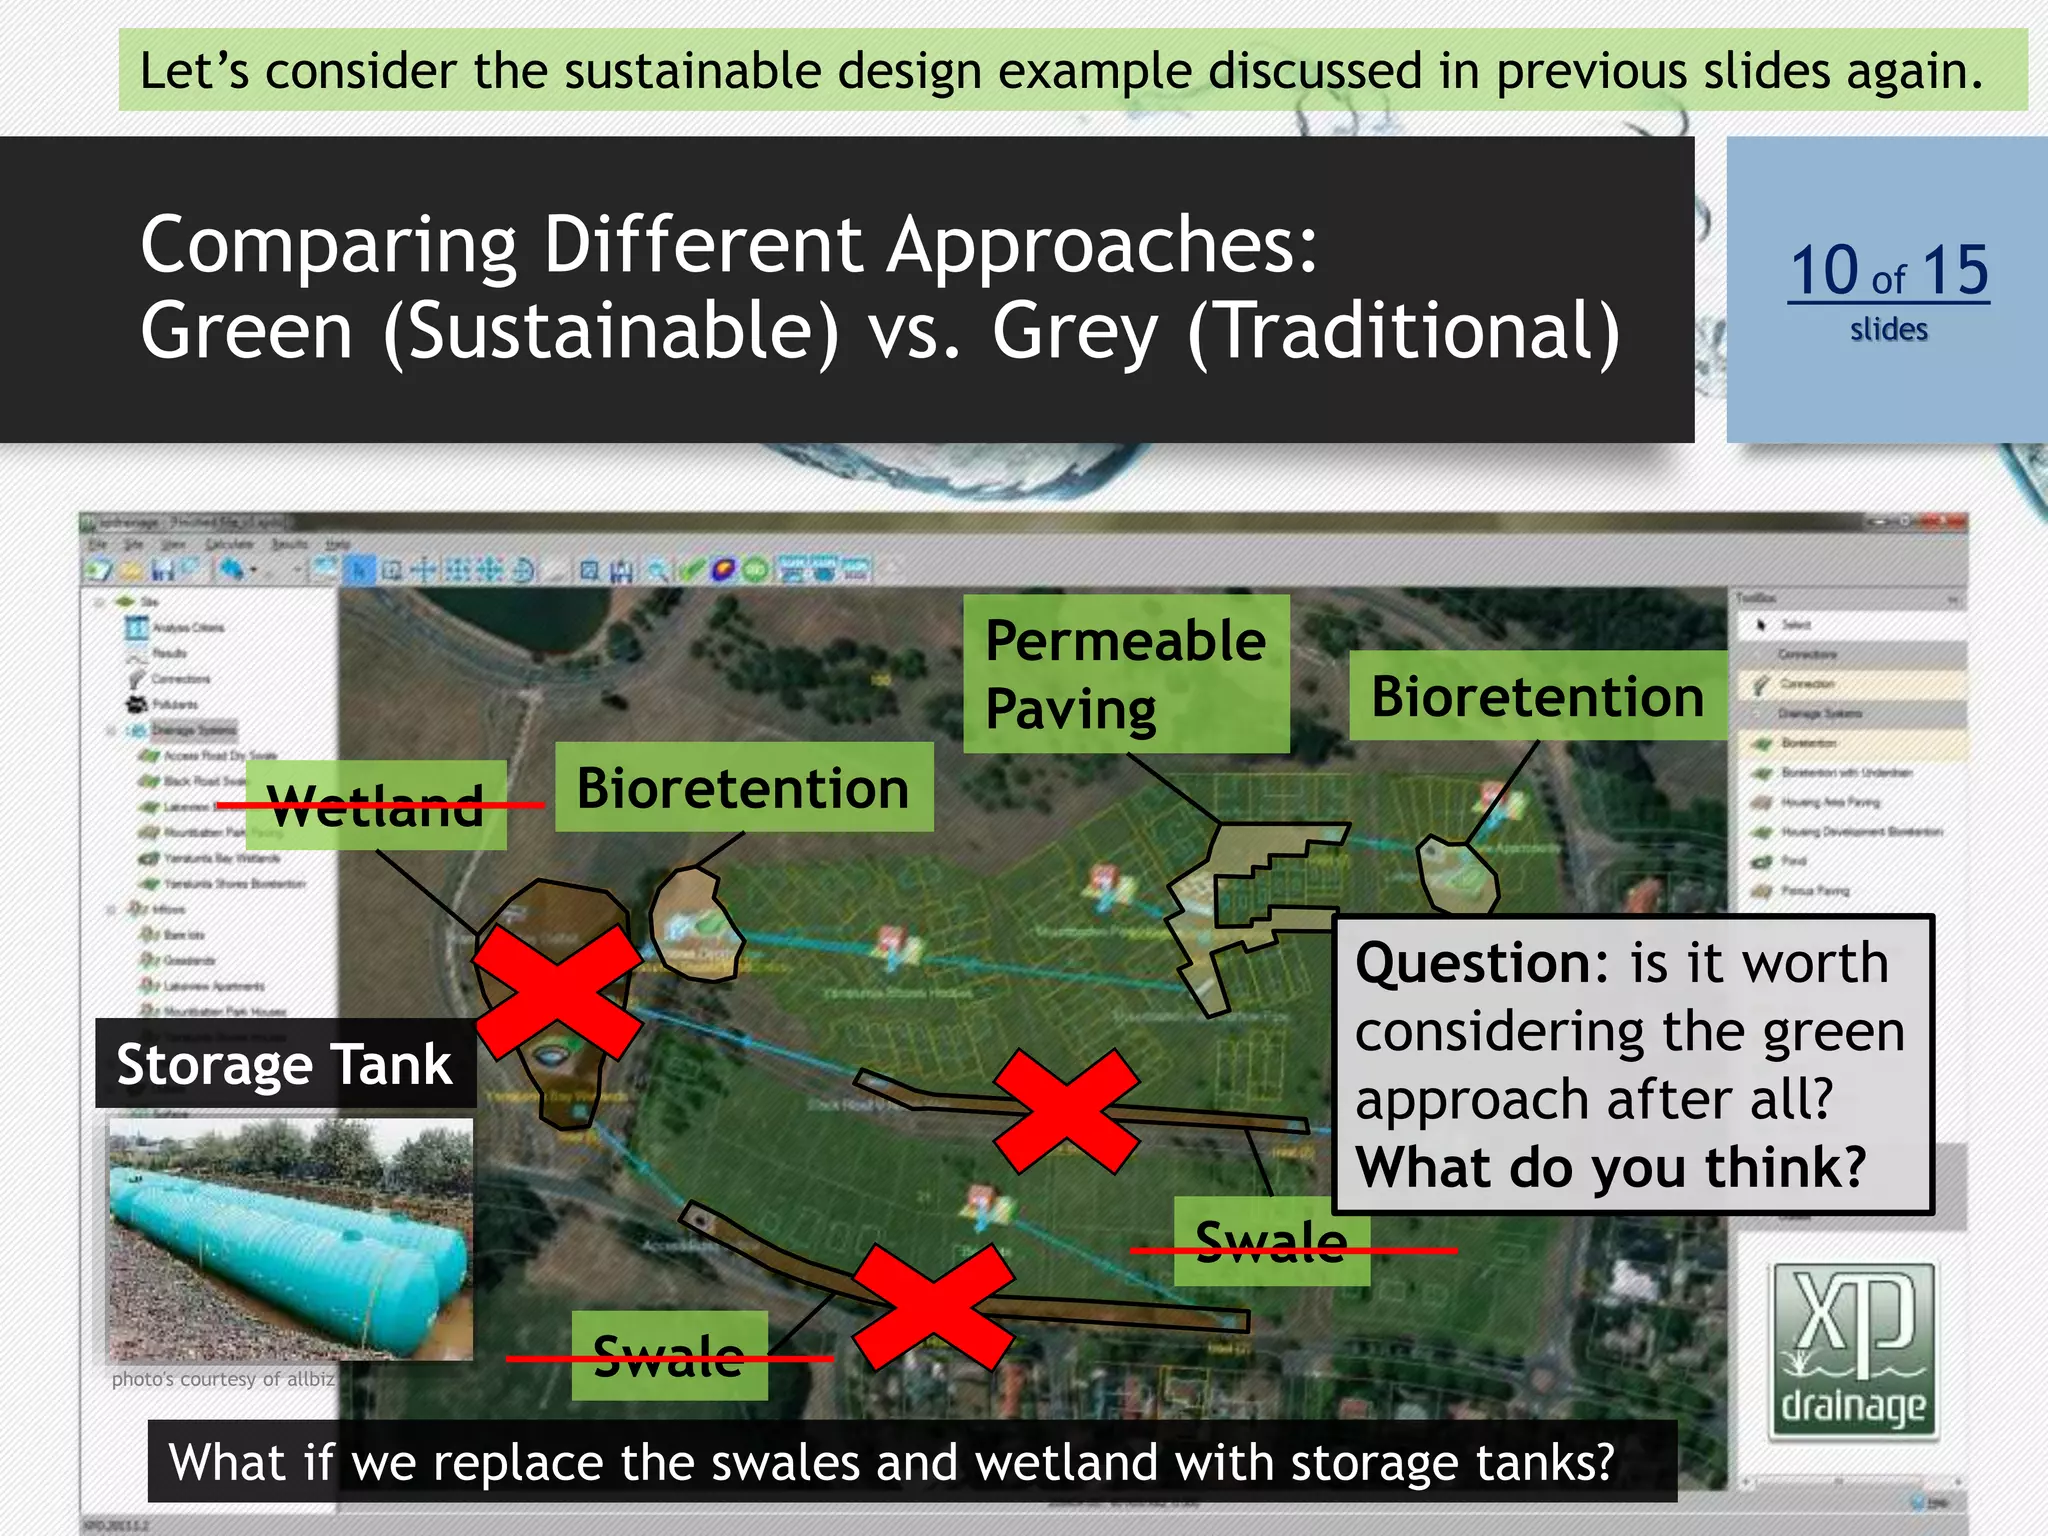
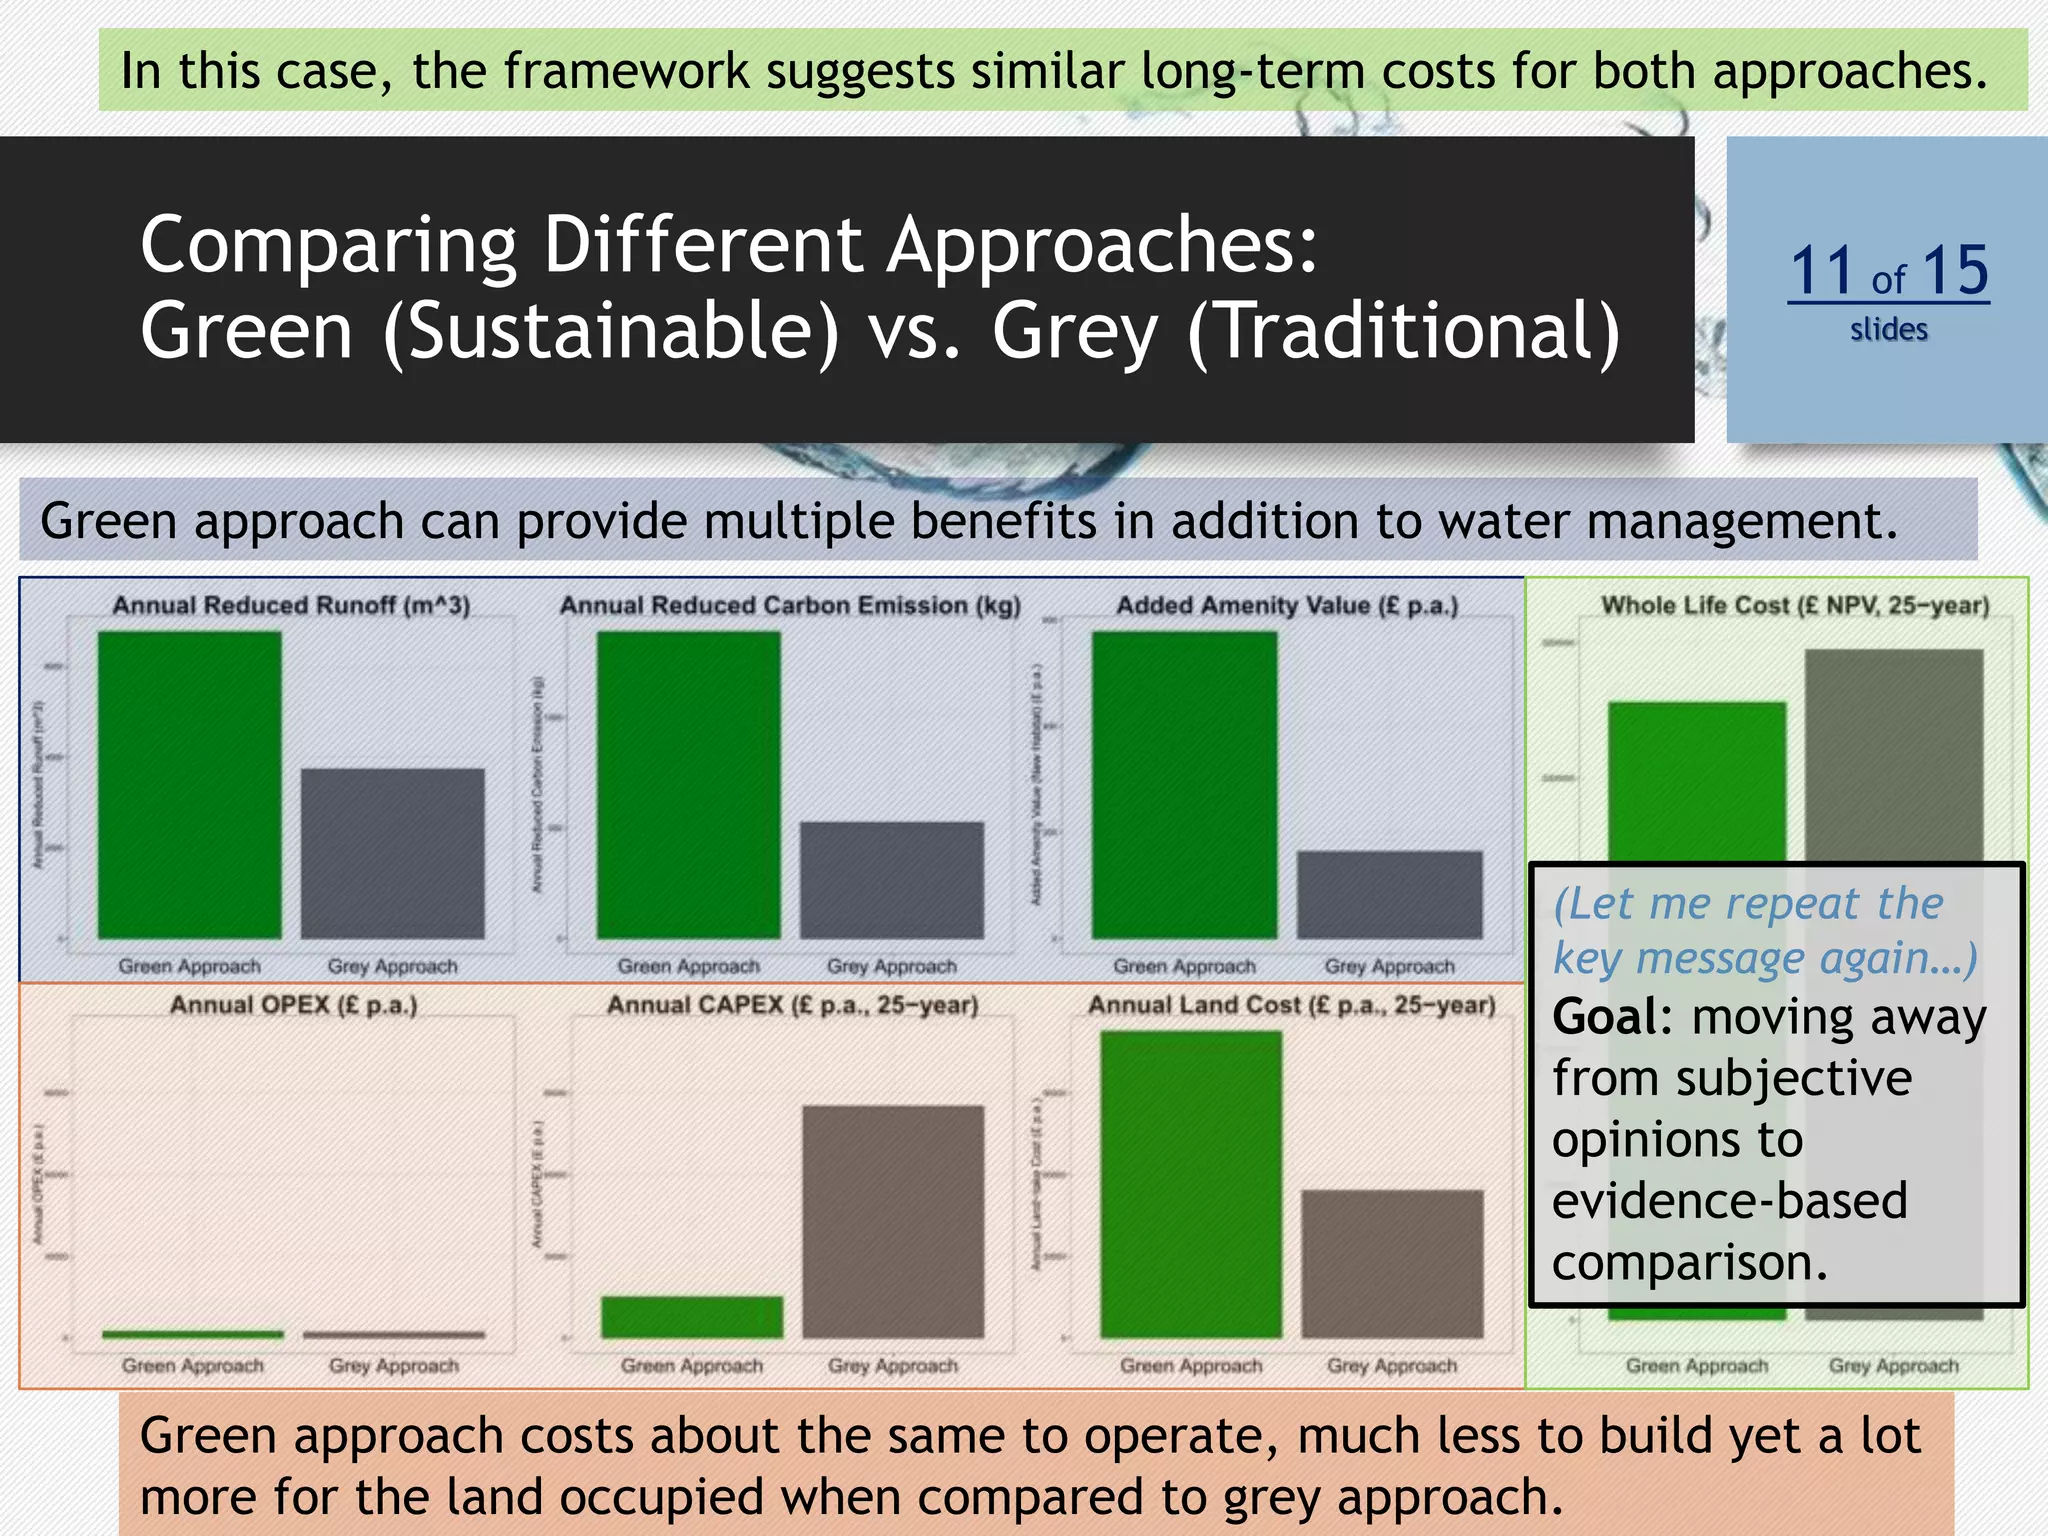
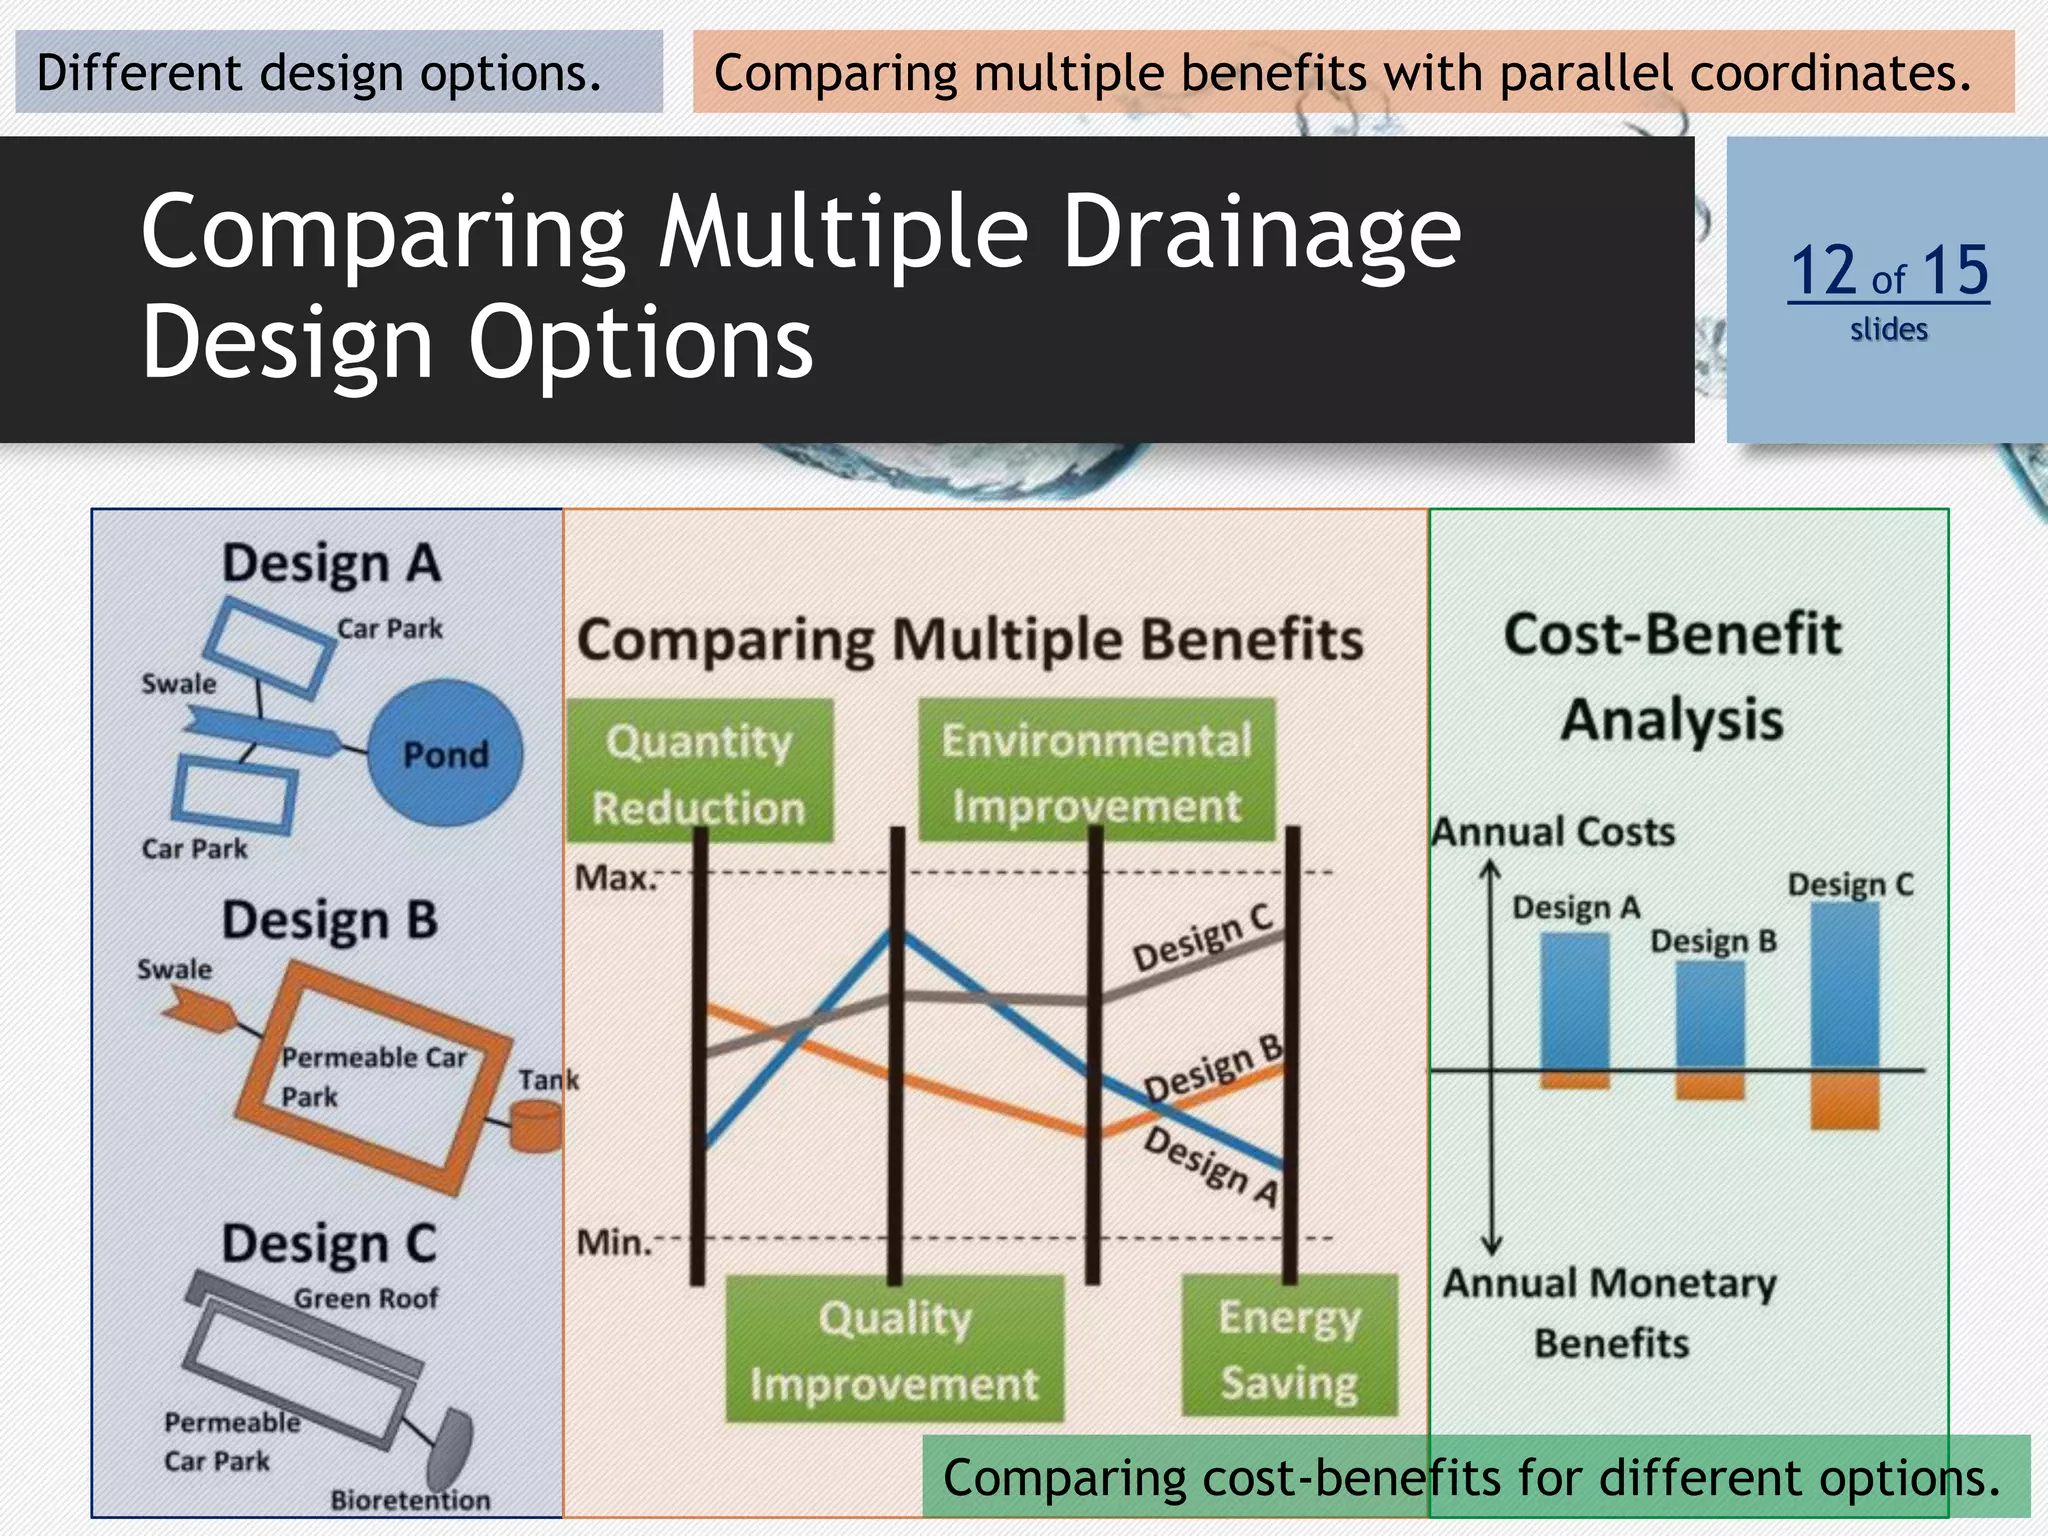
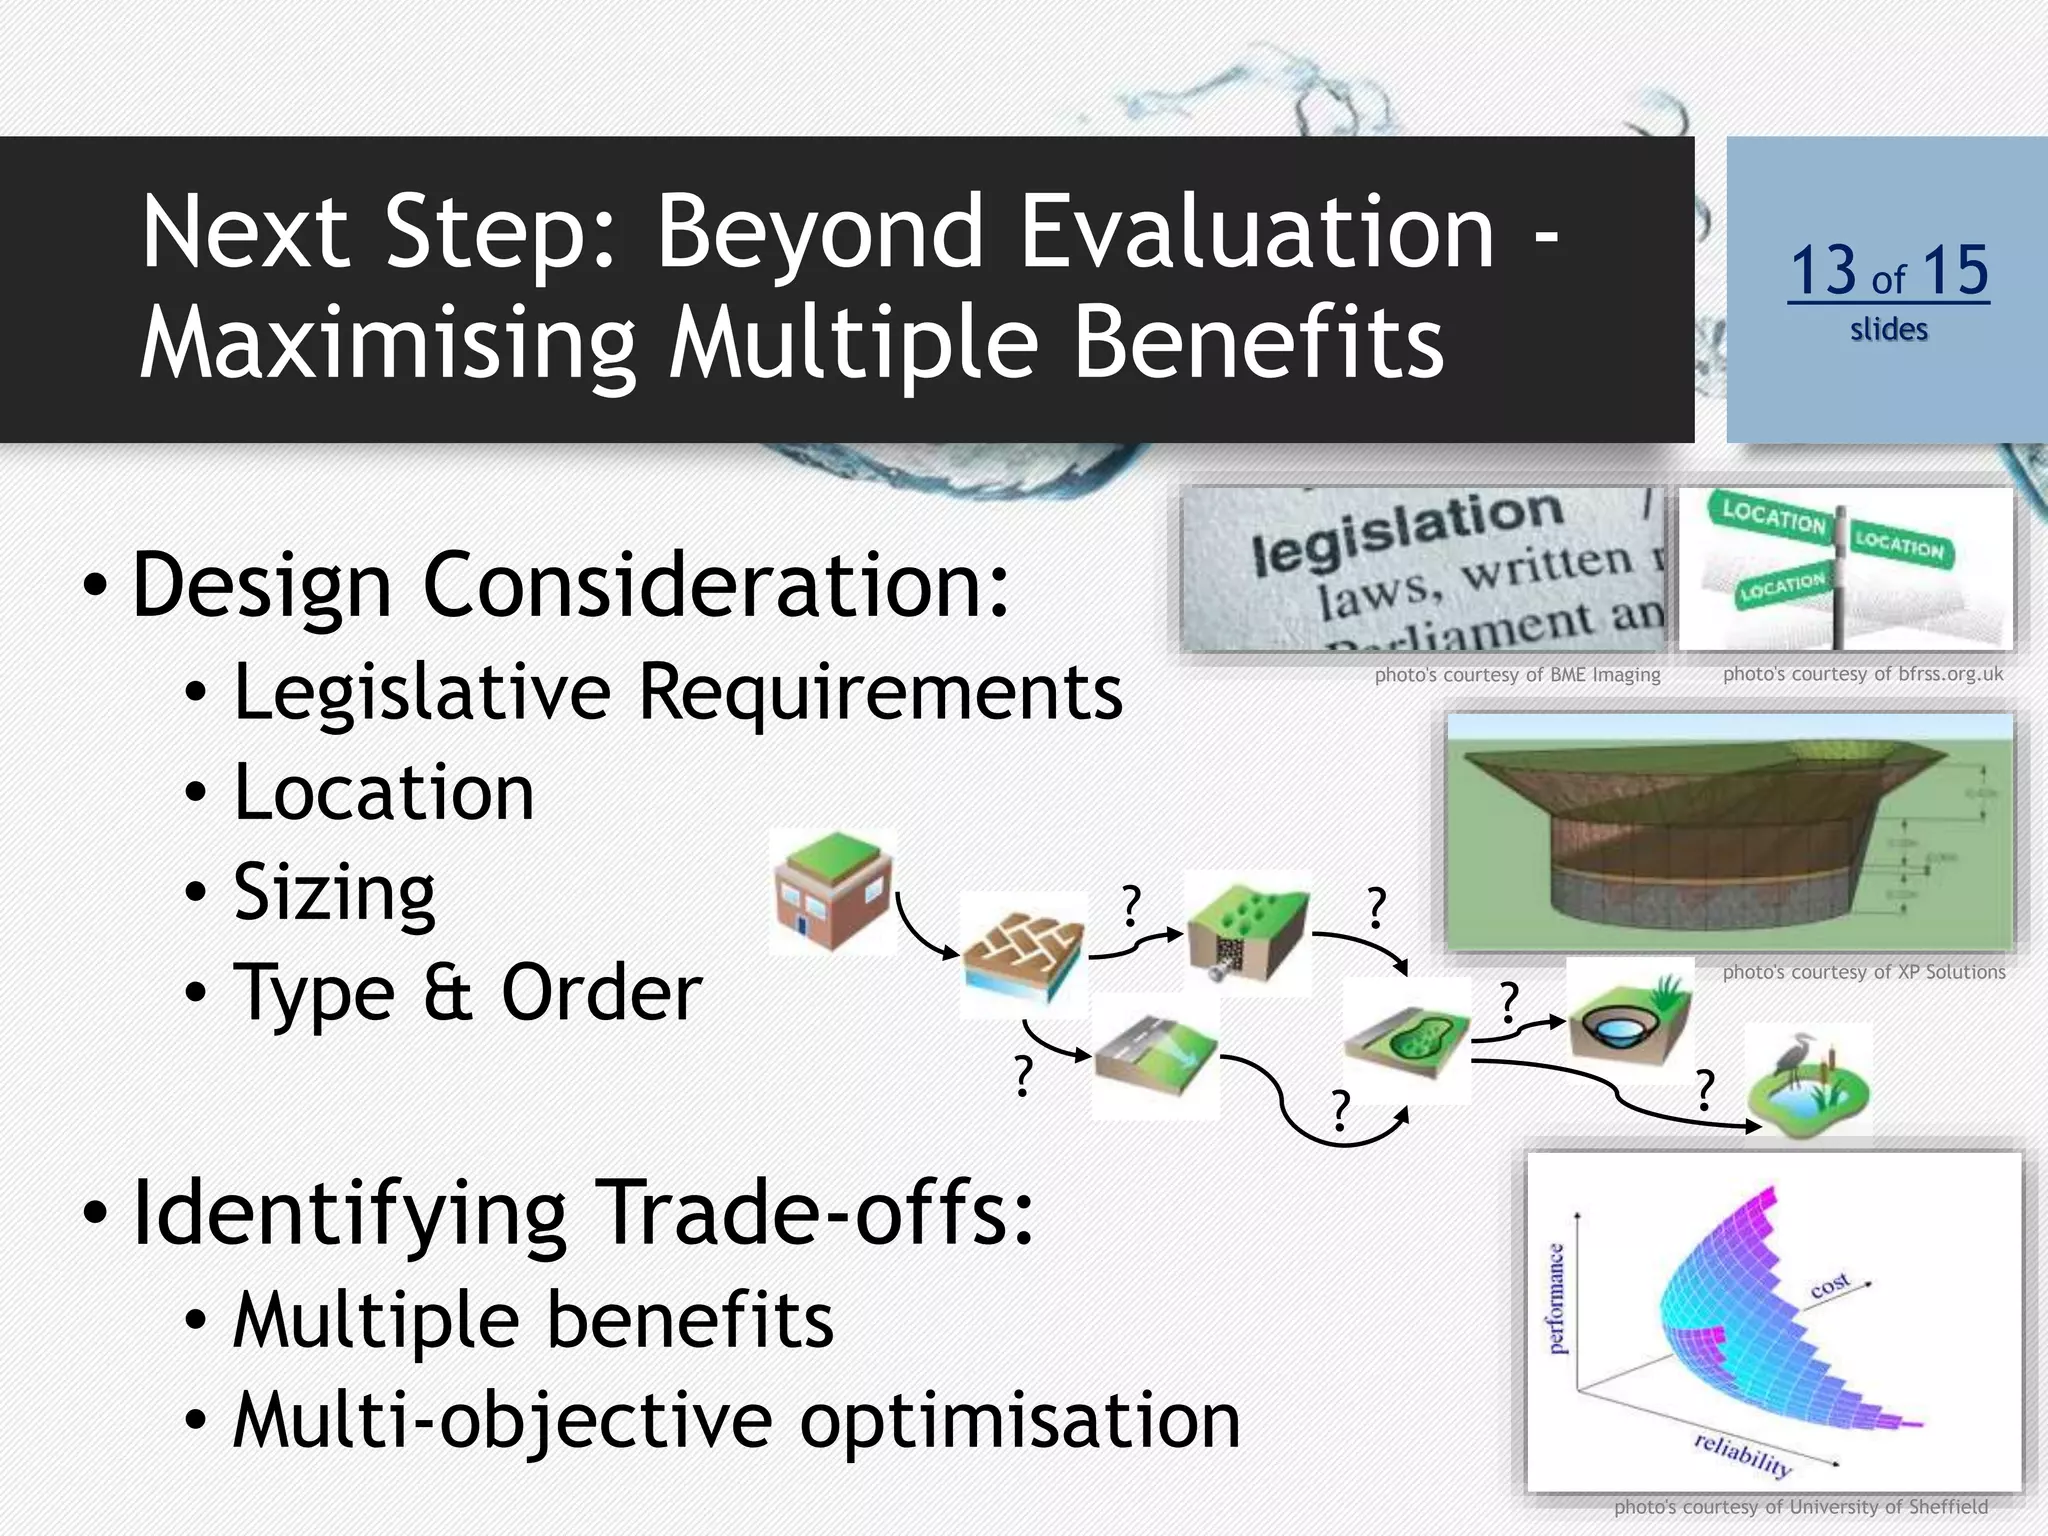
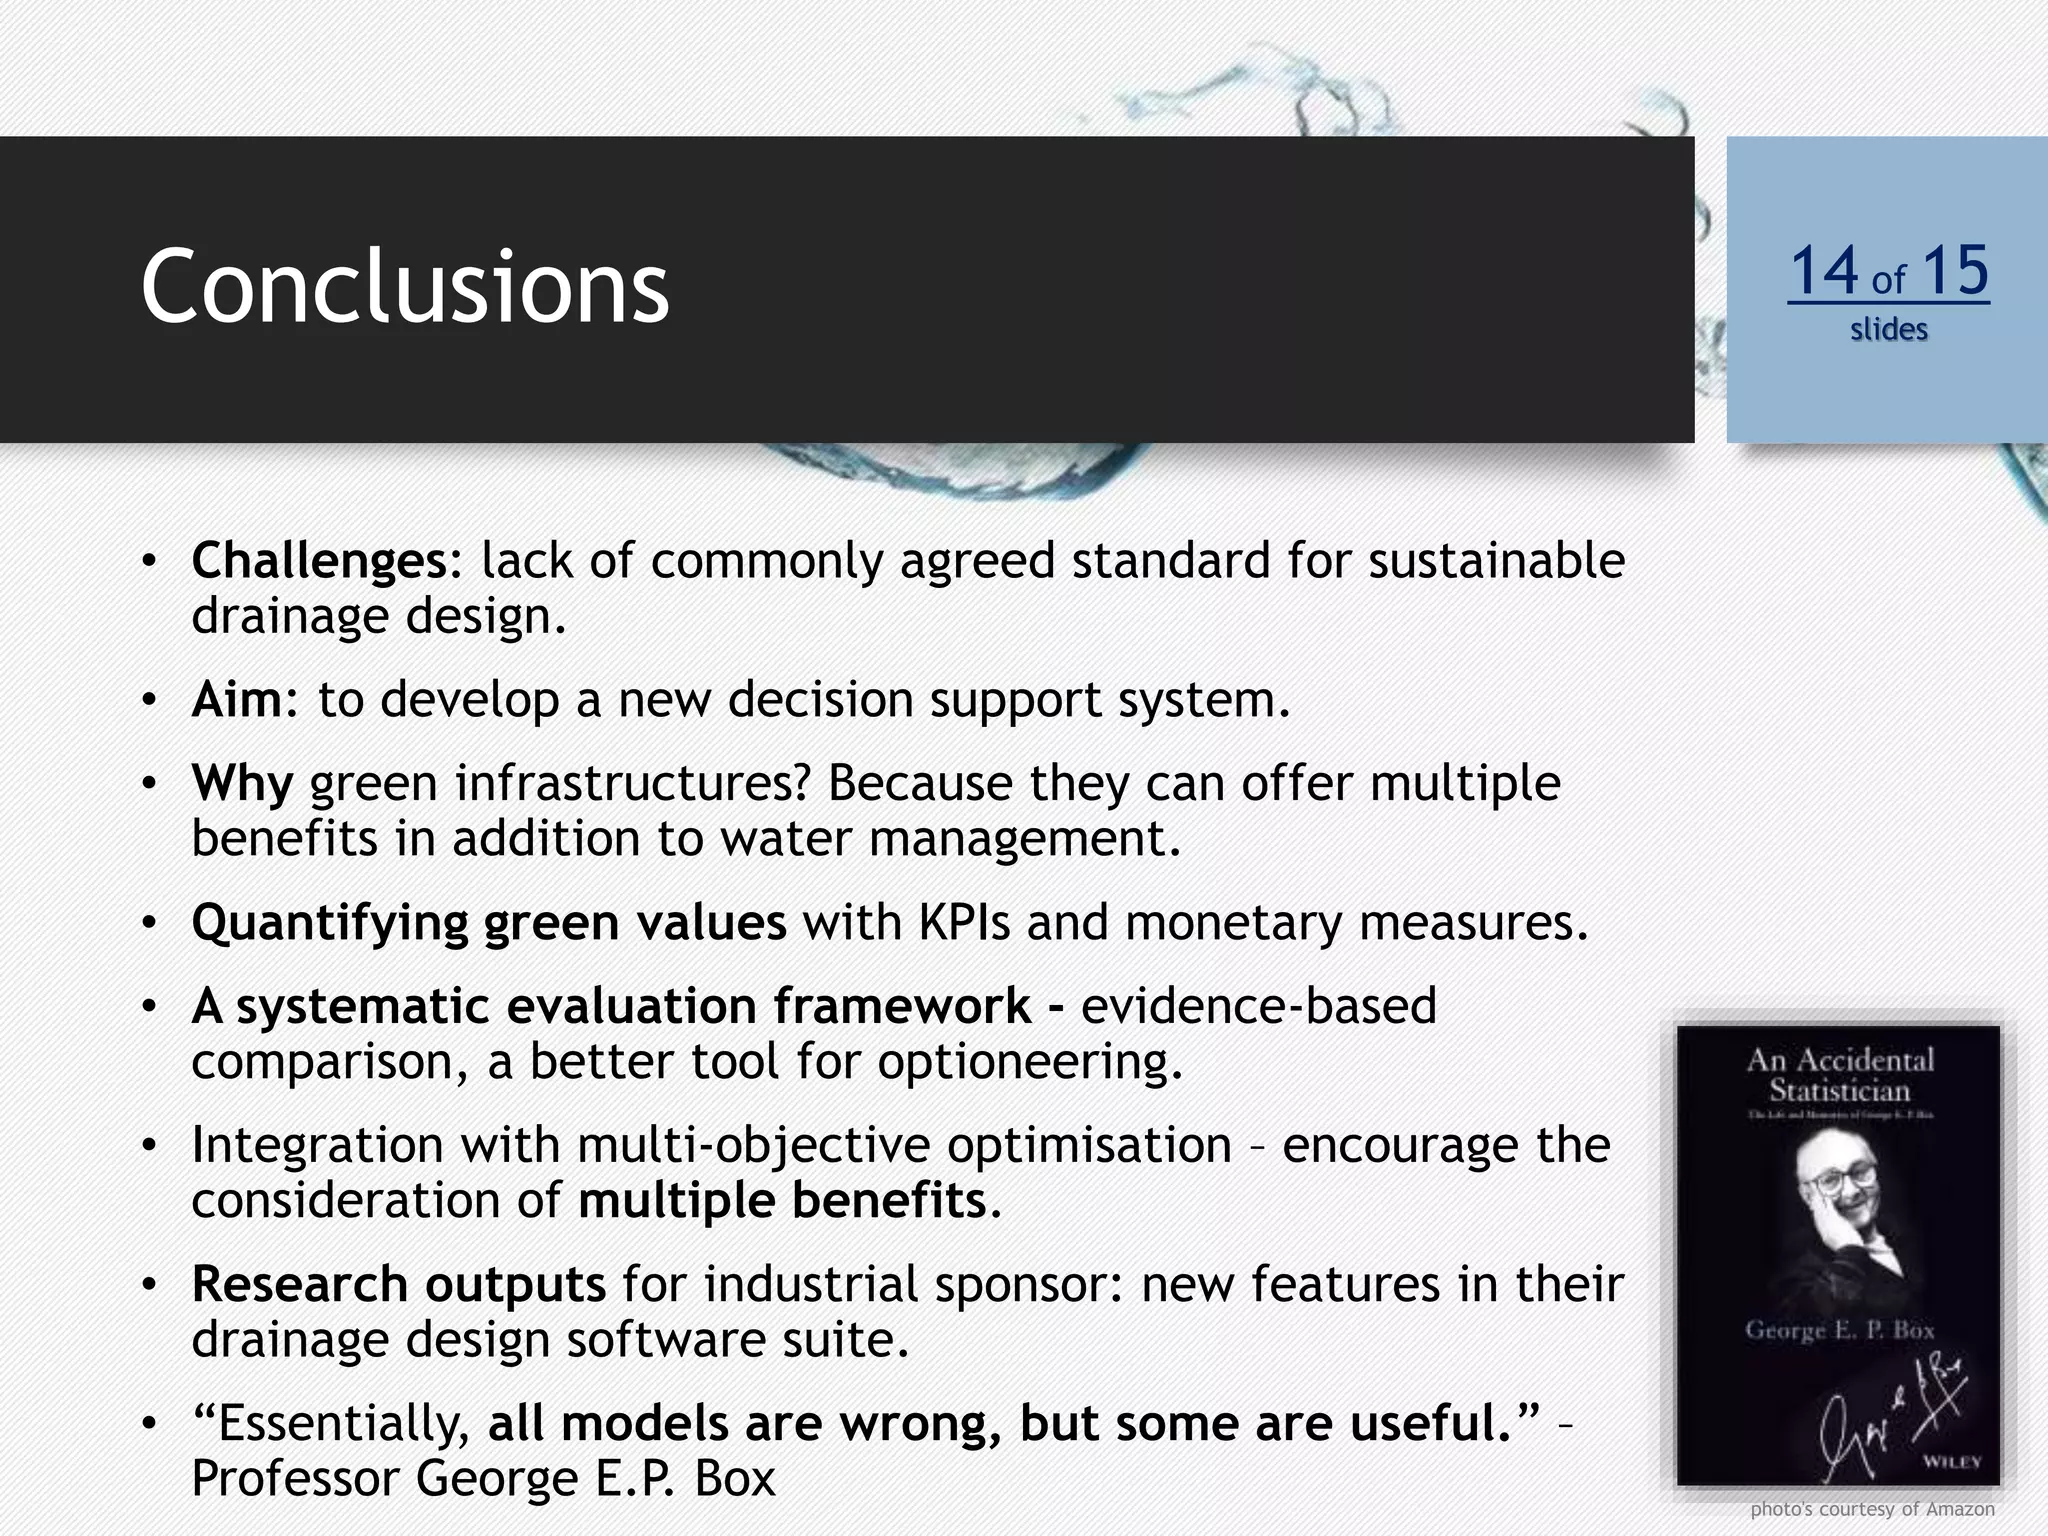
A Systematic, Multi-Criteria Decision Support Framework for Sustainable Drainage Design
1. A Systematic, Multi-Criteria
Decision Support Framework for
Sustainable Drainage Design
Jo-fai Chow,
Dragan Savić,
David Fortune,
Zoran Kapelan,
Netsanet Mebrate
You can download this presentation from
http://tinyurl.com/chow-ccwi2013
photo's courtesy of www.pptbackgrounds.net
2. About this Presentation
• Background
• Green Values of Drainage Systems
• Evaluation Framework
• Maximising Multiple Benefits
• Conclusions
02 of 15
slides
3. Background
• Trends in Drainage Industry
• Moving towards a sustainable
approach
• Challenge
• Lack of commonly agreed standard
for sustainable drainage design
• Objective
• To develop a new decision support
system for sustainable drainage
design
• Collaboration
• EPSRC, STREAM IDC, University of
Exeter and XP Solutions
03 of 15
slides
Sustainable & Balanced
Approach
Traditional & Biased
Approach
Water Quantity Water Quality
Other Benefits
Water Quantity
Water Quality
4. Why Sustainable Drainage Design?
Green Values of Drainage Systems
• Water Quantity
• Runoff reduction, flood risk mgt., re-use
• Water Quality
• On-site treatment
• Environmental Impact
• Cleaner water & air, amenity,
biodiversity, recreation, community
• Energy Saving
• Less cooling/heating, reduced carbon
footprint
• Green Image of Business
04 of 15
slides
photo's courtesy of XP Solutions photo's courtesy of ReneCreate
photo's courtesy of EMPowerHouse photo's courtesy of
roanokeoutside.com
photo's courtesy of
nzconservation.wordpress.com
photo's courtesy of Arup photo's courtesy of Polypipe
photo's courtesy of
gregwalcher.wordpress.com
photo's courtesy of
china.org.cn
photo's courtesy of Deloitte
5. Quantifying Green Values:
From Good Feelings to Real Numbers
05 of 15
slides
Calculations based on
previous research projects
and case studies.
For more information:
1.Conference Paper
2.This presentation online
(tinyurl.com/greenvalues)
6. Using physical attributes & location of infrastructures to calculate costs.Four main categories of performance measures.Key performance indicators (KPIs) calculated for each infrastructure.Calculate monetary measures of benefits based on KPIs.Consider costs and benefits over the design life of systems.
Putting the Numbers Together:
A Systematic Evaluation Framework
06 of 15
slides
Information from a typical drainage model.
7. Using the Framework – Inputs:
Components in a Drainage Design Model
07 of 15
slides
Bioretention
Bioretention
Permeable
Paving
Wetland
Swale
Swale
photo's courtesy of XP Solutions
8. Using the Framework – Outputs:
Operational and Capital Expenditure
08 of 15
slides
Swales are relatively
cheap to build and
maintain.
Question: can the
costs be justified?
Permeable paving
costs a lot more to
build and maintain.
9. Using the Framework – Outputs:
Key Performance Measures
09 of 15
slides
Permeable paving can effectively reduce runoff via infiltration
… but it does not add amenity value to the community.
At a fraction of the cost, swales can provide moderate runoff reduction
and increase the amenity value as a result of the green surface areas.
Goal: moving away
from subjective
opinions to evidence-
based comparison.
10. Comparing Different Approaches:
Green (Sustainable) vs. Grey (Traditional)
10 of 15
slides
Bioretention
Permeable
Paving
BioretentionWetland
Swale
Swalephoto's courtesy of allbiz
Storage Tank
Question: is it worth
considering the green
approach after all?
What do you think?
Let’s consider the sustainable design example discussed in previous slides again.
What if we replace the swales and wetland with storage tanks?
11. Comparing Different Approaches:
Green (Sustainable) vs. Grey (Traditional)
11 of 15
slides
Green approach can provide multiple benefits in addition to water management.
Green approach costs about the same to operate, much less to build yet a lot
more for the land occupied when compared to grey approach.
In this case, the framework suggests similar long-term costs for both approaches.
(Let me repeat the
key message again…)
Goal: moving away
from subjective
opinions to
evidence-based
comparison.
12. Comparing Multiple Drainage
Design Options
12 of 15
slides
Different design options. Comparing multiple benefits with parallel coordinates.
Comparing cost-benefits for different options.
13. Next Step: Beyond Evaluation -
Maximising Multiple Benefits
13 of 15
slides
• Design Consideration:
• Legislative Requirements
• Location
• Sizing
• Type & Order
• Identifying Trade-offs:
• Multiple benefits
• Multi-objective optimisation
?
?
?
?
?
?
photo's courtesy of University of Sheffield
photo's courtesy of XP Solutions
photo's courtesy of BME Imaging photo's courtesy of bfrss.org.uk
14. Conclusions 14 of 15
slides
• Challenges: lack of commonly agreed standard for sustainable
drainage design.
• Aim: to develop a new decision support system.
• Why green infrastructures? Because they can offer multiple
benefits in addition to water management.
• Quantifying green values with KPIs and monetary measures.
• A systematic evaluation framework - evidence-based
comparison, a better tool for optioneering.
• Integration with multi-objective optimisation – encourage the
consideration of multiple benefits.
• Research outputs for industrial sponsor: new features in their
drainage design software suite.
• “Essentially, all models are wrong, but some are useful.” –
Professor George E.P. Box photo's courtesy of Amazon
15. Thank you for your attention 15 of 15
slides
Any questions?
Many thanks to Prof. Dragan Savić who kindly agreed to present this for me!
jo-fai.chow@stream-idc.net
http://tinyurl.com/chow-ccwi2013
http://tinyurl.com/greenvalues
http://tinyurl.com/xpdrainage