Download to read offline

![REAL ESTATE MARKET REPORT
SINGLE FAMILY LAFAYETTE
Robbie Breaux & Team
Van Eaton & Romero
info@robbiebreaux.com
(337) 267-4099
839 OFF-MARKET (last 6 mos) [3] ABSORPTION RATE
Wednesday, September 3, 2014
A A
M M
A A
M M
A A
M M
A A
M M
A A
M M
88 85 $ 270,273
A A
M M
A A
22%
M M
A A
108
M M
A A
70
M M
A A
28
M M
A A
20
M M
A A
25
M M
A A
16
M M
A A
16
M M
A A
43
M M
Price Range Num
#
Market Totals 970 494 34%
Date Range (Off-Market & Sold) = 03/05/2014 to 09/03/2014
Data believed to be accurate but not guaranteed.
(months of inventory)
2.7
8.6
5.4
2.2
1.9
130
75
28% 42
$250,000 $299,999 85
$300,000 $349,999 59
$ 377,585
$350,000 $399,999 59
131
23
$ 38,797 $ 34,019 88%
$ 41,000 $ 38,000
77 $ 79,579 $ 74,432
$ 133,114 $ 129,004 97%
87 $ 178,026 $ 175,217
118
57
$ 134,900 $ 130,000
$ 382,321
102
$ 273,736
$ 270,000
61 $ 328,450
$ 224,082 98%
99%
$ 328,141
99%
98%
603
91
71 $ 226,900
185
98%
$ 178,900
56
$ 227,496
51
$ 227,900 $ 223,840 98%
91 $ 80,000 41
492
71
67 $ 132,000
33 159
$ 129,531
94%
$ 79,500 $ 74,000 93%
71
106
57
2 14%
$ 44,950
7
MARKET SUMMARY TABLE 494 PENDING [2]
$0 $49,999 12
325
169
Pend
Ratio
$ 43,003
Num
#
Num
#
Num
#
2990 SOLD/CLOSED (last 6 months) [4]
Days
on
Market
Original
List
Price
Final
List
Price
Sold/
Closed
Price
Days
on
Market
Current
List
Price
A = Average Value
M = Median Value
N/A = Not Available
970 ACTIVE [1]
List-
Sale
Ratio
Est.
Low High Mos.
93%
$50,000 $99,999 49
228 $ 77,822
11 18%
$100,000 $149,999 97
127
52 35% 96
34 96%
$ 184,500
$150,000 $199,999 266
178
90
$200,000 $249,999 171
119
910
$ 175,000 98%
$ 226,760
134 44%
$ 180,956
150 36% 206
299
38
39%
$ 268,000
103 $ 320,688
17
$ 276,067
55
85 $ 276,300
$ 323,158
73 $ 317,000 $ 322,450 98%
$ 374,168 98%
67 $ 375,856 62 $ 382,950 $ 375,000 98%
$400,000 $449,999 32
145 $ 432,078 117 $ 437,213
20 38% 25
$ 425,953 97%
117 $ 436,050 77 $ 437,500 $ 426,000 97%
$450,000 $499,999 40
145 $ 477,479 117 $ 484,143
12 23% 23
$ 469,107 97%
106 $ 474,950 46 $ 478,716 $ 463,500 97%
$500,000 $549,999 18
151 $ 524,253 100 $ 538,182
5 22% 13
$ 526,624 98%
162 $ 521,680 71 $ 543,750 $ 522,500 96%
$550,000 $599,999 9
164 $ 578,722 196 $ 591,280
4 31% 15
$ 572,756 97%
156 $ 575,000 134 $ 584,500 $ 575,000 98%
$600,000 $649,999 6
95 $ 620,467 145 $ 652,761
1 14% 6
$ 622,753 95%
93 $ 622,400 128 $ 649,500 $ 620,123 95%
$650,000 $699,999 11
122 $ 678,092 142 $ 701,457
2 15% 8
$ 678,231 97%
84 $ 689,000 105 $ 699,700 $ 685,000 98%
$700,000 + 56
241
156
$ 1,103,198
6 10% 48
240
150
$ 994,647 $ 961,582 97%
$ 964,950 $ 850,000
$ 825,000 97%
91 $ 227,433
839 2990
Market Averages 151 $ 297,938
$ 222,571 98%
Market Medians 86 $ 219,900 50 $ 195,000
Status = [1] A; [2] C, P; [3] X, W; [4] S
Area = B, C, D, E, F, G1, G2, G3, K, N, O, H, P
Property Type = DETACHED SINGLE FAMILY
$ 191,600 98%
1
1.8
1.2
1.8
1.7
1.7
2.7
3.3
2.3
4.1
7.8
Real Market Reports 3
www.RealMarketReports.com
Favors Sellers Favors Buyers
Market Summary Table](https://image.slidesharecdn.com/la00001singlefamilylafayette-140904082723-phpapp01/85/August-2014-Market-Report-4-320.jpg)
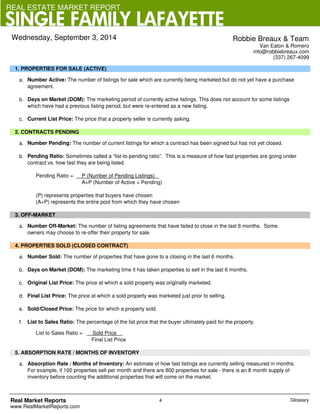

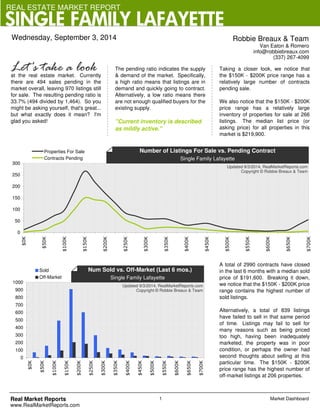
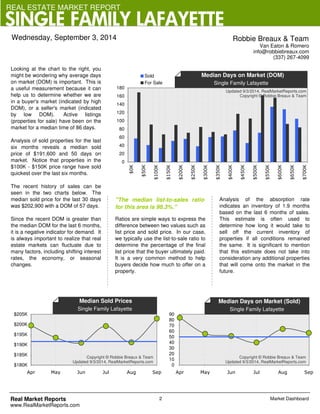
The real estate market report summarizes data on the single family home market in Lafayette, Louisiana in September 2014. There were 970 homes listed for sale with a median list price of $219,900. An additional 494 homes had pending contracts. In the last 6 months, 2990 homes sold with a median sale price of $191,600, while 839 listings were taken off the market without selling. The $150,000-$200,000 price range had the most homes both listed for sale and sold over the past 6 months. The report provides various metrics to analyze the current state of the real estate market.


