Download to read offline


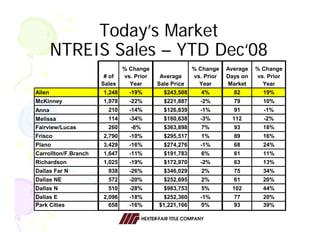
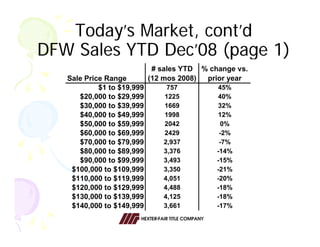
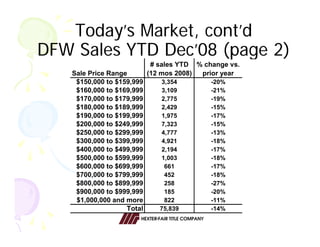
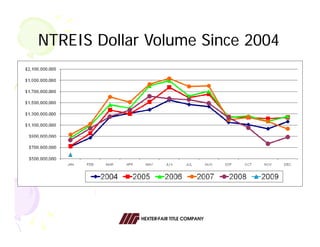
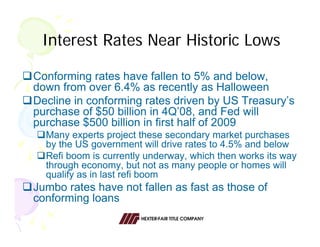
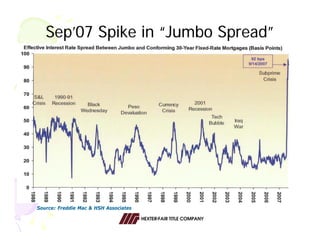

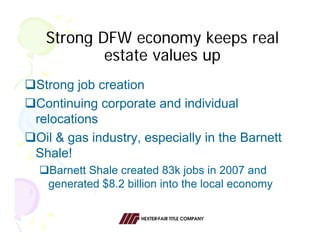
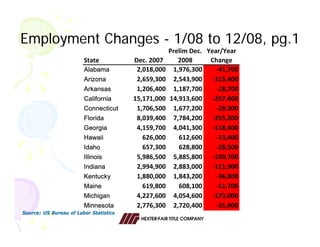
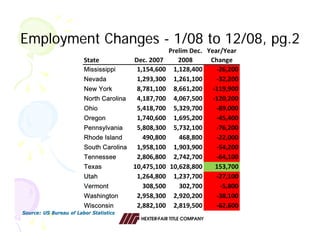
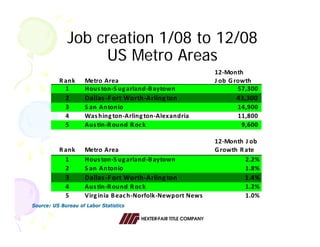
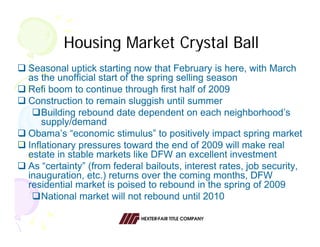
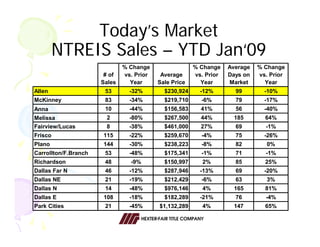

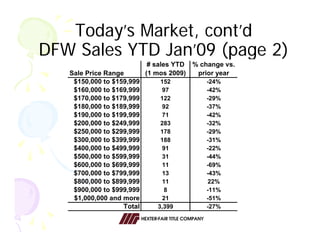
The document provides an overview and analysis of the current state of the DFW real estate market. It discusses: 1) Sales data from 2008 showing declines across the region from the prior year in both number of sales and average sale price. 2) Current historically low interest rates due to government intervention, though jumbo rates have not fallen as much. 3) The DFW economy remains strong with job growth and corporate relocations, helping prop up real estate values compared to the rest of the US.


