Download to read offline

![REAL ESTATE MARKET REPORT
SINGLE FAMILY LAFAYETTE
Sunday, January 5, 2014
Robbie Breaux & Team
Van Eaton & Romero
info@robbiebreaux.com
(337) 267-4099
345
MARKET SUMMARY TABLE
A = Average Value
M = Median Value
N/A = Not Available
Price Range
879
Low
High
$0
$49,999
18
$50,000
$99,999
51
$100,000
$149,999
76
$150,000
$199,999
243
$200,000
$249,999
171
$250,000
$299,999
100
$300,000
$349,999
50
$350,000
$399,999
37
$400,000
$449,999
22
$450,000
$499,999
23
$500,000
$549,999
9
$550,000
$599,999
9
$600,000
$649,999
3
$650,000
$699,999
10
$700,000
+
57
Market Totals
Current
List
Price
879
A
218
$
38,078
M
142
$
40,950
A
150
$
73,894
M
117
$
72,500
A
137
$ 131,648
M
86
$ 135,000
A
166
$ 181,063
M
122
$ 182,900
A
135
$ 226,982
M
101
$ 225,900
A
121
$ 273,968
M
99
$ 271,984
A
154
$ 325,060
M
106
$ 324,950
A
178
$ 378,562
M
143
$ 379,000
A
250
$ 427,734
M
181
$ 425,000
A
177
$ 475,243
M
89
$ 474,893
A
122
$ 535,867
M
123
$ 539,000
A
211
$ 578,533
M
116
$ 573,000
Num
#
Pend
Ratio
Num
#
1
5%
24
36
12
19%
44
77
46
38%
71
262
101
29%
119
547
91
35%
105
341
38
28%
31
173
26
34%
32
67
5
12%
19
56
11
33%
15
35
2
8%
12
14
5
12
3
13
83
$ 616,120
48
$ 615,000
3
12
A
126
$ 681,740
3
12
M
116
$ 685,000
A
214
$ 1,176,918
M
155
$ 906,000
22
18
508
ABSORPTION RATE
(months of inventory)
SOLD/CLOSED (last 6 months) [4]
Days
on
Market
Num
#
Original
List
Price
Final
List
Price
Sold/
Closed
Price
ListSale
Ratio
1675
0
3
25%
1
25%
1
9%
7
11%
345
A
M
OFF-MARKET (last 6 mos) [3]
1675
ACTIVE [1]
Days
on
Market
Num
#
508
PENDING [2]
28%
A
98
$
41,433
$
36,128
87%
M
41
$
43,000
$
38,500
90%
A
63
$
79,914
$
75,235
94%
M
34
$
79,900
$
75,000
94%
A
72
$ 132,159
$ 128,560
97%
M
33
$ 134,250
$ 130,000
97%
A
78
$ 176,886
$ 174,508
99%
M
47
$ 175,700
$ 174,000
99%
A
78
$ 227,196
$ 223,197
98%
M
50
$ 225,000
$ 220,900
98%
A
61
$ 272,698
$ 269,073
99%
M
26
$ 269,900
$ 267,000
99%
A
62
$ 331,130
$ 324,359
98%
M
39
$ 330,600
$ 325,000
98%
A
105
$ 384,305
$ 375,684
98%
M
54
$ 384,750
$ 380,000
99%
A
111
$ 437,489
$ 426,673
98%
M
58
$ 438,000
$ 427,430
98%
A
92
$ 483,607
$ 469,850
97%
M
55
$ 491,500
$ 466,000
95%
A
100
$ 536,115
$ 530,360
99%
M
66
$ 536,588
$ 536,588 100%
A
159
$ 596,223
$ 573,968
96%
M
160
$ 584,500
$ 578,000
99%
A
104
$ 644,523
$ 617,262
96%
M
81
$ 648,085
$ 616,000
95%
A
94
$ 703,001
$ 677,867
96%
M
30
$ 706,708
$ 685,000
97%
A
210
$ 1,068,579
$ 1,000,034
94%
M
43
$ 909,700
$ 850,000
93%
Est.
Mos.
3
4
1.7
2.7
3
3.5
4.5
4
3.8
9.9
4.5
4.2
1.5
5
19
3.1
Market Averages
157
$ 296,983
79
$ 226,302
$ 221,219 98%
Market Medians
115
$ 219,500
41
$ 193,900
$ 190,000 98%
Date Range (Off-Market & Sold) = 07/07/2013 to 01/05/2014
Data believed to be accurate but not guaranteed.
Favors Sellers
Favors Buyers
Status = [1] A; [2] C, P; [3] X, W; [4] S
Area = B, C, D, E, F, G1, G2, G3, K, N, O, H, P
Property Type = DETACHED SINGLE FAMILY
Real Market Reports
www.RealMarketReports.com
3
Market Summary Table](https://image.slidesharecdn.com/la00001singlefamilylafayette-140106082812-phpapp02/85/Lafayette-Market-Report-December-2013-4-320.jpg)

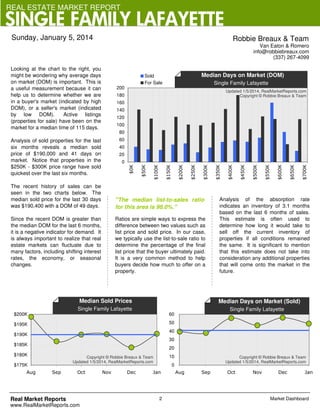
Current inventory in the single family Lafayette real estate market is described as mildly active, with 345 sales pending and 879 listings still for sale, resulting in a pending ratio of 28.2%. The $150,000 - $200,000 price range has both a relatively large number of pending contracts and listings available. A total of 1675 contracts have closed in the last 6 months with a median sold price of $190,000, most commonly in the $150,000 - $200,000 range. The median list-to-sales ratio for this area is 98.0%.


