Download to read offline


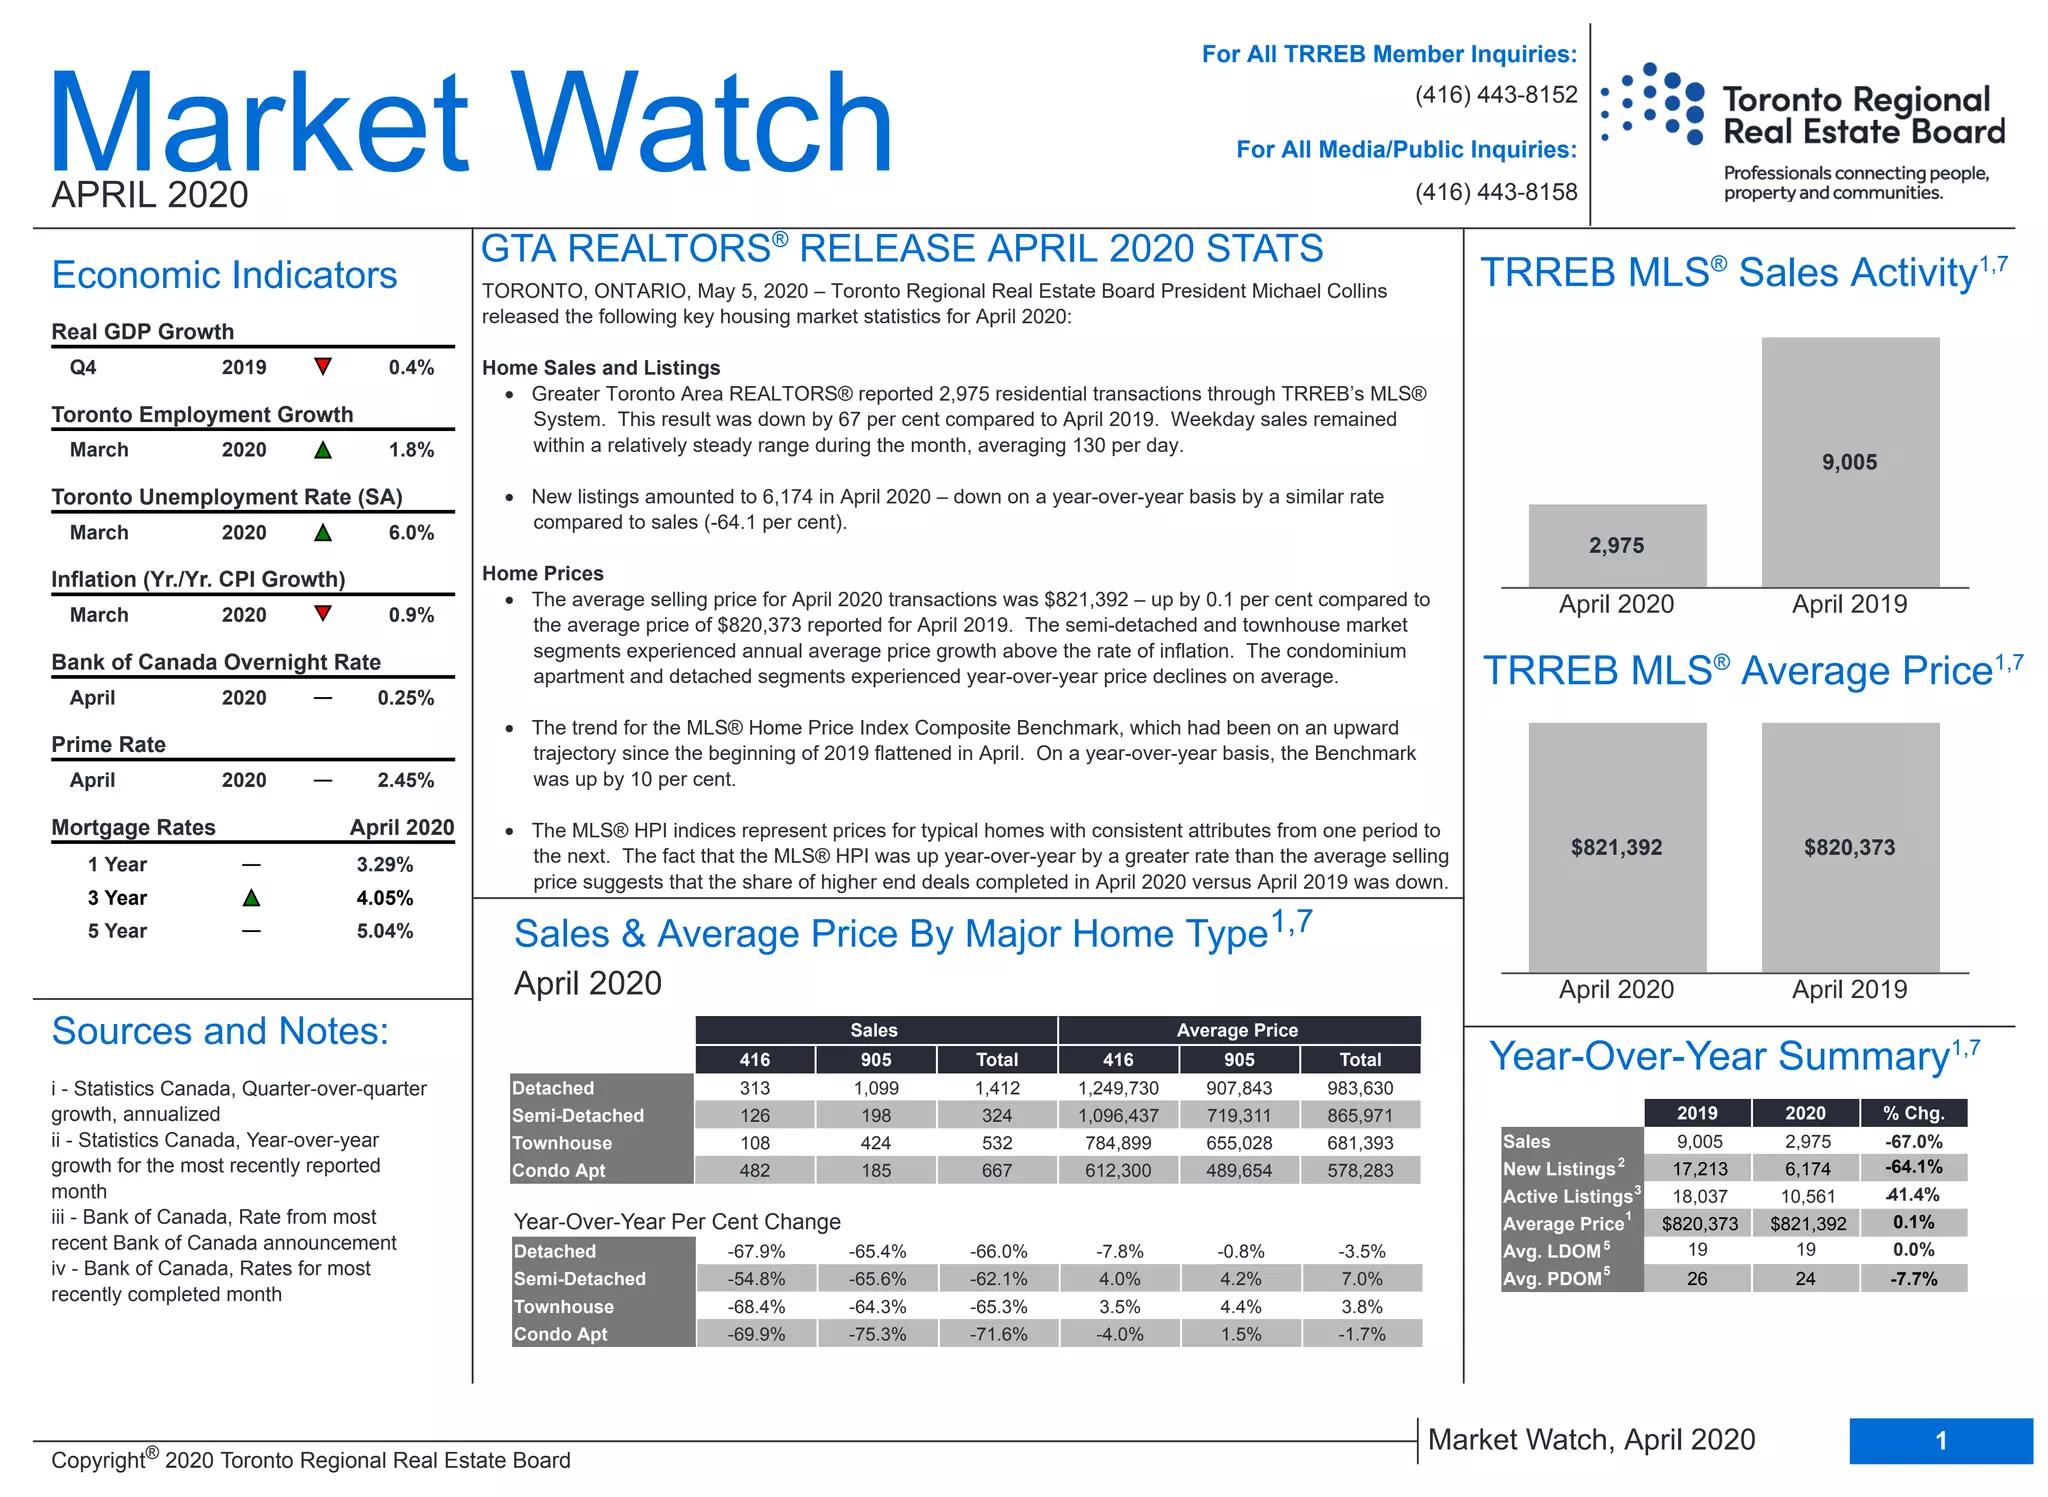


The Toronto Regional Real Estate Board (TRREB) reported a significant drop in residential transactions in April 2020, with home sales plummeting by 67% compared to the previous year. While the average selling price of homes slightly increased by 0.1% to $821,392, the market saw varied price trends across different property types, particularly with detached homes experiencing declines. The ongoing COVID-19 pandemic has heavily impacted the real estate market, freezing activity and causing a substantial decline in new listings as well.


