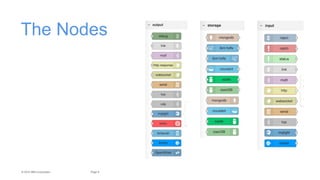
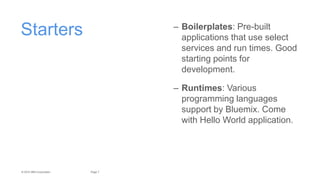
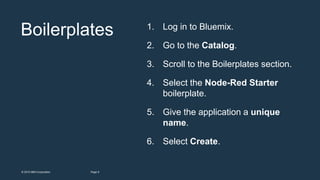
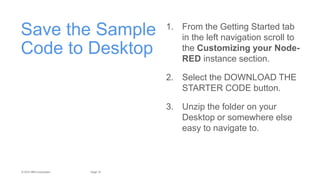
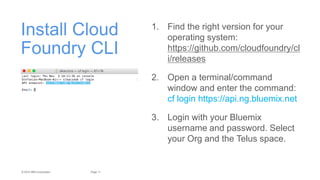
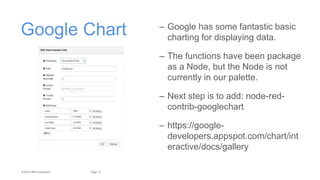
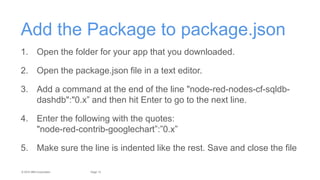
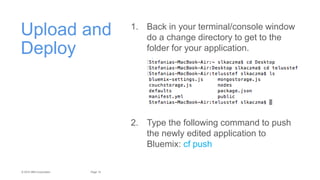
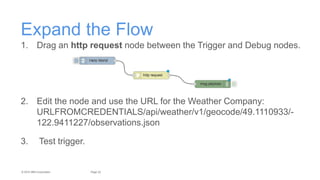
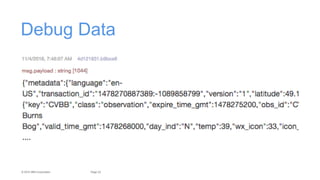
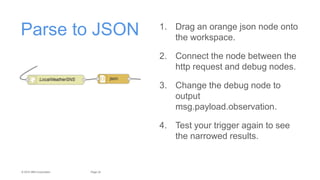
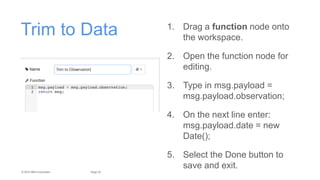
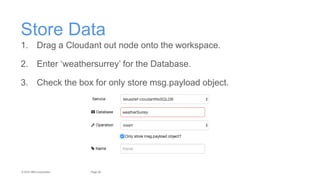
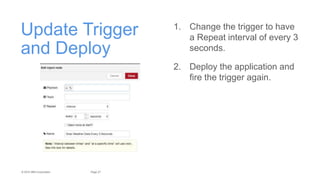
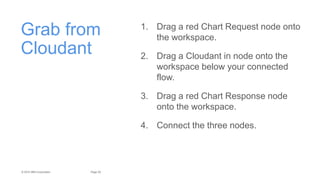
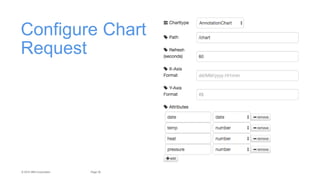
© 2015 IBM Corporation
Stefania Kaczmarczyk
Developer Advocate
Prototyping in Node-RED
2Page© 2015 IBM Corporation
Resources
– Getting started with Watson IoT and Node-RED:
https://developer.ibm.com/recipes/tutorials/getting-started-with-
watson-iot-platform-using-node-red/
– More Node-RED Tutorials: https://github.com/watson-developer-
cloud/node-red-labs
– Connect a Pi to Watson IoT and Node-RED:
https://www.sitepoint.com/connecting-a-raspberry-pi-to-ibm-watson-
and-bluemix/
3Page© 2015 IBM Corporation
Wire Framing and
Visual Programming
Introduction to Node-RED
4Page© 2015 IBM Corporation
Node-RED – A visual tool for wiring the
Internet of Things (IoT).
– While most programming in
Node-RED is done visually
using pre-defined
function/nodes, any additional
functionality can be added in
JavaScript
– Added to the JavaScript
Foundation in October 2016
5Page© 2015 IBM Corporation
The Nodes
© 2015 IBM Corporation
Deploy the Boilerplate
7Page© 2015 IBM Corporation
Starters – Boilerplates: Pre-built
applications that use select
services and run times. Good
starting points for
development.
– Runtimes: Various
programming languages
support by Bluemix. Come
with Hello World application.
8Page© 2015 IBM Corporation
Boilerplates 1. Log in to Bluemix.
2. Go to the Catalog.
3. Scroll to the Boilerplates section.
4. Select the Node-Red Starter
boilerplate.
5. Give the application a unique
name.
6. Select Create.
9Page© 2015 IBM Corporation
Edit Code Locally
New Nodes
10Page© 2015 IBM Corporation
Save the Sample
Code to Desktop
1. From the Getting Started tab
in the left navigation scroll to
the Customizing your Node-
RED instance section.
2. Select the DOWNLOAD THE
STARTER CODE button.
3. Unzip the folder on your
Desktop or somewhere else
easy to navigate to.
11Page© 2015 IBM Corporation
Install Cloud
Foundry CLI
1. Find the right version for your
operating system:
https://github.com/cloudfoundry/cl
i/releases
2. Open a terminal/command
window and enter the command:
cf login https://api.ng.bluemix.net
3. Login with your Bluemix
username and password. Select
your Org and the Telus space.
12Page© 2015 IBM Corporation
Google Chart – Google has some fantastic basic
charting for displaying data.
– The functions have been package
as a Node, but the Node is not
currently in our palette.
– Next step is to add: node-red-
contrib-googlechart
– https://google-
developers.appspot.com/chart/int
eractive/docs/gallery
13Page© 2015 IBM Corporation
Add the Package to package.json
1. Open the folder for your app that you downloaded.
2. Open the package.json file in a text editor.
3. Add a command at the end of the line "node-red-nodes-cf-sqldb-
dashdb":"0.x” and then hit Enter to go to the next line.
4. Enter the following with the quotes:
"node-red-contrib-googlechart”:”0.x”
5. Make sure the line is indented like the rest. Save and close the file
14Page© 2015 IBM Corporation
Upload and
Deploy
1. Back in your terminal/console window
do a change directory to get to the
folder for your application.
2. Type the following command to push
the newly edited application to
Bluemix: cf push
15Page© 2015 IBM Corporation
View Your New Nodes
16Page© 2015 IBM Corporation
More Nodes… http://flows.nodered.org/
17Page© 2015 IBM Corporation
Debug
First Flow
18Page© 2015 IBM Corporation
Node Basics
– Drag and drop to place nodes on the white workspace.
– Double-click a node to open the edit pane.
– Select a node and look at the Info tab on the right to see information
about implementing.
– Switch to the debug tab to see live logs like you would see in the
console.
– Red button at the top indicates there are new updates. Click Deploy
to push the changes live.
19Page© 2015 IBM Corporation
Simple Start – Inject Node: Acts like a
trigger and inserts text,
numeric, or other data into a
flow.
– Debug Node: Exports all
output data from that flow to
the Debug tab. Critical for
testing and troubleshooting.
20Page© 2015 IBM Corporation
Call an API
Expand Flow with
Weather Company
21Page© 2015 IBM Corporation
Weather
Company
Data
1. Go the Catalog in Bluemix.
2. Navigation to the Data & Analytics
section.
3. Add an instance of the Weather
Company Data service.
4. Switch to the Service Credentials tab and
copy the JSON for Credentials-1.
22Page© 2015 IBM Corporation
Expand the Flow
1. Drag an http request node between the Trigger and Debug nodes.
2. Edit the node and use the URL for the Weather Company:
URLFROMCREDENTIALS/api/weather/v1/geocode/49.1110933/-
122.9411227/observations.json
3. Test trigger.
23Page© 2015 IBM Corporation
Debug Data
24Page© 2015 IBM Corporation
Parse to JSON 1. Drag an orange json node onto
the workspace.
2. Connect the node between the
http request and debug nodes.
3. Change the debug node to
output
msg.payload.observation.
4. Test your trigger again to see
the narrowed results.
25Page© 2015 IBM Corporation
Trim to Data 1. Drag a function node onto
the workspace.
2. Open the function node for
editing.
3. Type in msg.payload =
msg.payload.observation;
4. On the next line enter:
msg.payload.date = new
Date();
5. Select the Done button to
save and exit.
26Page© 2015 IBM Corporation
Store Data
1. Drag a Cloudant out node onto the workspace.
2. Enter ‘weathersurrey’ for the Database.
3. Check the box for only store msg.payload object.
27Page© 2015 IBM Corporation
Update Trigger
and Deploy
1. Change the trigger to have
a Repeat interval of every 3
seconds.
2. Deploy the application and
fire the trigger again.
28Page© 2015 IBM Corporation
Cloudant and Google Chart
Data Recall
29Page© 2015 IBM Corporation
Grab from
Cloudant
1. Drag a red Chart Request node onto
the workspace.
2. Drag a Cloudant in node onto the
workspace below your connected
flow.
3. Drag a red Chart Response node
onto the workspace.
4. Connect the three nodes.
30Page© 2015 IBM Corporation
Configure Chart
Request
31Page© 2015 IBM Corporation
Configure Cloudant In
32Page© 2015 IBM Corporation
Configure Chart
Reponse
1. Connect a function node
between Cloudant In and Chart
Response nodes.
2. Create a loop to format the
payload for the chart display.
Date must be first.
33Page© 2015 IBM Corporation
Debug and
Deploy
1. Add a debug node and
connect it to the function
node.
2. Deploy the updated flow.
3. Navigation to your web URL
and append /chart to the
end
4. You should now see your
annotation chart.

AT&T Hack Dallas Node-RED Tutorial

  • 1.
    © 2015 IBMCorporation Stefania Kaczmarczyk Developer Advocate Prototyping in Node-RED
  • 2.
    2Page© 2015 IBMCorporation Resources – Getting started with Watson IoT and Node-RED: https://developer.ibm.com/recipes/tutorials/getting-started-with- watson-iot-platform-using-node-red/ – More Node-RED Tutorials: https://github.com/watson-developer- cloud/node-red-labs – Connect a Pi to Watson IoT and Node-RED: https://www.sitepoint.com/connecting-a-raspberry-pi-to-ibm-watson- and-bluemix/
  • 3.
    3Page© 2015 IBMCorporation Wire Framing and Visual Programming Introduction to Node-RED
  • 4.
    4Page© 2015 IBMCorporation Node-RED – A visual tool for wiring the Internet of Things (IoT). – While most programming in Node-RED is done visually using pre-defined function/nodes, any additional functionality can be added in JavaScript – Added to the JavaScript Foundation in October 2016
  • 5.
    5Page© 2015 IBMCorporation The Nodes
  • 6.
    © 2015 IBMCorporation Deploy the Boilerplate
  • 7.
    7Page© 2015 IBMCorporation Starters – Boilerplates: Pre-built applications that use select services and run times. Good starting points for development. – Runtimes: Various programming languages support by Bluemix. Come with Hello World application.
  • 8.
    8Page© 2015 IBMCorporation Boilerplates 1. Log in to Bluemix. 2. Go to the Catalog. 3. Scroll to the Boilerplates section. 4. Select the Node-Red Starter boilerplate. 5. Give the application a unique name. 6. Select Create.
  • 9.
    9Page© 2015 IBMCorporation Edit Code Locally New Nodes
  • 10.
    10Page© 2015 IBMCorporation Save the Sample Code to Desktop 1. From the Getting Started tab in the left navigation scroll to the Customizing your Node- RED instance section. 2. Select the DOWNLOAD THE STARTER CODE button. 3. Unzip the folder on your Desktop or somewhere else easy to navigate to.
  • 11.
    11Page© 2015 IBMCorporation Install Cloud Foundry CLI 1. Find the right version for your operating system: https://github.com/cloudfoundry/cl i/releases 2. Open a terminal/command window and enter the command: cf login https://api.ng.bluemix.net 3. Login with your Bluemix username and password. Select your Org and the Telus space.
  • 12.
    12Page© 2015 IBMCorporation Google Chart – Google has some fantastic basic charting for displaying data. – The functions have been package as a Node, but the Node is not currently in our palette. – Next step is to add: node-red- contrib-googlechart – https://google- developers.appspot.com/chart/int eractive/docs/gallery
  • 13.
    13Page© 2015 IBMCorporation Add the Package to package.json 1. Open the folder for your app that you downloaded. 2. Open the package.json file in a text editor. 3. Add a command at the end of the line "node-red-nodes-cf-sqldb- dashdb":"0.x” and then hit Enter to go to the next line. 4. Enter the following with the quotes: "node-red-contrib-googlechart”:”0.x” 5. Make sure the line is indented like the rest. Save and close the file
  • 14.
    14Page© 2015 IBMCorporation Upload and Deploy 1. Back in your terminal/console window do a change directory to get to the folder for your application. 2. Type the following command to push the newly edited application to Bluemix: cf push
  • 15.
    15Page© 2015 IBMCorporation View Your New Nodes
  • 16.
    16Page© 2015 IBMCorporation More Nodes… http://flows.nodered.org/
  • 17.
    17Page© 2015 IBMCorporation Debug First Flow
  • 18.
    18Page© 2015 IBMCorporation Node Basics – Drag and drop to place nodes on the white workspace. – Double-click a node to open the edit pane. – Select a node and look at the Info tab on the right to see information about implementing. – Switch to the debug tab to see live logs like you would see in the console. – Red button at the top indicates there are new updates. Click Deploy to push the changes live.
  • 19.
    19Page© 2015 IBMCorporation Simple Start – Inject Node: Acts like a trigger and inserts text, numeric, or other data into a flow. – Debug Node: Exports all output data from that flow to the Debug tab. Critical for testing and troubleshooting.
  • 20.
    20Page© 2015 IBMCorporation Call an API Expand Flow with Weather Company
  • 21.
    21Page© 2015 IBMCorporation Weather Company Data 1. Go the Catalog in Bluemix. 2. Navigation to the Data & Analytics section. 3. Add an instance of the Weather Company Data service. 4. Switch to the Service Credentials tab and copy the JSON for Credentials-1.
  • 22.
    22Page© 2015 IBMCorporation Expand the Flow 1. Drag an http request node between the Trigger and Debug nodes. 2. Edit the node and use the URL for the Weather Company: URLFROMCREDENTIALS/api/weather/v1/geocode/49.1110933/- 122.9411227/observations.json 3. Test trigger.
  • 23.
    23Page© 2015 IBMCorporation Debug Data
  • 24.
    24Page© 2015 IBMCorporation Parse to JSON 1. Drag an orange json node onto the workspace. 2. Connect the node between the http request and debug nodes. 3. Change the debug node to output msg.payload.observation. 4. Test your trigger again to see the narrowed results.
  • 25.
    25Page© 2015 IBMCorporation Trim to Data 1. Drag a function node onto the workspace. 2. Open the function node for editing. 3. Type in msg.payload = msg.payload.observation; 4. On the next line enter: msg.payload.date = new Date(); 5. Select the Done button to save and exit.
  • 26.
    26Page© 2015 IBMCorporation Store Data 1. Drag a Cloudant out node onto the workspace. 2. Enter ‘weathersurrey’ for the Database. 3. Check the box for only store msg.payload object.
  • 27.
    27Page© 2015 IBMCorporation Update Trigger and Deploy 1. Change the trigger to have a Repeat interval of every 3 seconds. 2. Deploy the application and fire the trigger again.
  • 28.
    28Page© 2015 IBMCorporation Cloudant and Google Chart Data Recall
  • 29.
    29Page© 2015 IBMCorporation Grab from Cloudant 1. Drag a red Chart Request node onto the workspace. 2. Drag a Cloudant in node onto the workspace below your connected flow. 3. Drag a red Chart Response node onto the workspace. 4. Connect the three nodes.
  • 30.
    30Page© 2015 IBMCorporation Configure Chart Request
  • 31.
    31Page© 2015 IBMCorporation Configure Cloudant In
  • 32.
    32Page© 2015 IBMCorporation Configure Chart Reponse 1. Connect a function node between Cloudant In and Chart Response nodes. 2. Create a loop to format the payload for the chart display. Date must be first.
  • 33.
    33Page© 2015 IBMCorporation Debug and Deploy 1. Add a debug node and connect it to the function node. 2. Deploy the updated flow. 3. Navigation to your web URL and append /chart to the end 4. You should now see your annotation chart.