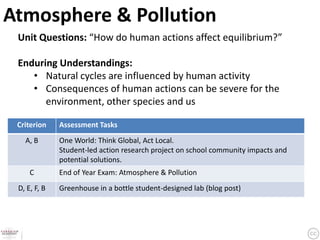
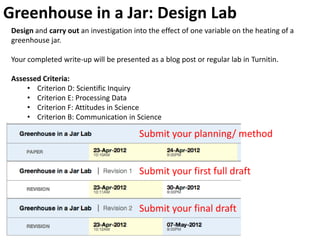
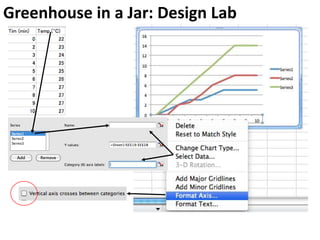
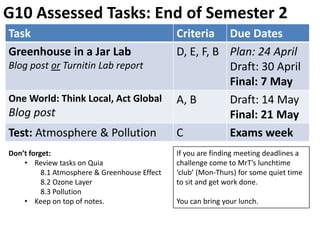
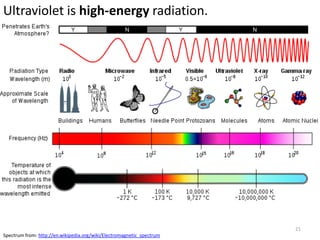
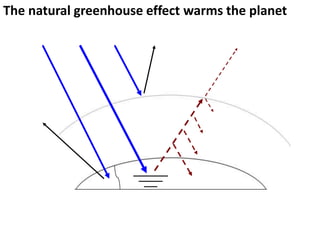
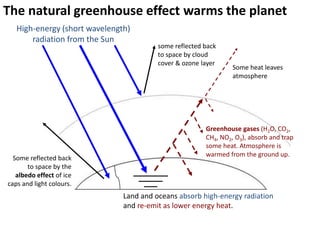
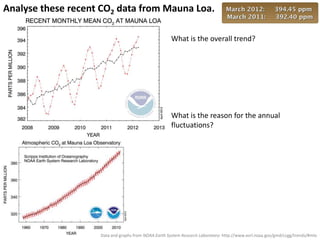
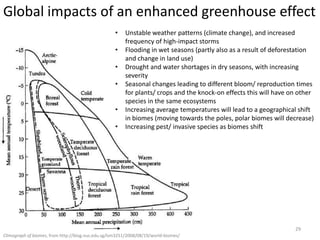
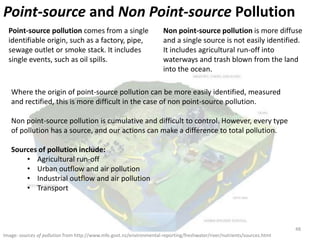
This document provides an overview of a unit on atmosphere and pollution from a Canadian environmental science academy. It includes unit questions, enduring understandings, assessment criteria, and topics to be covered such as the composition and layers of the atmosphere, the greenhouse effect, ozone layer, and air pollution. Students will conduct projects and exams to demonstrate their understanding of how human actions affect atmospheric equilibrium and the consequences for the environment.
2. Atmosphere & Pollution
Unit Questions: “How do human actions affect equilibrium?”
Enduring Understandings:
• Natural cycles are influenced by human activity
• Consequences of human actions can be severe for the
environment, other species and us
Criterion Assessment Tasks
A, B One World: Think Global, Act Local.
Student-led action research project on school community impacts and
potential solutions.
C End of Year Exam: Atmosphere & Pollution
D, E, F, B Greenhouse in a bottle student-designed lab (blog post)
3. Atmosphere & Greenhouse Effect
What is the atmosphere?
What is it made of?
How does the natural greenhouse effect work?
How are we impacting it?
3
http://apod.nasa.gov/apod/image/0703/horizonmoon_nasa_big.jpg
4. Atmosphere & Greenhouse Effect
• Annotate a diagram to describe the composition of the Earth's atmosphere
• Analyse data to explain why temperature varies with altitude
• Explain the natural greenhouse effect and its importance on Earth
• State that water vapour, carbon dioxide, oxides of nitrogen and methane are
greenhouse gases
• Explain the enhanced greenhouse effect
• Outline some effects of increasing global temperatures
4
5. What do you think?
It’s colder at the top because
there is less atmosphere.
It’s colder at the top because it is
further from the ground.
It’s warmer at the top because it
is closer to the Sun.
5
mountain from: http://www.easyvectors.com/browse/other/kliponius-mountain-in-a-cartoon-style-clip-art
6. How do temperature and pressure change with altitude?
Sketch your predictions on a whiteboard and explain to a partner.
Altitude
Altitude
Temperature Pressure
7. How do temperature and pressure change with altitude?
Altitude
Altitude
Temperature Pressure
Plot the data. Annotate them to explain the patterns. Evaluate your predictions.
8. A journey through the atmosphere
http://www.youtube.com/watch?v=3CerJbZ-dm0
8
9. Temperature and the Atmosphere
Layers of the Atmosphere, from: http://burro.cwru.edu/Academics/Astr201/Atmosphere/atmosphere1.html
10. Layers of the Atmosphere
Layer Range (km) Characteristics
Temperature increases with height
Very low pressure, low density of molecules
Mesopause*
Thermosphere International Space Station orbits here
to 350-800km Aurora borealis (Northern Lights) due to ionization of
atmosphere by solar radiation
Stratopause* Very cold
Mesosphere Meteors burn up in this layer
to 80-85km
Temperature increases with height
Tropopause*
Stratosphere Ozone layer is here, protecting Earth from UV radiation
to ≈51km Very low pressure
Temperature decreases with height – heated from the
ground up
Surface to 9-
Troposphere Atmosphere thins with height
17km Contains 80% of atmosphere (high density particles)
Turbulent and changeable weather (lots of mixing)
Layers of the Atmosphere, from: http://en.wikipedia.org/wiki/Earth%27s_atmosphere
11. Can you remember the Layers of the Atmosphere?
Layer Range (km) Characteristics
Mesopause*
to 350-800km
Stratopause*
to 80-85km
Tropopause*
to ≈51km
Surface to 9-
17km
12. Layers of the Atmosphere
Layer Range (km) Characteristics
Temperature increases with height
Very low pressure, low density of molecules
Mesopause*
Thermosphere International Space Station orbits here
to 350-800km Aurora borealis (Northern Lights) due to ionization of
atmosphere by solar radiation
Stratopause* Very cold
Mesosphere Meteors burn up in this layer
to 80-85km
Temperature increases with height
Tropopause*
Stratosphere Ozone layer is here, protecting Earth from UV radiation
to ≈51km Very low pressure
Temperature decreases with height – heated from the
ground up
Surface to 9-
Troposphere Atmosphere thins with height
17km Contains 80% of atmosphere (high density particles)
Turbulent and changeable weather (lots of mixing)
Layers of the Atmosphere, from: http://en.wikipedia.org/wiki/Earth%27s_atmosphere
13. Composition of the Atmosphere
parts per million
Gas % of atmosphere Sources
by volume (ppmv)
Nitrogen Volcanoes, decomposition of dead
780,840.00 ≈78 organic matter.
(N2)
Photosynthesis by land plants (about
Oxygen (O2) 209,460.00 ≈21 50%) and phytoplankton (about 50%)
Carbon
Decomposition, respiration,
dioxide 394.45 ≈0.04 combustion.
(CO2)
Nitrogen and oxygen are not greenhouse gases.
They do not trap heat or contribute to warming.
This small part of the atmosphere: CO2, water vapour,
CH4, NO2 and O3 is responsible for heating.
14. Changes in the Atmosphere
Natural and anthropogenic (human) sources change the composition of the atmosphere.
volcanoes & vents
(CO2, NO2, S, CH4)
Image source: NASA
15. Greenhouse in a Jar
Set up the trial investigation on a sunny day and record your results.
• Keep recording until the temperature stabilises (3 recordings in a row)
• How will you get the jars to cool down to be reset for another run?
Analyse your results.
Explain your findings.
How is this analagous to
the greenhouse effect?
Evaluate this method:
• Sources of error/ limitations?
• Sufficient relevant data?
• What needs to be controlled better?
Consider all of these in the design of your
own project.
16. Greenhouse in a Jar: Design Lab
Design and carry out an investigation into the effect of one variable on the heating of a
greenhouse jar.
Your completed write-up will be presented as a blog post or regular lab in Turnitin.
Assessed Criteria:
• Criterion D: Scientific Inquiry
• Criterion E: Processing Data
• Criterion F: Attitudes in Science
• Criterion B: Communication in Science
Submit your planning/ method
Submit your first full draft
Submit your final draft
17. Greenhouse in a Jar: Design Lab
Compare these data sets.
• Which shows the clearest difference?
• Identify five ways in which the presentation of the data can be improved.
19. G10 Assessed Tasks: End of Semester 2
Task Criteria Due Dates
Greenhouse in a Jar Lab D, E, F, B Plan: 24 April
Blog post or Turnitin Lab report Draft: 30 April
Final: 7 May
One World: Think Local, Act Global A, B Draft: 14 May
Blog post Final: 21 May
Test: Atmosphere & Pollution C Exams week
Don’t forget: If you are finding meeting deadlines a
• Review tasks on Quia challenge come to MrT’s lunchtime
8.1 Atmosphere & Greenhouse Effect ‘club’ (Mon-Thurs) for some quiet time
8.2 Ozone Layer to sit and get work done.
8.3 Pollution
• Keep on top of notes. You can bring your lunch.
20. Ultraviolet is high-energy radiation.
Frequency (Hz) Wavelength
higher energy
Visible Spectrum
used in
photosynthesis
UV is high-energy.
It is damaging to cells. green not used in
photosynthesis
used in
Infra-red is low-energy.
photosynthesis
lower energy
We detect it as heat.
20
Spectrum adapted from: http://en.wikipedia.org/wiki/Electromagnetic_spectrum
21. Ultraviolet is high-energy radiation.
21
Spectrum from: http://en.wikipedia.org/wiki/Electromagnetic_spectrum
23. The natural greenhouse effect warms the planet
High-energy (short wavelength)
radiation from the Sun
some reflected back
to space by cloud
cover & absorbed by
Some heat leaves
the ozone layer
atmosphere
Greenhouse gases (H2O, CO2,
CH4, NO2, O3), absorb and trap
some heat. Atmosphere is
warmed from the ground up.
Some reflected back
to space by the
albedo effect of ice
caps and light colours.
Land and oceans absorb high-energy radiation
and re-emit as lower energy heat.
24. A closer look at the greenhouse effect
How do greenhouse gases affect the
climate? Explore the atmosphere
during the ice age and today.
What happens when you add clouds?
Change the greenhouse gas
concentration and see how the
temperature changes. Then compare
to the effect of glass panes.
Zoom in and see how light interacts
with molecules.
Do all atmospheric gases contribute to
the greenhouse effect?
http://phet.colorado.edu/en/simulation/greenhouse
25. How have we affected GHG concentrations?
ppm = parts per million
Data and graphs from NOAA Earth System Research Laboratory: http://www.esrl.noaa.gov/gmd/ccgg/trends/#mlo
26. How have we affected GHG concentrations?
ppm = parts per million
Remember:
• These GHG’s make up a very small part of the
whole atmosphere, yet have a large impact on
heating the planet.
• So what appear to be small changes in the
quantity of these gases in the atmosphere
could be having significant warming impacts.
Data and graphs from NOAA Earth System Research Laboratory: http://www.esrl.noaa.gov/gmd/ccgg/trends/#mlo
27. Analyse these recent CO2 data from Mauna Loa.
What is the overall trend?
What is the reason for the annual
fluctuations?
Data and graphs from NOAA Earth System Research Laboratory: http://www.esrl.noaa.gov/gmd/ccgg/trends/#mlo
28. Analyse these recent CO2 data from Mauna Loa.
What is the overall trend?
What is the reason for the annual
fluctuations?
Earth’s tilt and seasons:http://www.nationsonline.org/oneworld/earth.htm
Data and graphs from NOAA Earth System Research Laboratory: http://www.esrl.noaa.gov/gmd/ccgg/trends/#mlo
29. Global impacts of an enhanced greenhouse effect
• Unstable weather patterns (climate change), and increased
frequency of high-impact storms
• Flooding in wet seasons (partly also as a result of deforestation
and change in land use)
• Drought and water shortages in dry seasons, with increasing
severity
• Seasonal changes leading to different bloom/ reproduction times
for plants/ crops and the knock-on effects this will have on other
species in the same ecosystems
• Increasing average temperatures will lead to a geographical shift
in biomes (moving towards the poles, polar biomes will decrease)
• Increasing pest/ invasive species as biomes shift
29
Climograph of biomes, from http://blog.nus.edu.sg/lsm3251/2008/08/19/world-biomes/
30. http://www.arctic.noaa.gov/reportcard/
Access the NOAA’s most recent Arctic Report
Card. Watch the video and look through the
main chapters. Outline how the arctic
ecosystem is changing over recent years.
Think & Discuss
What is the effect of reduced ice caps on:
• The albedo effect?
• Absorption of radiation from the Sun?
• Warming?
• Release of further GHG’s from dead
organisms trapped in the ice?
30
http://www.buzzfeed.com/expresident/animals-who-are-extremely-disappointed-in-you
32. Ozone layer scientist who 'saved the world' dies
F Sherwood Rowland:
• What did he do?
• How does the ozone layer work?
• How have we damaged the ozone layer?
• How can we repair the damage?
http://gu.com/p/3653a
33. Ozone Layer & Air Pollution
• Describe the damaging effects of UV radiation on biological systems
• Explain how the ozone layer shields the Earth from much of the Sun's harmful
radiation
• Explain how chlorofluorocarbons (CFC's) damage the ozone layer
• Describe the formation and effects of a hole in the ozone layer
• Discuss the impacts of the Montreal Protocol on the hole in the ozone layer
• List five main air pollutants and their source
• Identify the primary air pollutants in urban areas
• Describe the formation of smog
• Outline the effect of thermal inversion on trapping air pollution
2006: Record ozone hole from: 33
http://earthobservatory.nasa.gov/IOTD/view.php?id=7044
34. There’s good ozone and there’s bad ozone…
When it’s up in the stratosphere, ozone is broken from O3 to O2 by UV
radiation. This reduces the levels of UV reaching the Earth. CFC’s and
other chemicals have resulted in holes forming in this protective layer.
Over 93% of UV radiation which reaches us is absorbed by the ozone layer.
2O3 UV energy
3O2
slowly reforms
But when it’s down in the troposphere, the reactions of ozone can be very
harmful to human health, damaging lungs. Vehicle exhausts are prime culprits.
34
35. Ultraviolet is high-energy radiation.
Frequency (Hz) Wavelength
higher energy
Visible Spectrum
used in
photosynthesis
UV is high-energy.
It is damaging to cells. green not used in
photosynthesis
used in
Infra-red is low-energy.
photosynthesis
lower energy
We detect it as heat.
35
Spectrum adapted from: http://en.wikipedia.org/wiki/Electromagnetic_spectrum
36. Ultraviolet is high-energy radiation.
36
Spectrum from: http://en.wikipedia.org/wiki/Electromagnetic_spectrum
37. UV radiation damages biological systems
High-energy UV radiation coming in from the Sun is useful in the right
amount, but damaging to biological systems in excess:
• Damage to DNA mutations, cancers and cell damage
• Damage to plants and phytoplankton reduced productivity
• Increasing heat absorption of land and water and contributing to
warming, ice melting, loss of habitats, forest fires, drought.
What happens to productivity if UV radiation increases?
http://www.ciesin.org/docs/011-467/011-467.html
38.
39. The Ozone layer protects us from UV radiation
Over 93% of UV radiation which reaches us is absorbed by the ozone layer.
2O3 UV energy
3O2
slowly reforms
Ozone is triatomic oxygen (O3), which usually only forms at high altitudes
(it’s in the stratosphere). UV energy splits ozone into single diatomic oxygen
molecules. This uses energy from the UV. Ozone molecules can re-form.
40. The Ozone layer protects us from UV radiation
Over 93% of UV radiation which reaches us is absorbed by the ozone layer.
2O3 UV energy
3O2
slowly reforms
Ozone is triatomic oxygen (O3), which usually only forms at high altitudes
(it’s in the stratosphere). UV energy splits ozone into single diatomic oxygen
molecules. This uses energy from the UV. Ozone molecules can re-form.
The formation of holes in the ozone layer as a result of
CFC release into the atmosphere is disastrous.
Chlorofluorocarbons (CFC’s) are a result of:
• Refrigeration
• Air conditioning
• De-greasing and cleaning agents
• Foam-blowing
• Aeorosol propellants
Since it was recognised that CFC’s led to an ozone
hole, much of their production is being phased out.
42. Why do holes form in the polar regions?
We produced chemicals, such as CFC’s, which are released into the
atmosphere. At very cold temperatures, these are split by UV radiation,
releasing chlorine molecules, which then catalyse the breakdown of
many ozone molecules. Complete breakdown of ozone leaves a hole in
the ozone layer and reduced protection from UV radiation.
NASA Explanation
http://www.youtube.com/watch?v=qUfVMogIdr8
43. The Montreal Protocol
The Montreal Protocol on Substances
that Deplete the Ozone Layer was
signed in 1987 and ratified by over 197
states. It is an international agreement
to phase out and eventually halt the
production and use of CFC’s and other
known ozone-depleting chemicals.
Outline the patterns and trends in the
dataset to the right.
What have been the impacts of the
treaty on global atmospheric levels of
ozone-depleting chemicals?
Find out: What effect has this had on
the hole in the ozone layer?
Atmospheric levels of chlorine: http://www.environment.gov.au/soe/2006/publications/drs/indicator/14/index.html
44. The Montreal Protocol’s effects on ozone depletion
The effects of the protocol are not instant.
2006: A record year
The hole has continued to increase in size,
as CFC’s and other chemicals remain in the
atmosphere for a long time.
Also, the protocol calls for phasing-out,
which means that some are still being
produced, though in reduced amounts.
Ozone-hole in 1996: http://ozonewatch.gsfc.nasa.gov/
46. Pollution
What was the effect of the Beijing Olympics on air quality?
What does this study show about the impacts of air pollution on
human health?
Image: 'Beijing smog' 46
http://www.flickr.com/photos/12836528@N00/386198516 http://www.youtube.com/watch?v=SrQzPUn42VY
47. Point-source and Non Point-source Pollution
Point-source pollution comes from a single Non point-source pollution is more diffuse
identifiable origin, such as a factory, pipe, and a single source is not easily identified.
sewage outlet or smoke stack. It includes It includes agricultural run-off into
single events, such as oil spills. waterways and trash blown from the land
into the ocean.
47
Image: sources of pollution from http://www.mfe.govt.nz/environmental-reporting/freshwater/river/nutrients/sources.html
48. Point-source and Non Point-source Pollution
Point-source pollution comes from a single Non point-source pollution is more diffuse
identifiable origin, such as a factory, pipe, and a single source is not easily identified.
sewage outlet or smoke stack. It includes It includes agricultural run-off into
single events, such as oil spills. waterways and trash blown from the land
into the ocean.
Where the origin of point-source pollution can be more easily identified, measured
and rectified, this is more difficult in the case of non point-source pollution.
Non point-source pollution is cumulative and difficult to control. However, every type
of pollution has a source, and our actions can make a difference to total pollution.
Sources of pollution include:
• Agricultural run-off
• Urban outflow and air pollution
• Industrial outflow and air pollution
• Transport
48
Image: sources of pollution from http://www.mfe.govt.nz/environmental-reporting/freshwater/river/nutrients/sources.html
49. Air Pollution
Primary Air Pollutants Sources: Natural and Anthropogenic
Particulates Fine particles, such as in sea spray and volcanoes. Smoke and
carbon particles from combustion, aerosols, dust.
Ozone Fossil fuel combustion increases ground-level ozone.
Nitrogen dioxide Brown haze as a result of high-temperature combustion or
lightning strikes.
Carbon monoxide Incomplete combustion, vehicle exhaust. Highly toxic.
Sulphur dioxide Volcanoes and industrial combustion. Form acid rain.
Up to 90% of urban air pollution is from vehicle exhausts. The human health impacts can
be catastrophic, from asthma, emphysema and heart disease to cancers.
Five main pollutants on five continents found to
increase risk of heart attacks. Find out more here:
http://www.environmentalhealthnews.org/ehs/news/
hearts-and-air-pollution/hearts-and-air-pollution
Image: 'Beijing smog' 49
http://www.flickr.com/photos/12836528@N00/386198516
50. Smoke + Fog = Smog
Image: 'The city of Los Angeles' 50
http://www.flickr.com/photos/11334344@N00/431927416
51. Smoke + Fog = Smog
Normally, air temperature decreases as altitude
increases. However in calm, dry air inversion
can occur. Low mixing of air and cool surface
temperatures result in a trapped layer of heat
above the surface.
This in turn traps smog and pollutants.
These pollutants can be photochemically
reactive – they react with UV from the Sun to
from photochemical smog, containing ozone
and other harmful pollutants.
Smog is a particular problem in cities with high
From:
vehicle use and industry. http://www.wrh.noaa.gov/slc/climate/TemperatureI
nversions.php
Image: 'The city of Los Angeles' 51
http://www.flickr.com/photos/11334344@N00/431927416
52. Remember:
Ozone in the stratosphere is good,
it reduces levels of UV radiation
reaching the Earth by about 93%
But:
Ground-level ozone, produced
from nitric oxide, is very harmful to
human health.
http://www.knowabouthealth.com/smog-can-trigger-heart-diseases/4402/
53. So UV radiation does a lot of damage…
It causes mutations and damages biological molecules.
It damages photosynthetic organisms, reducing productivity.
It damages human health through tumours, eye damage, immune suppression.
But it is also the high-energy radiation which splits apart molecules:
2O3 UV energy
3O2 But UV also splits CFC’s, releasing
chlorine, catalysing ozone
slowly reforms breakdown, resulting in holes.
Stratospheric ozone is split by UV, absorbing
most of the UV energy and protecting Earth.
And UV splits NO, releasing free
oxygen atoms which form ground-
level ozone, which is very harmful
to human health.
53
54. Acid Precipitation SO2 and NOx react with water to
form acid precipitation.
Acid precipitation is harmful to biological
systems (changing pH of soil and water),
as well as rock formations and buildings.
Often pollutants from one country are
carried in air currents, forming acid
precipitation in another country.
54
From: http://en.wikipedia.org/wiki/Acid_rain
55. Acid Precipitation SO2 and NOx react with water to
form acid precipitation.
Acid precipitation is harmful to
biological systems (changing pH of
soil and water), as well as rock
formations and buildings.
The ability of plants to take up water
is compromised and leaves and pine
needles are damaged.
Image: 'Dead forest acid rain; Czech Republic'
http://www.flickr.com/photos/39561704@N03/4288635612
Acidic waters absorb aluminium, concentrating
toxins. Species not tolerant to pollution will not
survive.
Acid Rain diagram from: http://goo.gl/kxueT 55
56. Acid Precipitation SO2 and NOx react with water to
form acid precipitation.
Through international cooperation, we can use lower-sulphur fuels, reduce emissions
through industry and take action to set laws and regulations on emissions from
smoke stacks and car exhausts.
Actions against acid precipitation:
• Lead-free petrol
• Shifting to renewable energy, not fossil fuels
• Lower-temperature burners and filters in factories (expensive)
• Increasing energy efficiency
Ocean Acidification: the other CO2 problem
• CO2 dissolves in water to form carbonic acid.
• Small changes in pH affect enzymes of sensitive living organisms
• This includes coral polyps, who produce reefs
• Coral bleaching is the result of mass polyp death
56
57. NO SO2 CO
O3 UV CO2
NO2
What is the importance of these
CFC components or concepts?
How are they connected?
CH4
57
59. There’s not really very
much water on Earth…
… and we can’t use most of it. http://ga.water.usgs.gov/edu/earthwherewater.html
60. Surface water
is visible and immediately available. It
includes rivers, lakes and oceans.
Ground water
includes underground stores, such as
aquifers and water stored in soil. Water
from wells is ground water.
Image: 'water is life' 60
http://www.flickr.com/photos/58117789@N00/281123380
61. Types of water Pollution
Oxygen-depleting
Detritivores and saprotrophs biodegrade organic matter. If too much organic matter is in the
water, their populations boom and use up oxygen. This leaves an opportunity for potentially
harmful anaerobic species to thrive, producing toxins as waste from their metabolism.
Nutrients
Organic and inorganic sources from agriculture and waste water can be toxic to animals and
encourage growth of algae, leading to oxygen depletion and eutrophication.
Microbiological
Pathogenic microorganisms such as bacteria, viruses and protozoa (parasites), can be
released into water. Cholera is an example of a water-borne pathogen, which is evolving to
become antibiotic resistant in the water systems of some slum areas.
Chemical
These are chemicals which are toxic to life in and around the water. This includes oil from
spills and industrial waste, heavy metals and pesticides. These are prone to
biomagnification through the trophic levels.
Suspended Matter
Larger particles are suspended in water, forming silt and sludge or choking marine life. This
includes plastic trash which is broken up by the waves.
61
62. Types of water Pollution
Chemical
These are chemicals which are toxic to life in and around the water. This includes oil from
spills and industrial waste, heavy metals and pesticides. These are prone to
biomagnification through the trophic levels.
Image: 'Deepwater Horizon Fire - April 22, 2010' 62
http://www.flickr.com/photos/47684393@N00/4543311558
63. Types of water Pollution
Microbiological
Pathogenic microorganisms such as
bacteria, viruses and protozoa
(parasites), can be released into water.
Cholera is an example of a water-borne
pathogen, which is evolving to become
antibiotic resistant in the water systems
of some slum areas.
Read more here:
http://www.guardian.co.uk/world/201
1/apr/07/superbug-gene-rife-delhi-
water
Woman washing in West Bengal, from 63
http://www.flickr.com/photos/ilri/4573808909/in/photostream/
64. Types of water Pollution
Nutrients
Organic and inorganic sources from
agriculture and waste water can be
toxic to animals and encourage
growth of algae, leading to oxygen
depletion and eutrophication.
Oxygen-depleting
Detritivores and saprotrophs
biodegrade organic matter. If too
much organic matter is in the water,
their populations boom and use up
oxygen. This leaves an opportunity for
potentially harmful anaerobic species
to thrive, producing toxins as waste
from their metabolism.
64
Image from: http://en.wikipedia.org/wiki/Eutrophication
65. Types of water Pollution
Nutrients
Organic and inorganic sources from
agriculture and waste water can be
toxic to animals and encourage
growth of algae, leading to oxygen
depletion and eutrophication.
Oxygen-depleting
Detritivores and saprotrophs
NASA Discovers Ocean dead zones:
biodegrade organic matter. If too
much organic matter is in the water,
their populations boom and use up
oxygen. This leaves an opportunity for
potentially harmful anaerobic species
to thrive, producing toxins as waste
from their metabolism.
65
Image from: http://en.wikipedia.org/wiki/Eutrophication http://www.youtube.com/watch?v=XEZpo9uLIc0
66. Types of water Pollution
Suspended Matter
Larger particles are suspended in water, forming silt
and sludge or choking marine life. This includes
plastic trash which is broken up by the waves.
“Only humans produce waste
which nature can’t biodegrade.”
http://www.ted.com/talks/capt_charles_moore_on_the_seas_
of_plastic.html
Image: Pacific trash shame
http://gu.com/p/2cxbm 66
67. Sources of Ocean Pollution
Oil spills
Debris and trash
Chemical waste
Agricultural waste
Image: 'Plastic Ocean' 67
http://www.flickr.com/photos/48889057888@N01/4408273247
68. Issues of Water Pollution
Group 1
Explain why ground water pollution is difficult to clean up
Group 2
Explain the effects of pollution on an ecosystem
“Explain: Give a detailed account
Your work is for the others in the class: including reasons or causes.”
• Create a GoogleDoc or presentation
• Share with group members and teacher This might include:
• Publish to other class members • Draw and annotate diagrams
• Outline processes
• List or describe components
68
69. Review: Analyse this graph
What do the axes represent?
What trends and patterns do
you notice?
Explain the reasoning for the
trends and patterns based on
what we have learned in class
this unit.
Taken from:
http://en.wikipedia.org/wiki/Temperature_recor
70. Review: Analyse this graph
What do the axes represent?
What trends and patterns do
you notice?
Explain the reasoning for the
trends and patterns based on
what we have learned in class
this unit.
Taken from:
http://www.environment.gov.au/soe/2006/publications/
71. Review: Analyse these graphs
What do the axes represent?
What trends and patterns do you
notice?
Explain the reasoning for the trends
and patterns based on what we have
learned in class this unit.
Taken from: http://www.epa.gov/airtrends/ozone.html
72. Review: Analyse these graphs
• What trends and patterns do you notice?
• Explain the reasoning for the trends and patterns based on what we have learned in class
this unit.
Taken from: http://www.epa.gov/airtrends/aqtrends.html
73. Review: Analyse these graphs
• What trends and patterns do you notice?
• Explain the reasoning for the trends and patterns based on what we have learned in class
this unit.
Taken from: http://www.na.fs.fed.us/spfo/pubs/n_resource/buffer/part3.htm
74. Review: Analyse this graph
Primary diagnoses mean the patient was admitted knowing it was for asthma.
All diagnoses is when asthma has been diagnosed with asthma as a possible Taken from:
cause. http://www.hesonline.org.uk/Ease/ContentServer?siteID
75. What do you think?
Ideas based on
Concept Cartoons:
http://www.conceptcartoons.com
Clipart people from: http://www.clker.com/search/krug/1
76. For more resources.
Please consider a donation to charity via Biology4Good.
Click here for more information about Biology4Good charity donations.
This is a Creative Commons presentation. It may be linked and embedded but not sold or re-hosted.