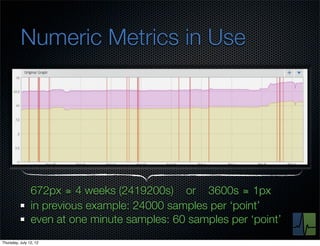
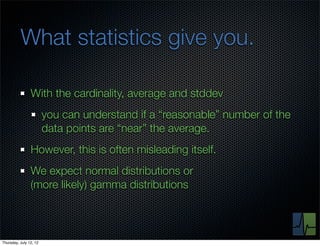
The document discusses monitoring and measuring systems by observing behaviors and metrics over time. It notes that every observation distills down to two elements - the circumstances or context being measured, and the value or result. Context includes dimensions like what is being measured, location, time, etc. Values can be numeric metrics or text outcomes. The document advocates for capturing both passive data reflecting real events as well as active tests to better understand system performance in low traffic environments. It also stresses that averaging or sampling can hide variability, so capturing additional statistical details beyond just the average value provides more useful insights.
In this session we’ll leave the need for performance a foregone conclusion and take a whirlwind tour through the complexity of modern Internet architectures. The complexities lead to evil optimization problems and significant challenges troubleshooting production issues to a speedy and successful end.
Starting with the simple facts that you can’t fix what you can’t see and you can’t improve what you can’t measure, we’ll discuss what needs monitoring and why. We’ll talk about unlikely allies in the fight for time and budget to instrument systems, applications and processes for observability.
You’ll leave the session with a better understanding of what it looks like to troubleshoot the storm of a malfunctioning large architecture and some tools and techniques you can use to not be swallowed by the Kraken.
User generated data is an old problem. Systems and network telemetry, page analytics and application state combine to form an ever growing mountain of data collected by today's tools. Collecting and storing this data requires more than just a single application, having no single point where the user touches the system and gets an answer makes debugging a nightmare and reproducing the error intractable. Distributed systems require a clear perspective on production systems and access to data in real time to have any hope of solving complex problems related to state, all while not impacting user experience.
We will explain the problem, the pains and how we solved them. Develop in production; push code to development.
Velocity EU 2012 Escalating Scenarios: Outage Handling PitfallsJohn Allspaw
When things go wrong, our judgement is clouded at best, blinded at worst.
In order to successfully navigate a large-scale outage, being aware of potentials gaps in knowledge and context can help make for a better outcome. The Human Factors and Systems Safety community have been studying how people situate themselves, coordinate amongst a team, use tooling, make decisions, and keep their cool under sometimes very stressful and escalating scenarios. We can learn from this research in order to adopt a more mature stance when the s*#t hits the fan.
We’re going to look closely at how people behave under these circumstances using real-world examples and scan what we can learn from High Reliability Organizations(HROs) and fields such as aviation, military, and trauma-driven healthcare.
Building Rich User Experiences w/o JavaScript SpaghettiJared Faris
Most Javascript is written to glue code and UI together without any thought to design patterns. Over time this leads to piles of Javascript that look nothing like code you’d be proud of writing. In this talk we’ll look at the rise of software libraries (like Knockout) that can help add structure to your JS. We’ll talk about when they help your project, and when they get in the way. We’ll also look into how you can easily use the Mediator pattern in JavaScript to really clean up your code with or without other libraries.
Building Rich User Experiences Without JavaScript SpaghettiJared Faris
Given at MADExpo 2012
Most Javascript is written to glue code and UI together without any thought to design patterns. Over time this leads to piles of Javascript that look nothing like code you’d be proud of writing. In this talk we’ll look at the rise of software libraries (like Knockout) that can help add structure to your JS. We’ll talk about when they help your project, and when they get in the way. We’ll also look into how you can easily use the Mediator and Observer patterns in JavaScript to really clean up your code with or without other libraries. As an added bonus we’ll talk about using Message Buses to really decouple your JavaScript controls. I’ll explain how we’re using these patterns at Facio and how you can implement them in your code. At the end we'll look at some code samples and we'll talk about whatever other patterns you might be interested in doing in JavaScript.
One of the dying skill sets in today’s engineering teams is the multi-disciplinary analyst that can truly dissect dysfunction in the radically complex architectures of today. As tools emerge that connect the dots, it might be faster to collect the data needed to analysis and decision making, but the knowledge and techniques to actually make the assessments needed are hard to come by.
In this session, we’ll walk through a complex architecture and discuss what an engineer in this role really needs to understand. We’ll analyze a few anecdotal problems and see why this world of magical automation and elastic deployments will never really displace the need for root on a production box, a debugger, and the ability to move fast, take risks and destroy performance problems.
Craftsmanship in software tends to erode as team sizes increase. This can be due to a large variety of reasons, but is often dependent on code base size, team size, and autonomy. In this session I'll talk about some of the challenges companies face as these things change and how to manipulate teams, architectures and how people work to maintain software craftsmanship will still delivering product.
Technology changes and process changes in how people build and manage Internet systems have driven a need for a new approach to monitoring. We talk about why, what and how.
There are two common tenets of operations: "hell is other people's software," and "better software is produced by those forced to operate it." In this session I'll take a fly-by-tour of two pieces of software that were built from the ground up for operability from the hard-earned teachings of their inoperable predecessors: a distributed datastore replacing PostgreSQL, and a message queue replacing RabbitMQ.
We'll discuss specific design aspects that increase resiliency in the event of failure and observability at all times.
The word exponential is one of the most used and least understood words in the lexicon of political and managerial speak, and yet it is fundamental to the way our world is being driven by technology in an unprecedented way. It also heralds a move away from our slow, stable and predictable industrial past, to a new era of speed, non-linearity, and greater uncertainty.
It is not by accident that our working and leisure activities seem to be accelerating – everything is now mobile, intelligent, connected and communicating whilst changing at an accelerating rate. If we are to cope, if we are to win in this new environment, we have to think and act differently. The old tools and methods will not only fail, they will pose a significant and growing threat.
Here we identify and consider the big game changers, look at failure mechanisms, and identify changes to come including some aspects of growing complexity. We also point out some of the basic management errors and the need to innovate in new ways that allow organisations to quickly learn and adapt on the hoof. This includes business modelling, war gaming, and celebrating failure!
Inside the Atlassian OnDemand Private CloudAtlassian
In order to launch Atlassian OnDemand, we needed to rethink the way we did infrastructure. Join Atlassian SaaS Platform Architect, George Barnett as he discusses how we delivered a scalable platform that runs tens of thousands of JVMs, all while reducing the cost by ten-fold. This talk will cover design decisions, technology choices and the lessons learned during the build out.
The next phase of Smart Network Convergence could be putting Deep Learning systems on the Internet. Deep Learning and Blockchain Technology might be combined in the smart networks of the future for automated identification (deep learning) and automated transaction (blockchain). Large scale future-class problems might be addressed with Blockchain Deep Learning nets as an advanced computational infrastructure, challenges such as million-member genome banks, energy storage markets, global financial risk assessment, real-time voting, and asteroid mining.
Blockchain Deep Learning nets and Smart Networks more generally are computing networks with intelligence built in such that identification and transfer is performed by the network itself through sophisticated protocols that automatically identify (deep learning), and validate, confirm, and route transactions (blockchain) within the network.
Artificial intelligence in the post-deep learning eraDeakin University
Deep learning has recently reached the heights that pioneers in the field had aspired to, serving as the driving force behind recent breakthroughs in AI, which have arguably surpassed the Turing test. At present, the spotlight is on scaling Transformers and diffusion models on Internet-scale data. In this talk, I will provide an overview of the fundamental principles of deep learning, its powers, and limitations, and explore the new era of post-deep learning. This new era encompasses novel objectives, dynamic architectures, abstract reasoning, neurosymbolic hybrid systems, and LLM-based agent systems.
Developing a Globally Distributed Purging SystemFastly
(Surge 2014) How do you build a distributed cache invalidation system that can invalidate content in 150 milliseconds across a global network of servers? Fastly CTO Tyler McMullen and engineer Bruce Spang will discuss the process of constructing a production-ready distributed system built on solid theoretical foundations. This talk will cover using research to design systems, the bimodal multicast algorithm, and the behavior of this system in production.
Cloud Computing could be the biggest single opportunity for a significant improvement in our network and information security for decades. Multiple operators and suppliers offering multiple access points, services and applications that we can tap at the same time will give us a diversity of new protection mechanisms way beyond those we enjoy today.
For sure we need to improve our log-on processes, firewalls and malware protection, but thin clients change the name of the game. A lack of memory and processing power leverage down any malware sophistication, whilst access and utilisation will be harder to compromise when we choose different devices and servers at random. If we also sign up for applications and services from multiple players, and disperse our information in parsed and scattered locations that are never connected in the same manner more than once, then infiltration will be orders of magnitude more difficult.
All clouds are not the same, and their will be large numbers of them spanning corporates, governments, social and personal applications. Some will last, others will be sporadic and last for seconds. Connections too will be continually varying and sporadic. A moving target is harder to hit, and The Cloud might be the ultimate target!
This presentation talks about three topics related to monitoring. The first is a brief history and future forecast of monitoring trends. The second is a second look at the inputs, outputs, and techniques for setting SLOs. The third sets some basic tenets one should always follow when monitoring systems.
A tour of challenges today's software engineers will fast (and material they should familiarize themselves with) to cope with the issues that arise due to the distributed nature of today's applications.
There are many modern techniques for identifying anomalies in datasets. There are fewer that work as online algorithms suitable for application to real-time streaming data. What’s worse? Most of these methodologies require a deep understanding of the data itself. In this talk, we tour what the options are for identifying anomalies in real-time data and discuss how much we really need to know before hand to guess at the ever-useful question: is this normal?
What you should think about putting in webops dashboards. There's a lot of discussion that isn't annotated in the slide stack -- so you're missing a lot without audio.
UiPath Test Automation using UiPath Test Suite series, part 4DianaGray10
Welcome to UiPath Test Automation using UiPath Test Suite series part 4. In this session, we will cover Test Manager overview along with SAP heatmap.
The UiPath Test Manager overview with SAP heatmap webinar offers a concise yet comprehensive exploration of the role of a Test Manager within SAP environments, coupled with the utilization of heatmaps for effective testing strategies.
Participants will gain insights into the responsibilities, challenges, and best practices associated with test management in SAP projects. Additionally, the webinar delves into the significance of heatmaps as a visual aid for identifying testing priorities, areas of risk, and resource allocation within SAP landscapes. Through this session, attendees can expect to enhance their understanding of test management principles while learning practical approaches to optimize testing processes in SAP environments using heatmap visualization techniques
What will you get from this session?
1. Insights into SAP testing best practices
2. Heatmap utilization for testing
3. Optimization of testing processes
4. Demo
Topics covered:
Execution from the test manager
Orchestrator execution result
Defect reporting
SAP heatmap example with demo
Speaker:
Deepak Rai, Automation Practice Lead, Boundaryless Group and UiPath MVP
Key Trends Shaping the Future of Infrastructure.pdfCheryl Hung
Keynote at DIGIT West Expo, Glasgow on 29 May 2024.
Cheryl Hung, ochery.com
Sr Director, Infrastructure Ecosystem, Arm.
The key trends across hardware, cloud and open-source; exploring how these areas are likely to mature and develop over the short and long-term, and then considering how organisations can position themselves to adapt and thrive.
Smart TV Buyer Insights Survey 2024 by 91mobiles.pdf91mobiles
91mobiles recently conducted a Smart TV Buyer Insights Survey in which we asked over 3,000 respondents about the TV they own, aspects they look at on a new TV, and their TV buying preferences.
JMeter webinar - integration with InfluxDB and GrafanaRTTS
Watch this recorded webinar about real-time monitoring of application performance. See how to integrate Apache JMeter, the open-source leader in performance testing, with InfluxDB, the open-source time-series database, and Grafana, the open-source analytics and visualization application.
In this webinar, we will review the benefits of leveraging InfluxDB and Grafana when executing load tests and demonstrate how these tools are used to visualize performance metrics.
Length: 30 minutes
Session Overview
-------------------------------------------
During this webinar, we will cover the following topics while demonstrating the integrations of JMeter, InfluxDB and Grafana:
- What out-of-the-box solutions are available for real-time monitoring JMeter tests?
- What are the benefits of integrating InfluxDB and Grafana into the load testing stack?
- Which features are provided by Grafana?
- Demonstration of InfluxDB and Grafana using a practice web application
To view the webinar recording, go to:
https://www.rttsweb.com/jmeter-integration-webinar
Securing your Kubernetes cluster_ a step-by-step guide to success !KatiaHIMEUR1
Today, after several years of existence, an extremely active community and an ultra-dynamic ecosystem, Kubernetes has established itself as the de facto standard in container orchestration. Thanks to a wide range of managed services, it has never been so easy to set up a ready-to-use Kubernetes cluster.
However, this ease of use means that the subject of security in Kubernetes is often left for later, or even neglected. This exposes companies to significant risks.
In this talk, I'll show you step-by-step how to secure your Kubernetes cluster for greater peace of mind and reliability.
UiPath Test Automation using UiPath Test Suite series, part 3DianaGray10
Welcome to UiPath Test Automation using UiPath Test Suite series part 3. In this session, we will cover desktop automation along with UI automation.
Topics covered:
UI automation Introduction,
UI automation Sample
Desktop automation flow
Pradeep Chinnala, Senior Consultant Automation Developer @WonderBotz and UiPath MVP
Deepak Rai, Automation Practice Lead, Boundaryless Group and UiPath MVP
DevOps and Testing slides at DASA ConnectKari Kakkonen
My and Rik Marselis slides at 30.5.2024 DASA Connect conference. We discuss about what is testing, then what is agile testing and finally what is Testing in DevOps. Finally we had lovely workshop with the participants trying to find out different ways to think about quality and testing in different parts of the DevOps infinity loop.
GraphRAG is All You need? LLM & Knowledge GraphGuy Korland
Guy Korland, CEO and Co-founder of FalkorDB, will review two articles on the integration of language models with knowledge graphs.
1. Unifying Large Language Models and Knowledge Graphs: A Roadmap.
https://arxiv.org/abs/2306.08302
2. Microsoft Research's GraphRAG paper and a review paper on various uses of knowledge graphs:
https://www.microsoft.com/en-us/research/blog/graphrag-unlocking-llm-discovery-on-narrative-private-data/
Epistemic Interaction - tuning interfaces to provide information for AI supportAlan Dix
Paper presented at SYNERGY workshop at AVI 2024, Genoa, Italy. 3rd June 2024
https://alandix.com/academic/papers/synergy2024-epistemic/
As machine learning integrates deeper into human-computer interactions, the concept of epistemic interaction emerges, aiming to refine these interactions to enhance system adaptability. This approach encourages minor, intentional adjustments in user behaviour to enrich the data available for system learning. This paper introduces epistemic interaction within the context of human-system communication, illustrating how deliberate interaction design can improve system understanding and adaptation. Through concrete examples, we demonstrate the potential of epistemic interaction to significantly advance human-computer interaction by leveraging intuitive human communication strategies to inform system design and functionality, offering a novel pathway for enriching user-system engagements.
Generating a custom Ruby SDK for your web service or Rails API using Smithyg2nightmarescribd
Have you ever wanted a Ruby client API to communicate with your web service? Smithy is a protocol-agnostic language for defining services and SDKs. Smithy Ruby is an implementation of Smithy that generates a Ruby SDK using a Smithy model. In this talk, we will explore Smithy and Smithy Ruby to learn how to generate custom feature-rich SDKs that can communicate with any web service, such as a Rails JSON API.
GDG Cloud Southlake #33: Boule & Rebala: Effective AppSec in SDLC using Deplo...James Anderson
Effective Application Security in Software Delivery lifecycle using Deployment Firewall and DBOM
The modern software delivery process (or the CI/CD process) includes many tools, distributed teams, open-source code, and cloud platforms. Constant focus on speed to release software to market, along with the traditional slow and manual security checks has caused gaps in continuous security as an important piece in the software supply chain. Today organizations feel more susceptible to external and internal cyber threats due to the vast attack surface in their applications supply chain and the lack of end-to-end governance and risk management.
The software team must secure its software delivery process to avoid vulnerability and security breaches. This needs to be achieved with existing tool chains and without extensive rework of the delivery processes. This talk will present strategies and techniques for providing visibility into the true risk of the existing vulnerabilities, preventing the introduction of security issues in the software, resolving vulnerabilities in production environments quickly, and capturing the deployment bill of materials (DBOM).
Speakers:
Bob Boule
Robert Boule is a technology enthusiast with PASSION for technology and making things work along with a knack for helping others understand how things work. He comes with around 20 years of solution engineering experience in application security, software continuous delivery, and SaaS platforms. He is known for his dynamic presentations in CI/CD and application security integrated in software delivery lifecycle.
Gopinath Rebala
Gopinath Rebala is the CTO of OpsMx, where he has overall responsibility for the machine learning and data processing architectures for Secure Software Delivery. Gopi also has a strong connection with our customers, leading design and architecture for strategic implementations. Gopi is a frequent speaker and well-known leader in continuous delivery and integrating security into software delivery.
Builder.ai Founder Sachin Dev Duggal's Strategic Approach to Create an Innova...Ramesh Iyer
In today's fast-changing business world, Companies that adapt and embrace new ideas often need help to keep up with the competition. However, fostering a culture of innovation takes much work. It takes vision, leadership and willingness to take risks in the right proportion. Sachin Dev Duggal, co-founder of Builder.ai, has perfected the art of this balance, creating a company culture where creativity and growth are nurtured at each stage.
Monitoring Java Application Security with JDK Tools and JFR Events
Atldevops
1. What’s in a Number?
monitoring and measuring;
the spiritual and the carnal.
Thursday, July 12, 12
2. Theo Schlossnagle @postwait
Entrepreneur: OmniTI, Message Systems, Circonus
Author: Scalable Internet Architectures, Web Operations
Speaker: over 50 speaking engagements around the world
Engineer: Senior ACM Member, IEEE Member, ACM Queue
Open Source:
Apache Traffic Server, Varnish, Node.js, node-iptrie, node-amqp,
Solaris HTTP accept filers, OpenSSH + SecurID, JLog, Mungo,
Portable umem, Reconnoiter, mod_log_spread/spreadlogd, Spread,
Wackamole, Zetaback, concurrencykit, Net::RabbitMQ, MCrypt,
node-gmp, node-compress, and others.
Thursday, July 12, 12
3. b le ”
Theo Schlossnagle c
s i@postwait
“i ra
Entrepreneur: OmniTI, Message Systems, Circonus
Author: Scalable Internet Architectures, Web Operations
Speaker: over 50 speaking engagements around the world
Engineer: Senior ACM Member, IEEE Member, ACM Queue
Open Source:
Apache Traffic Server, Varnish, Node.js, node-iptrie, node-amqp,
Solaris HTTP accept filers, OpenSSH + SecurID, JLog, Mungo,
Portable umem, Reconnoiter, mod_log_spread/spreadlogd, Spread,
Wackamole, Zetaback, concurrencykit, Net::RabbitMQ, MCrypt,
node-gmp, node-compress, and others.
Thursday, July 12, 12
4. Monitoring ~ Voyeurism
Watching from the outside in.
Observing systems and their behaviors.
Ultimately, a single observation distills into two things:
a set of circumstances
a value
Thursday, July 12, 12
5. Circumstances: Dimensions
What are you looking at?
outbound octets on
an Ethernet port (1/37) on a switch
in rack 12, in datacenter 6
for client ACME
What time is it?
Thursday, July 12, 12
6. Circumstances: Dimensions
What are you looking at?
length of time until DOM ready for
a user loading a web page (/store/foo/item/bar)
using Chrome 10
from Verizon FioS in Fulton, Maryland.
What time is it?
Thursday, July 12, 12
7. Value
Ultimately, there are two types of values we care about:
text
an version number, http code, ssh fingerprint
numeric
0.0000000000093123,
18446744064986053382,
1.1283e97, 6.33e-23,
0, -1, 1000, 42
Thursday, July 12, 12
8. Text Data
Incredibly useful,
because the “when” can be correlated
with other events and conditions.
Idea:
if the distinct set of text values is sufficiently small,
consider the text value as a dimension, and
the new value = 1
Thursday, July 12, 12
9. Text Metrics in Use
Code deployments vs. process activity
Thursday, July 12, 12
10. Numeric Data
There tends to be a lot of it.
Example web hits:
one box, one metric, 1 billion / month.
that’s only 400 events/second.
each event has about 20 dimensions.
Thursday, July 12, 12
11. Numeric Metrics in Use
672px ≅ 4 weeks (2419200s) or 3600s ≅ 1px
Thursday, July 12, 12
12. Numeric Metrics in Use
672px ≅ 4 weeks (2419200s) or 3600s ≅ 1px
in previous example: 24000 samples per ‘point’
Thursday, July 12, 12
13. Numeric Metrics in Use
672px ≅ 4 weeks (2419200s) or 3600s ≅ 1px
in previous example: 24000 samples per ‘point’
even at one minute samples: 60 samples per ‘point’
Thursday, July 12, 12
14. An Event
each is a singularity:
individual;
unrepeatable;
unique.
mondolithic.com
Thursday, July 12, 12
15. Passive vs. Active
Active is a synthesized event.
You perform some action an measure it.
Passive is the collection of other events.
Stuff that really happened.
Ask yourself which is better.
Thursday, July 12, 12
16. Conceding the Truth
Passive events are ideal in high traffic environments.
Active events are necessary in low traffic environments.
“high and low” are relative, so...
you need both
always
Thursday, July 12, 12
17. Numbers: how they work.
Think of a car’s speedometer.
it shows you how fast you are going (sorta)
at the moment you read it (almost)
the only reason this is acceptable is:
you have a rudimentary understanding of physics,
you are in the car, and
your body is exceptionally good
at detecting acceleration.
Thursday, July 12, 12
18. Computers are different.
computers are fast: billions of instructions per second.
you aren’t inside the computer.
most “users” somehow forget rudimentary physics.
interfaces and visual representations mislead you.
a speedometer (or familiar readout) leads you to
a false confidence in system stability between samples.
Thursday, July 12, 12
19. Write IOPS
Simple, relatively stable, easy to trend...
and wrong.
Thursday, July 12, 12
20. Zooming in shows insight.
It is not as smooth as we thought.
Good to know.
Thursday, July 12, 12
21. Dishonesty Revealed.
This is “inside” a 5 minute sample.
Note: we’re still sampling; now at 0.5 Hz.
Thursday, July 12, 12
22. You’ve Been Deceived.
1. Denial and Isolation
2. Anger
3. Bargaining
4. Depression
5. Acceptance
Thursday, July 12, 12
23. You’ve Been Deceived.
let’s just skip this one, okay?
1. Denial and Isolation
2. Anger
3. Bargaining
4. Depression
5. Acceptance
Thursday, July 12, 12
24. You’ve Been Deceived.
let’s just skip this one, okay?
1. Denial and Isolation
If you’re not angry, get angry:
2. Anger it’s the next step in healing
3. Bargaining
4. Depression
5. Acceptance
Thursday, July 12, 12
25. You’ve Been Deceived.
let’s just skip this one, okay?
1. Denial and Isolation
If you’re not angry, get angry:
2. Anger it’s the next step in healing
3. Bargaining
This is where it gets interesting.
4. Depression
5. Acceptance
Thursday, July 12, 12
26. Bargaining.
I can’t reasonably store all the data:
likely true.
Since I can’t store all the data,
I have to store a summarization
yes; they’re called “aggregates.”
Thursday, July 12, 12
27. Bargaining: you’re losing.
You are sampling things and losing data.
the speedometer example.
or
You are taking an average of a large set of samples.
Thursday, July 12, 12
28. “Average” is a bad bargain.
The average of a set of numbers is:
the single most useful statistic
By itself, it provides very little insight into
the nature of the original set.
Hello statistics!
Thursday, July 12, 12
29. Rounding out your statistics.
You should store, in order of importance:
average derivatives
cardinality
standard deviation derivative stddev
covariance derivative covariance
min, max derivative min, max
Thursday, July 12, 12
30. Rounding out your statistics.
You should store, in order of importance:
average derivatives
cardinality
standard deviation derivative stddev
covariance derivative covariance
min, max derivative min, max
FWIW: we don’t store these at Circonus (today)
Thursday, July 12, 12
31. What statistics give you.
With the cardinality, average and stddev
you can understand if a “reasonable” number of the
data points are “near” the average.
However, this is often misleading itself.
We expect normal distributions or
(more likely) gamma distributions
Thursday, July 12, 12
32. So, we can make due.
No.
Let’s revisit the five stages of grieving.
Thursday, July 12, 12
33. You’ve Been Deceived.
let’s just skip this one, okay?
1. Denial and Isolation
If you’re not angry, get angry:
2. Anger it’s the next step in healing
3. Bargaining
This is where it gets interesting.
4. Depression
5. Acceptance
Thursday, July 12, 12
34. You’ve Been Deceived.
let’s just skip this one, okay?
1. Denial and Isolation
If you’re not angry, get angry:
2. Anger it’s the next step in healing
3. Bargaining
This is where it gets interesting.
4. Depression
5. Acceptance Here we are.
Thursday, July 12, 12
41. Do we need more?
Wait. Stop.
In some systems we know enough.
We know their distributions,
... the leather seat, the inertia of the vessel.
A sample here and there, an average, etc.
Good enough: temperature, load, payments, bugs.
Not enough: disk IOPS, memory use, CPU time.
Thursday, July 12, 12
42. We do need more.
we have a lot of data sources from which
we typically compose an average of many values, and
understanding the distribution is extremely valuable.
Thursday, July 12, 12
43. Histograms: the need.
Given an average of 4, and a cardinality of 1000
maybe you had 1000 samples of exactly 4?
Dunno.
If you have a stddev of 1,
about 68.2% of your
data points will be
between 3 and 5.
This will never be as detailed as a
histogram of the full dataset.
Thursday, July 12, 12
44. Histograms: the want
Ideally, we’d want histograms
bucketed as we see fit
with all data represented.
Too much data: this isn’t tractable.
So, how do we bucket?
Thursday, July 12, 12
45. Bucketing Basics
If I had numbers bounded by a small space:
between 0ms and 10ms
I could bucket [0-1),[1-2),...[9,10).
eleven buckets, fairly manageable.
What do I do when I get 20? or 200? or 20000?
What do I do when I get lots of data
between 0.001 and 1?
Thursday, July 12, 12
46. How we do more.
We make an assumption (yes: ass: u & mption)
We assume the same thing floating point assumes:
The difference between “very large” numbers and the
difference between “very small” numbers can have
accuracy inversely proportional to their magnitude.
We take this and build histograms.
Thursday, July 12, 12
47. Solution: log buckets
[0.001,0.01), [2-10,2-9),[2-9,2-8),[2-8,2-7),
[0.01,0.1), [2-7,2-6),[2-6,2-5),[2-5,2-4),
[0.1,1), [2-4,2-3),[2-3,2-2),[2-2,2-1),
[1,10), [2-1,1),[1,2), [2,4), [4,8),
[10,100), [8,16),[16,32),[32,64),
[100,1000), [64,128),[27,28),[29,210),
[1000,10000), [210,211),[211,212),[212,213),
[10000,100000) [213,214),[214,215)
Engineers might like these,
but humans do not.
Thursday, July 12, 12
49. Where are we now?
For some data, we store simple statistical aggregations
Other bits of data we use log-linear histograms
quite insightful, while
still small enough to store
A single “five minute average” can look more like this:
Thursday, July 12, 12
50. Histograms 101
This.
This is a histogram.
It shows the frequency of
values within a population.
Height represents frequency
Thursday, July 12, 12
51. Histograms 101
This.
This is a histogram.
It shows the frequency of
values within a population.
Now, height and color
represents frequency
Thursday, July 12, 12
52. Histograms 101
This.
This is a histogram.
It shows the frequency of
values within a population.
Now, only color
represents frequency
Thursday, July 12, 12
53. Histograms 101
This.
This is a histogram.
It shows the frequency of
values within a population.
Now, only color
represents frequency
Thursday, July 12, 12
54. Histograms ➠ time series
This.
This is a histogram.
It shows the frequency of
values within a population.
Now, only color
represents frequency
Thursday, July 12, 12
55. Histograms ➠ time series
This.
This is a histogram.
It shows the frequency of
values within a population.
Now, only color
represents frequency
Thursday, July 12, 12
56. Histograms ➠ time series
This.
This is a histogram.
It shows the frequency of
values within a population.
Now, only color
represents frequency
at a single time interval
Thursday, July 12, 12
58. You’ve Been Deceived.
let’s just skip this one, okay?
1. Denial and Isolation
If you’re not angry, get angry:
2. Anger it’s the next step in healing
3. Bargaining
This is where it gets interesting.
4. Depression
5. Acceptance We are still here...
at least in the open source world.
Thursday, July 12, 12
59. Reconnoiter
Reconnoiter:
https://labs.omniti.com/labs/reconnoiter
https://github.com/omniti-labs/reconnoiter
Open source (BSD)
Thursday, July 12, 12
60. Reconnoiter: backend
C (as God intended),
with lua bindings to ease plugin development
Java (external) bridge for making things like JMX easier
Esper (Java) for streaming queries (fault detection)
AMQP and REST for component intercommunication
PostgreSQL backing store
Very actively developed
Thursday, July 12, 12
61. Reconnoiter: frontend
HTML + CSS
Javascript: JQuery, flot
PHP for AJAX APIs
Needs engineers.
Thursday, July 12, 12
62. Features (1)
Data Collection:
most standard protocols (SNMP, REST, JDBC, etc.)
some nice bridges to legacy systems:
(nagios, munin, etc.)
Data Storage:
supports sharding
never delete old data
Thursday, July 12, 12
63. Features (2)
We don’t do histograms now
Because all the old data is stored, we could
If we have enough data to make this worthwhile,
we will likley need an on-the-fly approach
We store raw data and rollups including:
average, cardinality, stddev, derivatives
(and counters)
Thursday, July 12, 12
64. Features (3)
separates data from visualization
drag-n-drop graphing
real-time data:
you can run checks “often” (every 100ms?)
you can see that data in the browser
you can compose a graph from disparate data
Thursday, July 12, 12
65. Active vs. Passive
Reconnoiter supports passive metric submission
what version of code is deployed
Reconnoiter’s design is focused on active collection
how may users have signed up
how many visitors to your site
how full is your disk
how many open bugs
how many hours spent
Thursday, July 12, 12
66. Bias
Reconnoiter doesn’t solve all your problems
(we’re busy trying to do that with Circonus)
I believe Reconnoiter is the best tool available
for heterogeneous, multi-datacenter, full-architecture
monitoring.
I am seriously biased.
Thursday, July 12, 12
67. You’ve Been Deceived.
let’s just skip this one, okay?
1. Denial and Isolation
If you’re not angry, get angry:
2. Anger it’s the next step in healing
3. Bargaining
This is where it gets interesting.
4. Depression
5. Acceptance Here we are.
This is on you. Good luck.
Thursday, July 12, 12