Download to read offline


![To predict the future,
we look to the past.
Web monitoring:
• [2000]-> Synthetic Monitoring
• [2010] -> RUM
Systems monitoring:
• [2010] -> Synthetic Monitoring
• [????] -> Observed Behavior Monitoring](https://image.slidesharecdn.com/srecon-coherent-performance-160713153659/85/SRECon-Coherent-Performance-18-320.jpg)


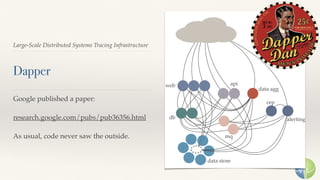
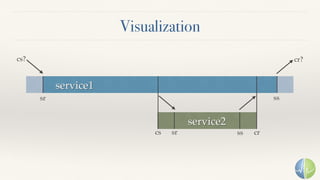
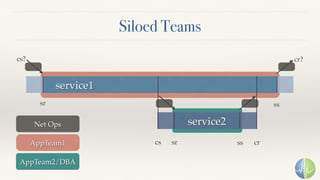
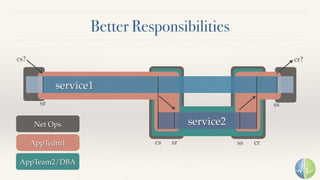


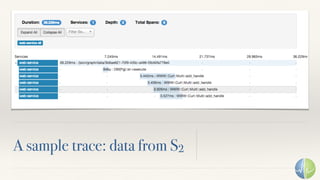


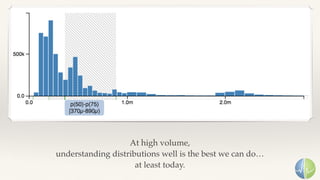
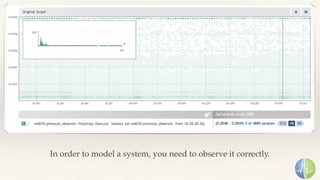
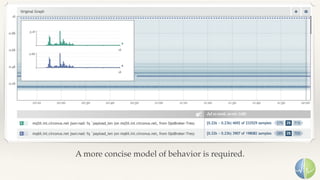
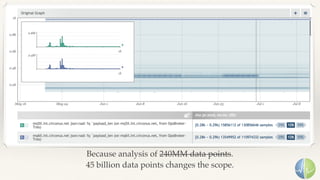


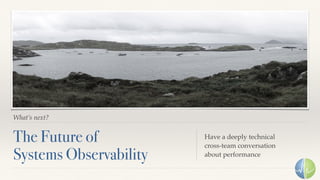
The document discusses the importance of performance in complex systems, emphasizing that latency is a critical metric over throughput for enhancing user experience and system efficiency. It suggests that developing a performance culture should focus on consistent communication and collective achievements, while examining historical trends in system observability and monitoring. Lastly, it critiques existing monitoring tools and approaches for their limitations and proposes the need for new methodologies to effectively trace and understand system behavior.


![Getting Started with Apache Spark: Big Data Made Simple [Free Meetup]](https://cdn.slidesharecdn.com/ss_thumbnails/apachesparkgettingstarted-260203175547-8361bcc3-thumbnail.jpg?width=640&height=640&fit=bounds)


