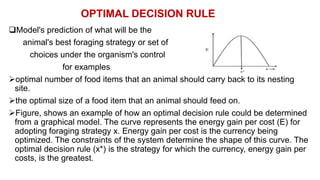
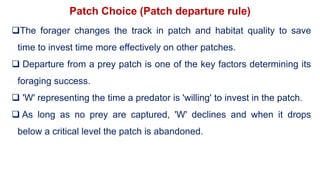
1. The document presents information on foraging ecology, including optimal foraging theory, the marginal value theorem, and central place foraging. It discusses concepts like patch departure rules, prey choice models, and foraging by pollinators.
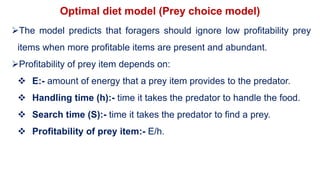
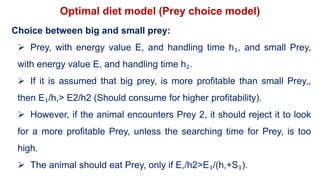
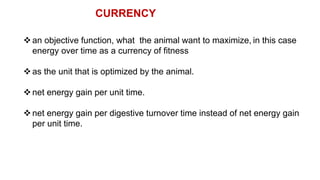
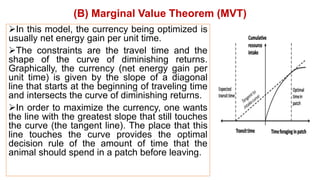
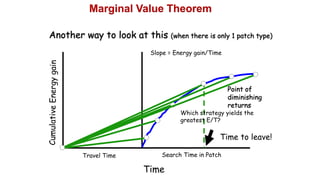
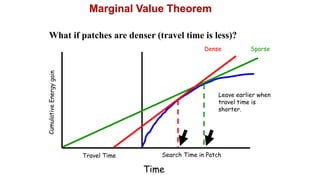
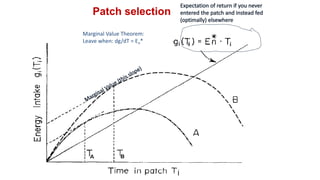
2. Key optimal foraging concepts discussed include prey profitability based on energy gained versus handling time, and the marginal value theorem which describes when an animal should leave a patch based on diminishing returns.
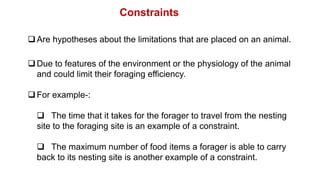
3. Central place foraging theory is described as looking at how foraging time is impacted by travel time between patches and a central location like a nest.