SlideShare a Scribd company logo
Label-Free Method for Cell Counting in Crude Biological Samples via
Paramagnetic Bead Aggregation
Jingyi Li,†,∥,■
Qian Liu,†,∥
Li Xiao,†
Doris M. Haverstick,‡
Alison Dewald,†,▲
Linda Columbus,†
Kimberly Kelly,§
and James P. Landers*,†,‡,⊥,∥
†
Department of Chemistry, ‡
Department of Pathology, §
Department of Biomedical Engineering, ⊥
Department of Mechanical and
Aerospace Engineering, ∥
Center for Microsystems for the Life Sciences, University of Virginia, Charlottesville, VA 22904
*S Supporting Information
ABSTRACT: Under chaotropic conditions, DNA released from lysed cells
causes the aggregation of paramagnetic beads in a rotating magnetic field in a
manner that is independent of the presence of other cellular components. The
extent of aggregation correlates with the mass of DNA in a quantitative manner
(Leslie, D. C. et al., J. Am. Chem. Soc. 2012, 134, 5689−96), and from this, the
number of DNA-containing cells in the sample can be enumerated. Microbial
growth testing is demonstrated by monitoring bead aggregation with E. coli in
the presence of ampicillin. Without the need for fluorescent labeling or Coulter
counting, the white blood cell count can be defined directly from a microliter of
crude whole blood. Specificity is brought to the process by coupling bead-based
immunocapture with DNA−bead aggregation allowing for the enumeration of
CD4+ T cells from human blood samples. The results of DNA-induced bead
aggregation had a 95% correlation with those generated by flow cytometry. With the process requiring only inexpensive, widely
available benchtop laboratory hardware, a digital camera, and a simple algorithm, this provided a highly accessible alternative to
more expensive cell-counting techniques.
For decades, cell counting has been the modern workhorse
of biomedical science and molecular biological research.
Flow cytometry is regarded as the gold standard for counting
cells, primarily due to its speed, throughput and accuracy.
However, its cost, large footprint, maintenance, cost per
sample, and complexity of operation limit its widespread use.
Microscopy is a low-cost alternative for counting cells, but it is a
laborious procedure, subjective in nature, and often does not
meet the throughput needs of laboratories. Coulter counting
provides an intermediate technology that bridges the complex
but highly automated flow cytometry and the low-tech, manual
light microscopy. Efforts to miniaturize cell counting have been
explored by a number of groups. Chung et al. reviewed
miniaturized flow cytometry, including cell transport and
detection in a microfluidic system, either optical or
impedometric.1
Rodriguez et al. reported the use of a
membrane in miniaturized flow cell to capture cells of interest,
which can be enumerated with microscopic imaging.2
Cheng et
al. developed a similar strategy, where cells were isolated with
immunoseparation in a microfluidic chamber before enumer-
ation under a microscope,3,4
and later reported the use of cell
lysate impedance spectroscopy as the detection module.5
Moon
et al. integrated microfluidic chips with a lensless imaging
system to shorten the time required for the whole process.6
Wang et al. labeled the captured cells with chemiluminescence
in a microfluidic chip and correlated the intensity with cell
number.7
Despite the promising progress, high cost and
complexity remain as issues. This is due not only to the use
of fluorescent labels that are inherently unstable but also to the
need for complex detection systems.
In clinical settings, Coulter counting suffices for generic
white blood cell (WBC) and red blood cell (RBC) counting,
and it is reasonably fast and cost-effective. For more specific cell
quantification, flow cytometry is the dominating technology.
For example, the level of CD4+ T cells is often quantified in
whole blood from patients infected with the human
immunodeficiency virus (HIV) or suspected of HIV infection
based on symptomology. In addition to providing a snapshot of
the status of the immune system, specific quantification of
CD4+ T cells is a critical metric for evaluating the response to
antiretroviral therapy (ART). In fact, a 2007 UNAIDS study
estimated that only ∼30% of eligible HIV patients had access to
antiretroviral therapy (ART), with one of the main reasons
being the lack of accessible cell counting facilities in resource-
limited areas. Interestingly, Redd and Quinn suggest that
simple, accurate, and cost-effective technologies for quantifying
whole blood CD4+ cell levels is a critical component in
expanding the access to ART.8
This single example brings to
light the deficit that exists in cell-counting chemistries and
instrumentation that are portable, simple, and cost-effective for
use at the point-of-care.
Received: May 9, 2013
Accepted: November 4, 2013
Published: November 4, 2013
Article
pubs.acs.org/ac
© 2013 American Chemical Society 11233 dx.doi.org/10.1021/ac401402h | Anal. Chem. 2013, 85, 11233−11239
Paramagnetic beads have been extensively studied for their
unique magnetic properties9
and application to a wide array of
bioanalytical processes; these include immunoseparation,10
transportation,11
mixing,12
and the detection13,14
of select
analytes of interest. Recently, we reported the “pinwheel
effect”,8
which describes chaotropic-driven adsorption of DNA
onto paramagnetic silica beads in a quantitative manner.
Captured images of the induced bead−DNA aggregates
followed by image analysis (using a simple algorithm) allows
for direct quantification of DNA in crude biological samples.
The simplicity of the chemistry (guanidine + beads + sample),
the instrumentation (magnetic field + digital camera), and the
method (pipet + magnetize + capture image) make this a cost-
effective, low-tech method for quantifying DNA in microliter
samples with a picogram limit of detection. We showed
preliminary evidence for the potential to count WBCs in whole
blood, and this spawned a more in-depth exploration of the
capabilities of the pinwheel effect for cell counting.
In this report, we show that the same assay can be used to
monitor the growth of cultured cells using only a few
microliters of sample. We also demonstrate that leukocytes
can be directly enumerated in whole blood without labeling or
purification with an accuracy and precision that compares
favorably with Coulter counting. Finally, we make quantifica-
tion cell-specific by coupling pinwheel with immunomagnetic
cell capture, demonstrating that CD4+ T cells can be
enumerated with sufficient sensitivity and accuracy to monitor
HIV/AIDS patients. As such, the pinwheel assay represents a
new, label-free method for cell counting where the simple
protocol and cost-effective instrumentation provides a highly
accessible alternative to more expensive counting techniques.
■ METHODS AND MATERIALS
Reagents. MagneSil paramagnetic particles were purchased
from Promega (Madison, WI). GdnHCl was bought from MP
Biomedicals (Solon, OH). MES was bought from Acros
Organics. Tris base was bought from Fisher Scientific. EDTA
was bought from Sigma-Aldrich. Human SH-SY5Y cells and
mouse RAW 264.7 cells were obtained from ATCC. E. coli
BL21(DE3) and D29 bacteriophage were obtained from New
England Biolabs (Ipswich, MA). Whole blood samples were
donated by consenting donors. CD4 isolation kit was bought
from Life Technologies. All solutions were prepared in
Nanopure water (Barnstead/Thermolyne, Dubuque, IA).
Reagent Preparation. Thirty microliters of stock Magnesil
beads was washed once with deionized, distilled water
(Nanopure) followed by one wash with GdnHCl solution (8
M, 1× TE, adjusted to pH 6.1 with 100 mM MES) and
resuspended in 1 mL of GdnHCl solution to make the
suspension.
Microwell Fabrication, Assay Instrumentation, and
Magnetic Field Application. Details have been described
previously. The system, with a rotating magnetic field (RMF),
of the pinwheel assay for DNA quantification was employed for
cell counting without any modifications.15
Image Processing. A gray level threshold was set in the
images of magnetic beads and aggregates by an isodata
algorithm written in Mathematica software, which identifies
the pixels representing the beads and aggregates. The total
number of these pixels in the photograph without DNA is
defined as 100%, and as more DNA molecules are released
from cells, tighter aggregation evolves, corresponding to a
smaller percentage. The change of the percentage is defined as
degree of aggregation (DA). More DNA molecules result in
tighter bead aggregation and higher DA values.
Establishment of Calibration Curves. Samples were first
incubated with GdnHCl solution in 1:100 volume ratio at room
temperature for 30 min. The samples were then serially diluted
in GdnHCl solution to appropriate concentrations as shown in
the figures. Five microliters of diluted sample, 3 μL of bead
suspension, and 12 μL of GdnHCl were mixed and exposed to
the RMF for 5 min, after which three photographs of the beads
and aggregates were acquired for image analysis. The
calibration curve was generated by correlating the mean DA
value of three images for each diluted sample with the
corresponding final cell concentration in the pinwheel assay.
Microbial Growth Testing. E. coli strain BL21(DE3) was
cultured in 1000 mL of liquid LB medium and incubated at 37
°C. Samples (1 mL) were collected at hour intervals for 5 h.
The culture was split into two equal volumes at t = 3 h, and one
volume was treated with 0.1 mg/mL ampicillin. Cell counting
based on absorbance measurements at 600 nm was obtained
with a UV/Visible spectrophotomer (Beckman Coulter,
DU800) in a 1 mL plastic cuvette at room temperature.
White Blood Cell Counting for Unknown Samples.
Raw blood samples were first incubated with GdnHCl solution
in 1:100 volume ratio at room temperature for 30 min. The
samples were diluted by 2000 fold. Five μL of diluted sample, 3
μL of bead suspension, and 12 μL of GdnHCl were mixed and
exposed to the RMF for 5 min, after which photographs of the
beads and aggregates were acquired for image analysis.
Considering mixing sample and beads results in another 4-
fold dilution, the samples were diluted by 8000 fold from raw
blood to the pinwheel assay. The concentration of white blood
cells in blood was acquired by comparing DA value with the
calibration curve (Figure 4). For the samples with WBC count
lower than 4 × 10³
per μL, a final 4000-fold dilution was
performed in the pinwheel assay, and more accurate results
were acquired because of an optimized dynamic range.
Immunomagnetic Separation of CD4+ T Cells from
Blood. CD4+ T cells were isolated by a Dynal T4 Quant kit
following its protocols. Briefly, whole blood was incubated and
rotated with CD14-coated beads for 10 min, followed by
another 10 min incubation and rotation with CD4-coated
beads. Samples were then washed three times with PBS buffer.
Enumeration of CD4+ T Cells with Hemocytometer.
Isolated CD4+ T cells were lysed by the lysis solution provided
in the Dynal T4 Quant kit. The lysed cells were stained with
Sternheimer−Malbin solution and loaded on a hemocytometer,
and the nuclei were counted using a conventional white light
microscope.
Enumeration of CD4+ T Cells with the Pinwheel
Assay. After immunomagnetic separation, the isolated CD4+
T cells were incubated in 100 μL of 8 M GdnHCl solutions for
30 min, and the solution was further diluted 20, 40, 80, and
160-fold with 8 M GdnHCl. These four aliquots were then
loaded into the pinwheel microwell following the same
procedure as white blood cell counting.
■ RESULTS AND DISCUSSION
Paramagnetic Bead Aggregation Enables Cell Enu-
meration. With the pinwheel effect, DNA adsorbs to silica-
coated paramagnetic beads under chaotropic conditions, and
driven by a rotating magnetic field (RMF), the beads are
intertwined by DNA and rapidly aggregate (in seconds to
minutes) (Figure 1A). The degree of aggregation correlates
Analytical Chemistry Article
dx.doi.org/10.1021/ac401402h | Anal. Chem. 2013, 85, 11233−1123911234
well with the concentration of DNA, allowing for fast DNA
quantification without the need of fluorescent labels.15
Owing
to the specificity of the chaotrope-driven DNA adsorption on
silica,16
bead aggregation induced by DNA released from the
cell lysate is unaffected by protein, lipid, and other cellular
components present at concentrations orders of magnitude
higher; this is the case for even a few cells (Figure 1B). Given
that each DNA-containing cell in a blood sample releases the
same mass of DNA (6.25 pg), the extent of bead aggregation
defines the number of cells in the sample. Figure 1 panels B2−
B4 show images of beads that have been aggregated by 13, 52,
and 195 pg of DNA, respectively. While the protein released
from 30 cells is ∼15 ng, it is noteworthy that augmenting the
solution with additional protein (BSA; to a final concentration
of 1 μg/μL) does not adversely affect aggregation.17
An inherent advantage of the chemistry that induces the
pinwheel effect (i.e., guanidine) is that it also lyses cells
effectively; thus, no additional reagents are required for direct
cell counting. A cell solution added to 8 M GdnHCl at a 1:100
volume ratio induces bead aggregation immediately following
vortexing, which is key to the pinwheel assay enabling the
enumeration of cells. The rapidity with which cell lysis occurs is
supported by the fact that aggregate formation (visually
detectable aggregates in seconds) does not improve with
longer incubation times (e.g., up to 60 min) (see Supporting
Information Figure S1). This yields a simple protocol for cell
enumeration: (a) lyse cells in 8 M GdnHCl to release DNA,
(b) bring the sample DNA concentration within the dynamic
range of the assay through sample dilution, (c) mix the sample
with silica-coated magnetic beads in a RMF to induce
aggregation, (d) capture digital images and process the images
through an algorithm to generate a % DA and, finally, (e)
compare resultant value to a standard curve to calculate cell
concentration (details are provided in the experimental
section). As DNA begins to entangle with the beads,15
small
bead aggregates evolve from the initial dispersed state, growing
through nucleation with other beads, allowing smaller
aggregates to coalesce into larger ones. The higher the DNA
concentration, the more aggressive the aggregate formation and
subsequent coalescing become. Overall, the beads experience a
transition from the dispersed state in the negative control (i.e.,
without DNA) to a condensed aggregation state with sufficient
DNA. Even with only a few cells, aggregation induced by
released DNA leads to a decrease of the total number of pixels
representing the beads and/or bead aggregates; this we refer to
as dark area.15
A threshold is set by an isodata algorithm15
to
separate the beads and/or aggregates from image background,
shown as the black line in the histogram (Figure 1C). The peak
area below the threshold stands for the dark area, and the
decrease of dark area represents the loss of dispersed beads due
to aggregation. Therefore, we define the decrease of dark area
that is normalized against the negative control as DA.
Correlating DNA concentration and DA generates a calibration
curve for DNA quantification. With each somatic cell
containing 6.25 pg DNA (discussed earlier), a simple
calculation allows for plotting DA against the number of cells
in a particular volume (typically 1 μL). Regardless of the source
of DNA, the higher the DNA concentration, the larger the DA.
This provides a quantitative correlation between the extent of
aggregation and the number of cells in a specific volume of
sample, for example, as in Figure 2.
Pinwheel assay standard curves for the enumeration of: (a)
eukaryotic cells (human WBCs and mouse cells), (b)
prokaryotic cells (E. coli), and (c) bacteriophage (D29) are
given in Figure 2. While not a “cell”, phage are virus-like
macromolecular assemblies of protein and nucleic acid, with an
intact genome of length of 49 × 103
base pairs. The DNA
extracted from this phage is double-stranded, and with a 49 kbp
length, a rough estimate of the length is ∼16 μm.18
As shown in
Figure 2, it is still capable of inducing aggregates, but it does so
with an effectiveness that is roughly an order of magnitude less
than E. coli, whose genome is 4.6 Mb. There is a 3 order of
Figure 1. Schematic of the pinwheel effect induced by lysed cells. (A) GdnHCl lyses the cells and drives the released DNA to adsorb on to silica-
coated paramagnetic beads, which form aggregates in a rotating magnetic field (RMF). Images of the aggregation are digitized, from which the initial
concentration of cells can be measured. (B) Photographs of the same amount of beads with different amounts of DNA that are equivalent to 0, 2, 8,
and 32 cells, respectively. Magnetic beads, which remain dispersed in RMF, form visually detectable aggregates within minutes upon mixture with
lysed human cells. (C) Gray level histogram of the four photographs. Three regions are identified as aggregates, dispersed beads, and background,
respectively, on the basis of the gray level value. The change of the histogram clearly illustrates the loss of dispersed beads and the formation of
aggregates.
Analytical Chemistry Article
dx.doi.org/10.1021/ac401402h | Anal. Chem. 2013, 85, 11233−1123911235
magnitude differential in the size of the E. coli DNA versus
mouse or human DNA. As the curve in Figure 2 (a semilog
plot) shifts from left to right, the sensitivity decreases over 3
orders of magnitude; not surprisingly, this roughly correlates
with the decrease in genome size with each cell type. For
human cells, ∼8 cells in 20 μL corresponds to 0.4 cells/μL and
a DNA concentration of 2.5 pg/μL. Despite this miniscule
mass, the induced aggregation is still visually detectable (Figure
1B), with the limit of detection (through image analysis)
approaching 0.1 cell/μL, that is, 2 cells in a total of 20 μL
(Figure 2). The concept that sensitivity is proportional to DNA
length is consistent with our previous observations15
and is
rationalized as longer strands of DNA induce bead aggregation
more effectively than shorter ones. As a result, each cell type
should be calibrated individually in order to acquire accurate
results. To further study the size dependence, the actual DNA
size distribution should be measured by other techniques such
as electrophoresis and correlated more quantitatively with the
sensitivity of the pinwheel assay.
Microbial Growth Testing with the Pinwheel Assay.
Accurate and quick determination of bacteria concentration is
essential in microbiology studies. To test the effectiveness of
measuring microbial growth with the pinwheel assay, E. coli was
cultured in media, and the time evolution of growth was
monitored by two methods: light scattering (spectrophotom-
etry at 600 nm) and the pinwheel assay. From the liquid
culture, 1 mL was sampled every hour, and after 3 h, the cells
were split, where half were dosed with buffer and the other half
with ampicillin (0.1 mg/mL). Monitoring the bacterial growth
conventionally by absorbance at 600 nm (Figure 3A), bacterial
cell doubling is apparent (from a 1 mL sample) by the increase
of cell number up to the 3 h point. However, addition of
ampicillin retards E. coli growth, and not only levels the growth
curve (i.e., no further doubling), but the addition of ampicillin
actually leads to a reduction in the bacterial concentration.19
Similar evaluation was carried out by pipetting 5 μL aliquots
from the growth medium into microwells containing GdnHCl
and paramagnetic beads. As given in Figure 3B, the results
acquired from the pinwheel assay also illustrate a comparable
trend of bacterial growth. For the sake of simplicity, DA is
directly compared to illustrate the change of cell concentration.
Because DA does not increase linearly with cell count (Figure
2), the difference of DA between “with ampicillin” and “without
ampicillin” does not appear to be as substantial as that of the
absorbance measurement. A closer match between the
absorbance measurement and the pinwheel assay can be
obtained by converting the signals in both methods to cell
counts.
Enumeration of White Blood Cells in Whole Blood.
WBCs (leukocytes) are critical components in our defense
against foreign bodies and infectious agents. The white blood
cell count can be a generic indicator of immune system status
and is useful for clinical testing, in particular with molecular
diagnostics. The pinwheel assay has the potential to provide a
simple and rapid method for determining of WBC count.
To generate the calibration curve for WBC counting, blood
samples were drawn from four normal patients on the day of
the analysis, and the WBC counts were determined by Coulter
counter. The samples were lysed with 8 M GdnHCl and serially
diluted for pinwheel analysis. Figure 4 illustrates the correlation
between degree of aggregation and WBC count after dilution.
Curves derived from 4.1, 10.1, and 20.3 (× 103
WBCs/μL
predilution) samples overlap well with each other. The 2.3 ×
103
WBCs/μL sample, however, reproducibly yields a higher
Figure 2. Calibration curve of the pinwheel assay for cell counting. DA
is correlated with cell (or phage) concentration and fitted into an
exponential model. The sensitivity decreases from human and mouse
cells (eukaryote) to phage D29 (although not a cell), which can be
attributed to the decrease of DNA length and genome size. The x-axis
is plotted in log scale in order to illustrate the difference of calibration
curves between human and mouse cells, which have similar genome
sizes. The solid line represents an exponential calibration function
fitted to the data at logarithmic scale; the shaded area and gray lines
show the 95% and 99% confidence bands (the same for all curve
fitting, unless otherwise noted).
Figure 3. Microbial growth testing of E. coli in the presence of
ampicillin. At the 3 h mark, half the cells were dosed with buffer, while
the other half were dosed with ampicillin, as growth monitoring
continued.
Figure 4. Calibration curve of the pinwheel assay for WBC counting
directly in raw blood samples. Four blood samples, with their WBC
counts determined with Coulter counter, were analyzed with the
pinwheel assay, as represented by ▽ = 2.3, Δ = 4.1, □ = 10.1, and • =
20.3 (× 103
per μL) with associated error bar denoting the standard
deviation of three experiments on each sample. The symbol • and the
corresponding error bar denote the mean and standard deviation of
the four samples.
Analytical Chemistry Article
dx.doi.org/10.1021/ac401402h | Anal. Chem. 2013, 85, 11233−1123911236
DA at the same [WBC]; this is because it falls outside the
dynamic range of the assay and, thus, results in a larger standard
deviation for the mean values above 40% DA. This may be
caused by components in the blood other than WBCs (e.g.,
proteins such as albumin, or a combination of protein and
divalent cations like Ca2+
), of which the concentration remains
relatively high after dilution due to the low initial WBC
concentration and low dilution factor. Elucidation of the
mechanism is currently ongoing and will be the topic of a
separate report when completed. As a result, only the region
above a DA of 60% is regarded as the effective calibration range
for WBC quantification. Therefore, DA values in that range
(>60%) must be obtained for accurate cell counting.
To evaluate the ability of the pinwheel process to enumerate
the WBCs in unknown samples, dilution is needed so that the
DA falls in the effective calibration range. By comparing the
measured value with the calibration curve, the WBC count can
be estimated following dilution ([WBC]dil), which is then
converted to the initial WBC count ([WBC]init) by multiplying
by the dilution factor. Given that the calibration curve covers
from 0.5 to 5 WBCs/μL, a 4000-fold dilution enables
quantification of blood samples with WBC count between
2000 and 20 000 per μL. Since the WBC count of adults
typically varies between 4000 and 11 000 per μL, a 4000-fold or
8000-fold dilution would be sufficient to cover the normal
range and to identify samples with abnormal WBC count.
To test accuracy of the pinwheel-derived WBC counting,
nine raw blood samples with unknown WBC counts were
acquired, lysed, and diluted appropriately. Three replicates were
performed on each sample, and the mean DA was compared to
the standard curve to determine initial WBC count. These
values were compared to those independently obtained by a
Coulter counter, and the results are given in Figure 5A. The
counts from both compare favorably for the samples with
[WBC]init ranging from 2 × 10³
per μL to 14 × 103
per μL; this
covers the normal range for WBC count and suffices for
samples where there is a need to identify counts outside the
normal range (bracketed by the two dashed lines). Figure 5B
provides graphical representation of the excellent correlation
between the pinwheel results and those from Coulter counter
(R2
= 0.97).
Counting CD4+ T Cells with the Pinwheel Assay. While
effective for WBC counting, the pinwheel effect is generic
because the adsorption of DNA on silica is not specific to
genomic sequence; hence, subtyping of cells in a complex
mixture is not possible without invoking the use of a “selective”
step. We chose CD4+ T cells, a WBC subtype, as a model to
demonstrate that selectivity and pinwheel sensitivity could be
coupled in a powerful way. CD4+ T-cell levels are critical in
Figure 5. WBC counts of nine raw blood samples determined by the pinwheel assay are shown in (A) and compared with the results from Coulter
counter. (B) The WBC counts of the nine samples determined with the pinwheel assay correlate well with the results from Coulter counter. The
data points represent the mean results of three experiments on each sample, and the error bars denote the standard deviation. The solid blue line
represents a linear calibration function fitted to the data with R2
= 0.97, and the black dashed line shows y = x.
Figure 6. Immunomagnetic separation of CD4+ T cells from blood and the calibration curve for quantification. (A) Schematic of immunomagnetic
separation of CD4+ T cells from crude blood samples. Monocytes, which also express the CD4 antigen, are depleted prior to CD4+ T cells. (B)
Purified samples are serially diluted after lysis, and the calibration curve is established by correlating degree of aggregation with the CD4 count
determined by microscopy.
Analytical Chemistry Article
dx.doi.org/10.1021/ac401402h | Anal. Chem. 2013, 85, 11233−1123911237
assessing the progress of AIDS and also in monitoring anti-HIV
treatment. CD4+ T-cell quantitation is currently accomplished
using flow cytometry, where the obvious drawbacks are high
cost, high maintenance, and poor portability. A rapid,
substantially less expensive and less complex methodology for
CD4+ T-cell counting could be valuable, especially if point-of-
care applications are to be considered. One solution to this
involves a commercial immunomagnetic separation kit. This kit
exploits antiCD4+-coated magnetic beads for isolating CD4+ T
cells from blood, but also captures monocytes (they express
CD4). However, monocytes also express CD14 on their
surface,4
allowing for antiCD14-coated beads to deplete the
sample of monoctyes, prior to the capture of CD4+ T cells
(Figure 6A). In the protocol described by the manufacturer, the
captured CD4+ T cells are partially lysed so that their nuclei
can be released and enumerated with a hemocytometer under a
microscope after staining. While labor-intensive and, in some
ways, subjective, immunocapture with microscope-based
counting certainly provides a cost-effective alternative to flow
cytometry. Studies of normal and HIV-positive individuals have
shown a correlation coefficient of 0.97 for CD4+ cell levels
relative to values from hemacytometer.
To circumvent the microscopic counting of stained cells, we
substituted this step with the pinwheel assay. With the pinwheel
process, the isolated cells are completely lysed, and pinwheel
aggregation is induced by the released DNA, allowing for
quantification of cells. The correlation between DA and cell
concentration is illustrated in Figure 6B, which provides the
calibration curve to determine the CD4+ T-cell count in blood
samples. Since the enumeration of CD4+ T cells involves
preassay isolation of the cells, the effectiveness of this process
relies on the efficient and consistent CD4+ T-cell isolation. The
mean isolation yield that was observed (calculated by dividing
the microscopic cell count with the flow cytometry count of the
original sample) was found to be 91.5 ± 4.3% for four blood
samples when the blood samples were withdrawn within 24 h.
To evaluate the accuracy of the pinwheel assay, two aliquots of
purified cells were acquired from each unknown sample, with
one partially lysed for microscopy quantification and the other
completely lysed for the pinwheel assay. Comparison shows a
good correlation between the two methods with 13 patient
blood samples (see Supporting Information Figure S2), which
suggests that the pinwheel assay can, indeed, enumerate the
isolated cells accurately.
In the clinical setting, CD4+ T-cell count can be indicative of
the immune status of a patient. When the CD4+ T-cell count is
lower, along with other factors, it can represent the progress of
HIV infection; when the count is higher, it can indicate
recovery from immunodeficiency through decreased viral load.
The pinwheel CD4+ levels in 21 blood samples following
immunomagnetic separation were compared with the results
from flow cytometry (Figure 7A,C). The collective data is from
two sample groups from two sources (8 samples analyzed same
day as blood draw; 13 samples analyzed >24 h after blood
draw). A good correlation was observed between the
immunocapture−pinwheel assay and flow cytometry, when
the samples were analyzed within 24 h of the blood draw
(Figure 7A,B). Dramatically poorer correlation between the
pinwheel and flow cytometry methods was observed with
samples analyzed more than 24 h postdraw (Figure 7C). This
observation is consistent with the observation by Diagbouga et
al. that 31%−69% of blood samples exhibit more than a 20%
decrease of CD4 count after a 24 h delay,20
which directly
affects the accuracy of the pinwheel assay.
For HIV-infected patients, initiation of ART is determined by
a CD4+ T-cell count that drops below 350 cells/μL. What we
have demonstrated here is that, with the 21 whole blood
samples evaluated from HIV patients, the pinwheel assay
correctly categorized those determined by flow cytometry to be
above or below the 350 cells/μL cut off. Only one sample (one
Figure 7. Quantification of CD4+ T cells. The pinwheel result correlates well with flow cytometry when the post-drawn time of blood is less than 24
h, as shown in (A) and (B). For the samples with post-drawn time over 24 h, the accuracy of the pinwheel assay is compromised due to the
deterioration of sample quality, as shown in (C) and (D). The solid blue lines in (B) and (D) represent linear calibration functions, and the black
dashed lines show y = x. The gray dashed lines represent the threshold (350 cells per μL) that defines the starting time of ARV for HIV patients (for
(B), R2
= 0.997; for (D), R2
= 0.775). The arrows in (C) and (D) point to the only sample that generated a false result in the pinwheel assay.
Analytical Chemistry Article
dx.doi.org/10.1021/ac401402h | Anal. Chem. 2013, 85, 11233−1123911238
from the >24 h storage time group) was categorized as false
positive, and this point is labeled with a gray arrow in Figure
7D. Despite the asynchrony in the storage history of these
samples, this still represents a >95% correlation between the
immunocapture−pinwheel assay and flow cytometry. This is
remarkable and points to the obvious merit of a method that
does not require fluorescent reagents, microscopy, or
cytometric counting.
■ CONCLUSIONS
In conclusion, we have extended the application of the
pinwheel assay from nucleic acid quantification to cell counting,
and demonstrated (1) microbial growth testing, (2) cell
counting in a complex medium (WBC quantification in raw
blood), as well as (3) isolation and enumeration of a specific
subtype of cells from a mixture (CD4+ T cells). While we have
a simple methodology for generic cell counting, specificity was
brought to the method by coupling with immunocapture.
These examples show the versatility of the pinwheel assay (i.e.,
that the assay has the potential to be applied in various fields),
although we do not anticipate that the pinwheel assay will
replace all the conventional methods. As the aggregation of
magnetic particles only requires microliter volume of samples
and a digital camera as the detection modality, the pinwheel
assay could serve as a portable and cost-effective alternative to
conventional technologies for point-of-care applications.
One of the main advantages is that the pinwheel assay does
not require fluorescent labels and complex optics or expensive
instrumentation to enumerate cells. Fluorescence provides
accurate and sensitive quantification of analytes in various
applications, but the labels are often subject to photobleaching,
resulting in unstable optical properties, which increases the cost
for reagent storage and induces the need for repetitive
calibration. By avoiding fluorescent labels, the pinwheel assay
offers enhanced simplicity and cost-effectiveness compared to
conventional techniques, which are always desired when
applying a new technique in resource-limited regions. One of
the major drawbacks of the pinwheel assay is that the cells are
lysed after counting, and thus will not be available to other cell
analyses, which may be problematic if sample availability is
limited.
Day-to-day variability with the pinwheel method was low, a
likely result of the simplicity of the method. User-to-user
variability is more likely to be significant, but this can be
overcome by building a larger database for calibration of the
assay independent of the user. We are currently exploring
designs for integrating all of these processes on a single
microfluidic device to minimize hands-on operation and user-
to-user variabilitythis is essential for progressing toward a cell
counting device with sample-in-answer-out capability. Progress
on device development has been made in terms of enhancing
assay throughput21
and process automation.22
Successful
employment of the pinwheel assay in an integrated microfluidic
system will not only benefit basic biomedical research but also
offer capability to a wide range of clinical applications.
■ ASSOCIATED CONTENT
*S Supporting Information
Additional information as noted in the text. This material is
available free of charge via the Internet at http://pubs.acs.org.
■ AUTHOR INFORMATION
Corresponding Author
*E-mail: jpl5e@virginia.edu.
Present Addresses
■
Microlab Horizon, LLC, 705-D Dale Ave., Charlottesville, VA
22903 (J.L.)
▲
Salisbury University, 1101 Camden Ave., Salisbury, MD
21801 (A.D.)
Notes
The authors declare no competing financial interest.
■ REFERENCES
(1) Chung, T. D.; Kim, H. C. Electrophoresis 2007, 28 (24), 4511−
4520.
(2) Rodriguez, W. R.; Christodoulides, N.; Floriano, P. N.; Graham,
S.; Mohanty, S.; Dixon, M.; Hsiang, M.; Peter, T.; Zavahir, S.; Thior, I.;
Romanovicz, D.; Bernard, B.; Goodey, A. P.; Walker, B. D.; McDevitt.,
J. T. PLoS Med. 2005, 2 (7), 663−672.
(3) Cheng, X.; Irimia, D.; Dixon, M.; Sekine, K.; Demirci, U.; Zamirb,
L.; Tompkins, R. G.; Rodriguez, W.; Toner, M. Lab Chip 2007, 7 (2),
170−178.
(4) Cheng, X.; Gupta, A.; Chen, C.; Tompkins, R. G.; Rodriguez, W.;
Toner, M. Lab Chip 2009, 9 (10), 1357−1364.
(5) Cheng, X.; Liub, Y.; Irimia, D.; Demirci, U.; Yang, L.; Zamir, L.;
Rodríguez, W. R.; Toner, M.; Bashir, R. Lab Chip 2007, 7 (6), 746−
755.
(6) Moon, S.; Keles, H. O.; Ozcan, A.; Khademhosseini, A.;
Hæggstrom, E.; Kuritzkes, D.; Demirci, U. Biosens. Bioelectron. 2009,
24 (11), 3208−3214.
(7) Wang, Z.; Chin, S.; Chin, C. D.; Sarik, J.; Harper, M.; Justman, J.;
Sia, S. K. Anal. Chem. 2010, 82 (1), 36−40.
(8) Redd, A. D.; Quinn, T. C. Nat. Rev. Microbiol. 2008, 6, S1.
(9) Gijs, M. A. Microfluid. Nanofluid. 2004, 1 (1), 22−40.
(10) Chen, G. D.; Alberts, C. J.; Rodriguez, W.; Toner, M. Anal.
Chem. 2010, 82 (2), 723−728.
(11) Sista, R. S.; Eckhardt, A. E.; Srinivasan, V.; Pollack, M. G.;
Palanki, S.; Pamula, V. K. Lab Chip 2008, 8 (12), 2188−2196.
(12) Grumann, M.; Geipel, A.; Riegger, L.; Zengerle, R.; Ducree, J.
Lab Chip 2005, 5 (5), 560−565.
(13) Afshar, R.; Moser, Y.; Lehnert, T.; Gijs, M. A. Anal. Chem. 2011,
83 (3), 1022−1029.
(14) Moser, T.; Lehnert, T.; Gijs, M. A. Lab Chip 2009, 9 (22),
3261−3267.
(15) Leslie, D. C.; Li, J.; Strachan, B. C.; Begley, M. R.; Finkler, D.;
Bazydlo, L. A. L.; Barker, N. S.; Haverstick, D. M.; Utz, M.; Landers, J.
P. J. Am. Chem. Soc. 2012, 134 (12), 5689−5696.
(16) Melzak, K. A.; Sherwood, C. S.; Turner, R. F. B.; Haynes, C. A.
J. Colloid Interface Sci. 1996, 181 (2), 635−644.
(17) Leslie, D. C.; Li, J.; Finkler, D. M.; Price, C. W.; Landers, J. P.
Proc. 13th Int. Conf. Miniaturized Systems Chem. Life Sci., Jeju, Korea,
November 1−5, 2009; vol. 2.
(18) Voet, D.; Voet, J. G. Biochemistry, 2nd ed.; John Wiley and Sons:
New York, 1995; p 1361.
(19) Rogers, H. J.; Mandelstam, J. Biochem. J. 1962, 84, 299−303.
(20) Diagbouga, S.; Chazallon, C.; Kazatchkine, M. D.; Van de Perre,
P.; Inwoley, A.; M’Boup, S.; David, M. P.; Tenin, A. T.; Soudre, R.;
Aboulker, J.; Weiss, L. AIDS 2003, 17 (15), 2201−2208.
(21) Li, J.; Landers, J. P. Proc. 15th Int. Conf. Miniaturized Systems
Chem. Life Sci.Seattle, WA, October 2−6, 2011; pp 1956−1958
(22) Ouyang, Y.; Li, J.; Landers, J. P. Proc. 17th Int. Conf. Miniaturized
Systems Chem. Life Sci., Freiburg, Germany, October 27−31, 2013;
Analytical Chemistry Article
dx.doi.org/10.1021/ac401402h | Anal. Chem. 2013, 85, 11233−1123911239

More Related Content

What's hot

1 s2.0-s0015028214018603-main
1 s2.0-s0015028214018603-main1 s2.0-s0015028214018603-main
1 s2.0-s0015028214018603-main鋒博 蔡
 
Method for physiologic phenotype characterization at the single-cell level in...
Method for physiologic phenotype characterization at the single-cell level in...Method for physiologic phenotype characterization at the single-cell level in...
Method for physiologic phenotype characterization at the single-cell level in...
Shashaanka Ashili
 
Polymerase Chain Reaction (PCR)-Based Sex Determination Using Unembalmed Huma...
Polymerase Chain Reaction (PCR)-Based Sex Determination Using Unembalmed Huma...Polymerase Chain Reaction (PCR)-Based Sex Determination Using Unembalmed Huma...
Polymerase Chain Reaction (PCR)-Based Sex Determination Using Unembalmed Huma...
IOSR Journals
 
Nature - 454 Sequencing
Nature - 454 SequencingNature - 454 Sequencing
Nature - 454 SequencingMichael Weiner
 
The Effects of Natural Compounds on H4 Neuroglioma Cells
The Effects of Natural Compounds on H4 Neuroglioma CellsThe Effects of Natural Compounds on H4 Neuroglioma Cells
The Effects of Natural Compounds on H4 Neuroglioma Cells
TingtingThompson
 
OKC Grand Rounds 2009
OKC Grand Rounds 2009OKC Grand Rounds 2009
OKC Grand Rounds 2009Sean Davis
 
Cellular Senescence Paper
Cellular Senescence PaperCellular Senescence Paper
Cellular Senescence PaperStephen Liu
 
Stephen Friend Koo Foundation / Sun Yat-Sen Cancer Center 2012-03-12
Stephen Friend Koo Foundation / Sun Yat-Sen Cancer Center 2012-03-12Stephen Friend Koo Foundation / Sun Yat-Sen Cancer Center 2012-03-12
Stephen Friend Koo Foundation / Sun Yat-Sen Cancer Center 2012-03-12
Sage Base
 
Articles 1
Articles 1Articles 1
Articles 1
shimnas
 
3D cell culture techniques for the tumor models
3D cell culture techniques for the tumor models3D cell culture techniques for the tumor models
3D cell culture techniques for the tumor modelsDurgesh Jha
 
Next Generation Sequencing
Next Generation SequencingNext Generation Sequencing
Next Generation Sequencing
Shelomi Karoon
 
Sarcar B et al.,-Mol Cancer Ther-2011-Sarcar-
Sarcar B et al.,-Mol Cancer Ther-2011-Sarcar-Sarcar B et al.,-Mol Cancer Ther-2011-Sarcar-
Sarcar B et al.,-Mol Cancer Ther-2011-Sarcar-Bhaswati Sarcar
 
3D culture in phenotypic screening : advantages, process changes and new tech...
3D culture in phenotypic screening : advantages, process changes and new tech...3D culture in phenotypic screening : advantages, process changes and new tech...
3D culture in phenotypic screening : advantages, process changes and new tech...
HCS Pharma
 
Design study w1526455 finished
Design study w1526455 finishedDesign study w1526455 finished
Design study w1526455 finishedConnor Downing
 
CV Jan 2016
CV Jan 2016CV Jan 2016
CV Jan 2016
Minhee Ko
 
Jcpr 2015-7-4-815-823
Jcpr 2015-7-4-815-823Jcpr 2015-7-4-815-823
Jcpr 2015-7-4-815-823
Taghreed Al-Noor
 
Analysis of Single-Cell Sequencing Data by CLC/Ingenuity: Single Cell Analysi...
Analysis of Single-Cell Sequencing Data by CLC/Ingenuity: Single Cell Analysi...Analysis of Single-Cell Sequencing Data by CLC/Ingenuity: Single Cell Analysi...
Analysis of Single-Cell Sequencing Data by CLC/Ingenuity: Single Cell Analysi...
QIAGEN
 
The interaction of QDs with RAW264.7 cells_ nanoparticle quantification, upta...
The interaction of QDs with RAW264.7 cells_ nanoparticle quantification, upta...The interaction of QDs with RAW264.7 cells_ nanoparticle quantification, upta...
The interaction of QDs with RAW264.7 cells_ nanoparticle quantification, upta...Olga Gladkovskaya
 
3 d biomatrix-white-paper-3d-cell-culture-101
3 d biomatrix-white-paper-3d-cell-culture-1013 d biomatrix-white-paper-3d-cell-culture-101
3 d biomatrix-white-paper-3d-cell-culture-101
ratna azizah
 

What's hot (20)

1 s2.0-s0015028214018603-main
1 s2.0-s0015028214018603-main1 s2.0-s0015028214018603-main
1 s2.0-s0015028214018603-main
 
Method for physiologic phenotype characterization at the single-cell level in...
Method for physiologic phenotype characterization at the single-cell level in...Method for physiologic phenotype characterization at the single-cell level in...
Method for physiologic phenotype characterization at the single-cell level in...
 
Polymerase Chain Reaction (PCR)-Based Sex Determination Using Unembalmed Huma...
Polymerase Chain Reaction (PCR)-Based Sex Determination Using Unembalmed Huma...Polymerase Chain Reaction (PCR)-Based Sex Determination Using Unembalmed Huma...
Polymerase Chain Reaction (PCR)-Based Sex Determination Using Unembalmed Huma...
 
Nature - 454 Sequencing
Nature - 454 SequencingNature - 454 Sequencing
Nature - 454 Sequencing
 
The Effects of Natural Compounds on H4 Neuroglioma Cells
The Effects of Natural Compounds on H4 Neuroglioma CellsThe Effects of Natural Compounds on H4 Neuroglioma Cells
The Effects of Natural Compounds on H4 Neuroglioma Cells
 
OKC Grand Rounds 2009
OKC Grand Rounds 2009OKC Grand Rounds 2009
OKC Grand Rounds 2009
 
Cellular Senescence Paper
Cellular Senescence PaperCellular Senescence Paper
Cellular Senescence Paper
 
Stephen Friend Koo Foundation / Sun Yat-Sen Cancer Center 2012-03-12
Stephen Friend Koo Foundation / Sun Yat-Sen Cancer Center 2012-03-12Stephen Friend Koo Foundation / Sun Yat-Sen Cancer Center 2012-03-12
Stephen Friend Koo Foundation / Sun Yat-Sen Cancer Center 2012-03-12
 
pgs
 pgs pgs
pgs
 
Articles 1
Articles 1Articles 1
Articles 1
 
3D cell culture techniques for the tumor models
3D cell culture techniques for the tumor models3D cell culture techniques for the tumor models
3D cell culture techniques for the tumor models
 
Next Generation Sequencing
Next Generation SequencingNext Generation Sequencing
Next Generation Sequencing
 
Sarcar B et al.,-Mol Cancer Ther-2011-Sarcar-
Sarcar B et al.,-Mol Cancer Ther-2011-Sarcar-Sarcar B et al.,-Mol Cancer Ther-2011-Sarcar-
Sarcar B et al.,-Mol Cancer Ther-2011-Sarcar-
 
3D culture in phenotypic screening : advantages, process changes and new tech...
3D culture in phenotypic screening : advantages, process changes and new tech...3D culture in phenotypic screening : advantages, process changes and new tech...
3D culture in phenotypic screening : advantages, process changes and new tech...
 
Design study w1526455 finished
Design study w1526455 finishedDesign study w1526455 finished
Design study w1526455 finished
 
CV Jan 2016
CV Jan 2016CV Jan 2016
CV Jan 2016
 
Jcpr 2015-7-4-815-823
Jcpr 2015-7-4-815-823Jcpr 2015-7-4-815-823
Jcpr 2015-7-4-815-823
 
Analysis of Single-Cell Sequencing Data by CLC/Ingenuity: Single Cell Analysi...
Analysis of Single-Cell Sequencing Data by CLC/Ingenuity: Single Cell Analysi...Analysis of Single-Cell Sequencing Data by CLC/Ingenuity: Single Cell Analysi...
Analysis of Single-Cell Sequencing Data by CLC/Ingenuity: Single Cell Analysi...
 
The interaction of QDs with RAW264.7 cells_ nanoparticle quantification, upta...
The interaction of QDs with RAW264.7 cells_ nanoparticle quantification, upta...The interaction of QDs with RAW264.7 cells_ nanoparticle quantification, upta...
The interaction of QDs with RAW264.7 cells_ nanoparticle quantification, upta...
 
3 d biomatrix-white-paper-3d-cell-culture-101
3 d biomatrix-white-paper-3d-cell-culture-1013 d biomatrix-white-paper-3d-cell-culture-101
3 d biomatrix-white-paper-3d-cell-culture-101
 

Viewers also liked

Ege Engin | Automatic Cell Counting Presentation
Ege Engin | Automatic Cell Counting PresentationEge Engin | Automatic Cell Counting Presentation
Ege Engin | Automatic Cell Counting PresentationEge Engin
 
RED BLOOD CELLS EXTRACTION AND COUNTING
RED BLOOD CELLS EXTRACTION AND COUNTINGRED BLOOD CELLS EXTRACTION AND COUNTING
RED BLOOD CELLS EXTRACTION AND COUNTINGRahul Reghunath
 
Hematologic Automation
Hematologic  AutomationHematologic  Automation
Hematologic Automation
Medina College
 
Haemocytometry.
Haemocytometry.Haemocytometry.
Haemocytometry.globalsoin
 
Blood cell counting
Blood cell countingBlood cell counting
Blood cell counting
Shabab Ali
 
Hematology analysor and its working
Hematology analysor and its workingHematology analysor and its working
Hematology analysor and its working
nayab arshad
 
Hemocytometer manual cell counting (1)
Hemocytometer manual cell counting (1)Hemocytometer manual cell counting (1)
Hemocytometer manual cell counting (1)
Shabab Ali
 
Automation in haematology
Automation in haematologyAutomation in haematology
Automation in haematologyraj kumar
 
Automated cell counters
Automated  cell countersAutomated  cell counters
Automated cell countersRicha Sharma
 
How to Make Awesome SlideShares: Tips & Tricks
How to Make Awesome SlideShares: Tips & TricksHow to Make Awesome SlideShares: Tips & Tricks
How to Make Awesome SlideShares: Tips & Tricks
SlideShare
 
Getting Started With SlideShare
Getting Started With SlideShareGetting Started With SlideShare
Getting Started With SlideShare
SlideShare
 

Viewers also liked (13)

Ege Engin | Automatic Cell Counting Presentation
Ege Engin | Automatic Cell Counting PresentationEge Engin | Automatic Cell Counting Presentation
Ege Engin | Automatic Cell Counting Presentation
 
RED BLOOD CELLS EXTRACTION AND COUNTING
RED BLOOD CELLS EXTRACTION AND COUNTINGRED BLOOD CELLS EXTRACTION AND COUNTING
RED BLOOD CELLS EXTRACTION AND COUNTING
 
Hematologic Automation
Hematologic  AutomationHematologic  Automation
Hematologic Automation
 
Haemocytometry.
Haemocytometry.Haemocytometry.
Haemocytometry.
 
Red blood cell count
Red blood cell countRed blood cell count
Red blood cell count
 
Hemocytometer
HemocytometerHemocytometer
Hemocytometer
 
Blood cell counting
Blood cell countingBlood cell counting
Blood cell counting
 
Hematology analysor and its working
Hematology analysor and its workingHematology analysor and its working
Hematology analysor and its working
 
Hemocytometer manual cell counting (1)
Hemocytometer manual cell counting (1)Hemocytometer manual cell counting (1)
Hemocytometer manual cell counting (1)
 
Automation in haematology
Automation in haematologyAutomation in haematology
Automation in haematology
 
Automated cell counters
Automated  cell countersAutomated  cell counters
Automated cell counters
 
How to Make Awesome SlideShares: Tips & Tricks
How to Make Awesome SlideShares: Tips & TricksHow to Make Awesome SlideShares: Tips & Tricks
How to Make Awesome SlideShares: Tips & Tricks
 
Getting Started With SlideShare
Getting Started With SlideShareGetting Started With SlideShare
Getting Started With SlideShare
 

Similar to Analytical chemistry 2013 qian liu

Flow cytometry: Principles and Applications
Flow cytometry: Principles and ApplicationsFlow cytometry: Principles and Applications
Flow cytometry: Principles and Applications
Juhi Arora
 
Rohan gupta 2015 b1ab651p facs
Rohan gupta 2015 b1ab651p   facsRohan gupta 2015 b1ab651p   facs
Rohan gupta 2015 b1ab651p facs
Rohan Gupta
 
Undergraduate Research Conference Poster 2015
Undergraduate Research Conference Poster 2015Undergraduate Research Conference Poster 2015
Undergraduate Research Conference Poster 2015Kendra Liu
 
Content Cytotoxicity Studies of Colorectal Carcinoma Cells Using Printed Impe...
Content Cytotoxicity Studies of Colorectal Carcinoma Cells Using Printed Impe...Content Cytotoxicity Studies of Colorectal Carcinoma Cells Using Printed Impe...
Content Cytotoxicity Studies of Colorectal Carcinoma Cells Using Printed Impe...
journalBEEI
 
Flow cytometry
Flow cytometryFlow cytometry
Flow cytometry
SaniyaTabassum3
 
A statistical framework for multiparameter analysis at the single cell level
A statistical framework for multiparameter analysis at the single cell levelA statistical framework for multiparameter analysis at the single cell level
A statistical framework for multiparameter analysis at the single cell level
Shashaanka Ashili
 
ACES-bulletpoint2
ACES-bulletpoint2ACES-bulletpoint2
ACES-bulletpoint2Sylvia Loh
 
1)patterns of genetic variability in human mitochondria show evidenc.pdf
1)patterns of genetic variability in human mitochondria show evidenc.pdf1)patterns of genetic variability in human mitochondria show evidenc.pdf
1)patterns of genetic variability in human mitochondria show evidenc.pdf
deepakangel
 
clonogenic assay poster-2
clonogenic assay poster-2clonogenic assay poster-2
clonogenic assay poster-2Jaclyn Brown
 
Flow Cytometry- Presentation
Flow Cytometry- PresentationFlow Cytometry- Presentation
Flow Cytometry- Presentation
BIDISHA MANDAL
 
research paper presentation: HYBRID CAPTURE BASED NGS FOR GENOMIC PROFILING ...
research paper presentation: HYBRID CAPTURE BASED NGS  FOR GENOMIC PROFILING ...research paper presentation: HYBRID CAPTURE BASED NGS  FOR GENOMIC PROFILING ...
research paper presentation: HYBRID CAPTURE BASED NGS FOR GENOMIC PROFILING ...
Ikram Ullah
 
Array_nmeth.3507
Array_nmeth.3507Array_nmeth.3507
Array_nmeth.3507Aana Hahn
 
Lab on a chip 2016 qian liu
Lab on a chip 2016 qian liuLab on a chip 2016 qian liu
Lab on a chip 2016 qian liu
Qian Liu, phD
 
IQT Quarterly Winter 2016 - Lim
IQT Quarterly Winter 2016 - LimIQT Quarterly Winter 2016 - Lim
IQT Quarterly Winter 2016 - LimMark David Lim
 
IQT Quarterly Winter 2016 - Lim
IQT Quarterly Winter 2016 - LimIQT Quarterly Winter 2016 - Lim
IQT Quarterly Winter 2016 - LimMark David Lim
 
Molecule Transport across Cell Membranes: Electrochemical Quantification at t...
Molecule Transport across Cell Membranes: Electrochemical Quantification at t...Molecule Transport across Cell Membranes: Electrochemical Quantification at t...
Molecule Transport across Cell Membranes: Electrochemical Quantification at t...
InsideScientific
 

Similar to Analytical chemistry 2013 qian liu (20)

PlOSone paper
PlOSone paperPlOSone paper
PlOSone paper
 
Flow cytometry: Principles and Applications
Flow cytometry: Principles and ApplicationsFlow cytometry: Principles and Applications
Flow cytometry: Principles and Applications
 
Rohan gupta 2015 b1ab651p facs
Rohan gupta 2015 b1ab651p   facsRohan gupta 2015 b1ab651p   facs
Rohan gupta 2015 b1ab651p facs
 
Undergraduate Research Conference Poster 2015
Undergraduate Research Conference Poster 2015Undergraduate Research Conference Poster 2015
Undergraduate Research Conference Poster 2015
 
Content Cytotoxicity Studies of Colorectal Carcinoma Cells Using Printed Impe...
Content Cytotoxicity Studies of Colorectal Carcinoma Cells Using Printed Impe...Content Cytotoxicity Studies of Colorectal Carcinoma Cells Using Printed Impe...
Content Cytotoxicity Studies of Colorectal Carcinoma Cells Using Printed Impe...
 
Plos
PlosPlos
Plos
 
Flow cytometry
Flow cytometryFlow cytometry
Flow cytometry
 
A statistical framework for multiparameter analysis at the single cell level
A statistical framework for multiparameter analysis at the single cell levelA statistical framework for multiparameter analysis at the single cell level
A statistical framework for multiparameter analysis at the single cell level
 
my paper 2015
my paper 2015my paper 2015
my paper 2015
 
ACES-bulletpoint2
ACES-bulletpoint2ACES-bulletpoint2
ACES-bulletpoint2
 
1)patterns of genetic variability in human mitochondria show evidenc.pdf
1)patterns of genetic variability in human mitochondria show evidenc.pdf1)patterns of genetic variability in human mitochondria show evidenc.pdf
1)patterns of genetic variability in human mitochondria show evidenc.pdf
 
clonogenic assay poster-2
clonogenic assay poster-2clonogenic assay poster-2
clonogenic assay poster-2
 
NHRP!
NHRP!NHRP!
NHRP!
 
Flow Cytometry- Presentation
Flow Cytometry- PresentationFlow Cytometry- Presentation
Flow Cytometry- Presentation
 
research paper presentation: HYBRID CAPTURE BASED NGS FOR GENOMIC PROFILING ...
research paper presentation: HYBRID CAPTURE BASED NGS  FOR GENOMIC PROFILING ...research paper presentation: HYBRID CAPTURE BASED NGS  FOR GENOMIC PROFILING ...
research paper presentation: HYBRID CAPTURE BASED NGS FOR GENOMIC PROFILING ...
 
Array_nmeth.3507
Array_nmeth.3507Array_nmeth.3507
Array_nmeth.3507
 
Lab on a chip 2016 qian liu
Lab on a chip 2016 qian liuLab on a chip 2016 qian liu
Lab on a chip 2016 qian liu
 
IQT Quarterly Winter 2016 - Lim
IQT Quarterly Winter 2016 - LimIQT Quarterly Winter 2016 - Lim
IQT Quarterly Winter 2016 - Lim
 
IQT Quarterly Winter 2016 - Lim
IQT Quarterly Winter 2016 - LimIQT Quarterly Winter 2016 - Lim
IQT Quarterly Winter 2016 - Lim
 
Molecule Transport across Cell Membranes: Electrochemical Quantification at t...
Molecule Transport across Cell Membranes: Electrochemical Quantification at t...Molecule Transport across Cell Membranes: Electrochemical Quantification at t...
Molecule Transport across Cell Membranes: Electrochemical Quantification at t...
 

Recently uploaded

一比一原版(CBU毕业证)卡普顿大学毕业证如何办理
一比一原版(CBU毕业证)卡普顿大学毕业证如何办理一比一原版(CBU毕业证)卡普顿大学毕业证如何办理
一比一原版(CBU毕业证)卡普顿大学毕业证如何办理
ahzuo
 
一比一原版(Deakin毕业证书)迪肯大学毕业证如何办理
一比一原版(Deakin毕业证书)迪肯大学毕业证如何办理一比一原版(Deakin毕业证书)迪肯大学毕业证如何办理
一比一原版(Deakin毕业证书)迪肯大学毕业证如何办理
oz8q3jxlp
 
原版制作(Deakin毕业证书)迪肯大学毕业证学位证一模一样
原版制作(Deakin毕业证书)迪肯大学毕业证学位证一模一样原版制作(Deakin毕业证书)迪肯大学毕业证学位证一模一样
原版制作(Deakin毕业证书)迪肯大学毕业证学位证一模一样
u86oixdj
 
一比一原版(UniSA毕业证书)南澳大学毕业证如何办理
一比一原版(UniSA毕业证书)南澳大学毕业证如何办理一比一原版(UniSA毕业证书)南澳大学毕业证如何办理
一比一原版(UniSA毕业证书)南澳大学毕业证如何办理
slg6lamcq
 
一比一原版(QU毕业证)皇后大学毕业证成绩单
一比一原版(QU毕业证)皇后大学毕业证成绩单一比一原版(QU毕业证)皇后大学毕业证成绩单
一比一原版(QU毕业证)皇后大学毕业证成绩单
enxupq
 
Empowering Data Analytics Ecosystem.pptx
Empowering Data Analytics Ecosystem.pptxEmpowering Data Analytics Ecosystem.pptx
Empowering Data Analytics Ecosystem.pptx
benishzehra469
 
Levelwise PageRank with Loop-Based Dead End Handling Strategy : SHORT REPORT ...
Levelwise PageRank with Loop-Based Dead End Handling Strategy : SHORT REPORT ...Levelwise PageRank with Loop-Based Dead End Handling Strategy : SHORT REPORT ...
Levelwise PageRank with Loop-Based Dead End Handling Strategy : SHORT REPORT ...
Subhajit Sahu
 
一比一原版(CBU毕业证)卡普顿大学毕业证成绩单
一比一原版(CBU毕业证)卡普顿大学毕业证成绩单一比一原版(CBU毕业证)卡普顿大学毕业证成绩单
一比一原版(CBU毕业证)卡普顿大学毕业证成绩单
nscud
 
一比一原版(UIUC毕业证)伊利诺伊大学|厄巴纳-香槟分校毕业证如何办理
一比一原版(UIUC毕业证)伊利诺伊大学|厄巴纳-香槟分校毕业证如何办理一比一原版(UIUC毕业证)伊利诺伊大学|厄巴纳-香槟分校毕业证如何办理
一比一原版(UIUC毕业证)伊利诺伊大学|厄巴纳-香槟分校毕业证如何办理
ahzuo
 
一比一原版(BU毕业证)波士顿大学毕业证成绩单
一比一原版(BU毕业证)波士顿大学毕业证成绩单一比一原版(BU毕业证)波士顿大学毕业证成绩单
一比一原版(BU毕业证)波士顿大学毕业证成绩单
ewymefz
 
一比一原版(NYU毕业证)纽约大学毕业证成绩单
一比一原版(NYU毕业证)纽约大学毕业证成绩单一比一原版(NYU毕业证)纽约大学毕业证成绩单
一比一原版(NYU毕业证)纽约大学毕业证成绩单
ewymefz
 
Criminal IP - Threat Hunting Webinar.pdf
Criminal IP - Threat Hunting Webinar.pdfCriminal IP - Threat Hunting Webinar.pdf
Criminal IP - Threat Hunting Webinar.pdf
Criminal IP
 
Algorithmic optimizations for Dynamic Levelwise PageRank (from STICD) : SHORT...
Algorithmic optimizations for Dynamic Levelwise PageRank (from STICD) : SHORT...Algorithmic optimizations for Dynamic Levelwise PageRank (from STICD) : SHORT...
Algorithmic optimizations for Dynamic Levelwise PageRank (from STICD) : SHORT...
Subhajit Sahu
 
一比一原版(YU毕业证)约克大学毕业证成绩单
一比一原版(YU毕业证)约克大学毕业证成绩单一比一原版(YU毕业证)约克大学毕业证成绩单
一比一原版(YU毕业证)约克大学毕业证成绩单
enxupq
 
一比一原版(CBU毕业证)不列颠海角大学毕业证成绩单
一比一原版(CBU毕业证)不列颠海角大学毕业证成绩单一比一原版(CBU毕业证)不列颠海角大学毕业证成绩单
一比一原版(CBU毕业证)不列颠海角大学毕业证成绩单
nscud
 
The affect of service quality and online reviews on customer loyalty in the E...
The affect of service quality and online reviews on customer loyalty in the E...The affect of service quality and online reviews on customer loyalty in the E...
The affect of service quality and online reviews on customer loyalty in the E...
jerlynmaetalle
 
FP Growth Algorithm and its Applications
FP Growth Algorithm and its ApplicationsFP Growth Algorithm and its Applications
FP Growth Algorithm and its Applications
MaleehaSheikh2
 
社内勉強会資料_LLM Agents                              .
社内勉強会資料_LLM Agents                              .社内勉強会資料_LLM Agents                              .
社内勉強会資料_LLM Agents                              .
NABLAS株式会社
 
一比一原版(Bradford毕业证书)布拉德福德大学毕业证如何办理
一比一原版(Bradford毕业证书)布拉德福德大学毕业证如何办理一比一原版(Bradford毕业证书)布拉德福德大学毕业证如何办理
一比一原版(Bradford毕业证书)布拉德福德大学毕业证如何办理
mbawufebxi
 
Adjusting primitives for graph : SHORT REPORT / NOTES
Adjusting primitives for graph : SHORT REPORT / NOTESAdjusting primitives for graph : SHORT REPORT / NOTES
Adjusting primitives for graph : SHORT REPORT / NOTES
Subhajit Sahu
 

Recently uploaded (20)

一比一原版(CBU毕业证)卡普顿大学毕业证如何办理
一比一原版(CBU毕业证)卡普顿大学毕业证如何办理一比一原版(CBU毕业证)卡普顿大学毕业证如何办理
一比一原版(CBU毕业证)卡普顿大学毕业证如何办理
 
一比一原版(Deakin毕业证书)迪肯大学毕业证如何办理
一比一原版(Deakin毕业证书)迪肯大学毕业证如何办理一比一原版(Deakin毕业证书)迪肯大学毕业证如何办理
一比一原版(Deakin毕业证书)迪肯大学毕业证如何办理
 
原版制作(Deakin毕业证书)迪肯大学毕业证学位证一模一样
原版制作(Deakin毕业证书)迪肯大学毕业证学位证一模一样原版制作(Deakin毕业证书)迪肯大学毕业证学位证一模一样
原版制作(Deakin毕业证书)迪肯大学毕业证学位证一模一样
 
一比一原版(UniSA毕业证书)南澳大学毕业证如何办理
一比一原版(UniSA毕业证书)南澳大学毕业证如何办理一比一原版(UniSA毕业证书)南澳大学毕业证如何办理
一比一原版(UniSA毕业证书)南澳大学毕业证如何办理
 
一比一原版(QU毕业证)皇后大学毕业证成绩单
一比一原版(QU毕业证)皇后大学毕业证成绩单一比一原版(QU毕业证)皇后大学毕业证成绩单
一比一原版(QU毕业证)皇后大学毕业证成绩单
 
Empowering Data Analytics Ecosystem.pptx
Empowering Data Analytics Ecosystem.pptxEmpowering Data Analytics Ecosystem.pptx
Empowering Data Analytics Ecosystem.pptx
 
Levelwise PageRank with Loop-Based Dead End Handling Strategy : SHORT REPORT ...
Levelwise PageRank with Loop-Based Dead End Handling Strategy : SHORT REPORT ...Levelwise PageRank with Loop-Based Dead End Handling Strategy : SHORT REPORT ...
Levelwise PageRank with Loop-Based Dead End Handling Strategy : SHORT REPORT ...
 
一比一原版(CBU毕业证)卡普顿大学毕业证成绩单
一比一原版(CBU毕业证)卡普顿大学毕业证成绩单一比一原版(CBU毕业证)卡普顿大学毕业证成绩单
一比一原版(CBU毕业证)卡普顿大学毕业证成绩单
 
一比一原版(UIUC毕业证)伊利诺伊大学|厄巴纳-香槟分校毕业证如何办理
一比一原版(UIUC毕业证)伊利诺伊大学|厄巴纳-香槟分校毕业证如何办理一比一原版(UIUC毕业证)伊利诺伊大学|厄巴纳-香槟分校毕业证如何办理
一比一原版(UIUC毕业证)伊利诺伊大学|厄巴纳-香槟分校毕业证如何办理
 
一比一原版(BU毕业证)波士顿大学毕业证成绩单
一比一原版(BU毕业证)波士顿大学毕业证成绩单一比一原版(BU毕业证)波士顿大学毕业证成绩单
一比一原版(BU毕业证)波士顿大学毕业证成绩单
 
一比一原版(NYU毕业证)纽约大学毕业证成绩单
一比一原版(NYU毕业证)纽约大学毕业证成绩单一比一原版(NYU毕业证)纽约大学毕业证成绩单
一比一原版(NYU毕业证)纽约大学毕业证成绩单
 
Criminal IP - Threat Hunting Webinar.pdf
Criminal IP - Threat Hunting Webinar.pdfCriminal IP - Threat Hunting Webinar.pdf
Criminal IP - Threat Hunting Webinar.pdf
 
Algorithmic optimizations for Dynamic Levelwise PageRank (from STICD) : SHORT...
Algorithmic optimizations for Dynamic Levelwise PageRank (from STICD) : SHORT...Algorithmic optimizations for Dynamic Levelwise PageRank (from STICD) : SHORT...
Algorithmic optimizations for Dynamic Levelwise PageRank (from STICD) : SHORT...
 
一比一原版(YU毕业证)约克大学毕业证成绩单
一比一原版(YU毕业证)约克大学毕业证成绩单一比一原版(YU毕业证)约克大学毕业证成绩单
一比一原版(YU毕业证)约克大学毕业证成绩单
 
一比一原版(CBU毕业证)不列颠海角大学毕业证成绩单
一比一原版(CBU毕业证)不列颠海角大学毕业证成绩单一比一原版(CBU毕业证)不列颠海角大学毕业证成绩单
一比一原版(CBU毕业证)不列颠海角大学毕业证成绩单
 
The affect of service quality and online reviews on customer loyalty in the E...
The affect of service quality and online reviews on customer loyalty in the E...The affect of service quality and online reviews on customer loyalty in the E...
The affect of service quality and online reviews on customer loyalty in the E...
 
FP Growth Algorithm and its Applications
FP Growth Algorithm and its ApplicationsFP Growth Algorithm and its Applications
FP Growth Algorithm and its Applications
 
社内勉強会資料_LLM Agents                              .
社内勉強会資料_LLM Agents                              .社内勉強会資料_LLM Agents                              .
社内勉強会資料_LLM Agents                              .
 
一比一原版(Bradford毕业证书)布拉德福德大学毕业证如何办理
一比一原版(Bradford毕业证书)布拉德福德大学毕业证如何办理一比一原版(Bradford毕业证书)布拉德福德大学毕业证如何办理
一比一原版(Bradford毕业证书)布拉德福德大学毕业证如何办理
 
Adjusting primitives for graph : SHORT REPORT / NOTES
Adjusting primitives for graph : SHORT REPORT / NOTESAdjusting primitives for graph : SHORT REPORT / NOTES
Adjusting primitives for graph : SHORT REPORT / NOTES
 

Analytical chemistry 2013 qian liu

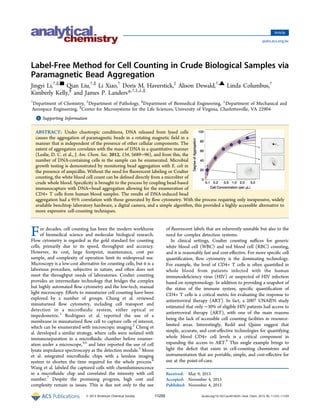
  • 1. Label-Free Method for Cell Counting in Crude Biological Samples via Paramagnetic Bead Aggregation Jingyi Li,†,∥,■ Qian Liu,†,∥ Li Xiao,† Doris M. Haverstick,‡ Alison Dewald,†,▲ Linda Columbus,† Kimberly Kelly,§ and James P. Landers*,†,‡,⊥,∥ † Department of Chemistry, ‡ Department of Pathology, § Department of Biomedical Engineering, ⊥ Department of Mechanical and Aerospace Engineering, ∥ Center for Microsystems for the Life Sciences, University of Virginia, Charlottesville, VA 22904 *S Supporting Information ABSTRACT: Under chaotropic conditions, DNA released from lysed cells causes the aggregation of paramagnetic beads in a rotating magnetic field in a manner that is independent of the presence of other cellular components. The extent of aggregation correlates with the mass of DNA in a quantitative manner (Leslie, D. C. et al., J. Am. Chem. Soc. 2012, 134, 5689−96), and from this, the number of DNA-containing cells in the sample can be enumerated. Microbial growth testing is demonstrated by monitoring bead aggregation with E. coli in the presence of ampicillin. Without the need for fluorescent labeling or Coulter counting, the white blood cell count can be defined directly from a microliter of crude whole blood. Specificity is brought to the process by coupling bead-based immunocapture with DNA−bead aggregation allowing for the enumeration of CD4+ T cells from human blood samples. The results of DNA-induced bead aggregation had a 95% correlation with those generated by flow cytometry. With the process requiring only inexpensive, widely available benchtop laboratory hardware, a digital camera, and a simple algorithm, this provided a highly accessible alternative to more expensive cell-counting techniques. For decades, cell counting has been the modern workhorse of biomedical science and molecular biological research. Flow cytometry is regarded as the gold standard for counting cells, primarily due to its speed, throughput and accuracy. However, its cost, large footprint, maintenance, cost per sample, and complexity of operation limit its widespread use. Microscopy is a low-cost alternative for counting cells, but it is a laborious procedure, subjective in nature, and often does not meet the throughput needs of laboratories. Coulter counting provides an intermediate technology that bridges the complex but highly automated flow cytometry and the low-tech, manual light microscopy. Efforts to miniaturize cell counting have been explored by a number of groups. Chung et al. reviewed miniaturized flow cytometry, including cell transport and detection in a microfluidic system, either optical or impedometric.1 Rodriguez et al. reported the use of a membrane in miniaturized flow cell to capture cells of interest, which can be enumerated with microscopic imaging.2 Cheng et al. developed a similar strategy, where cells were isolated with immunoseparation in a microfluidic chamber before enumer- ation under a microscope,3,4 and later reported the use of cell lysate impedance spectroscopy as the detection module.5 Moon et al. integrated microfluidic chips with a lensless imaging system to shorten the time required for the whole process.6 Wang et al. labeled the captured cells with chemiluminescence in a microfluidic chip and correlated the intensity with cell number.7 Despite the promising progress, high cost and complexity remain as issues. This is due not only to the use of fluorescent labels that are inherently unstable but also to the need for complex detection systems. In clinical settings, Coulter counting suffices for generic white blood cell (WBC) and red blood cell (RBC) counting, and it is reasonably fast and cost-effective. For more specific cell quantification, flow cytometry is the dominating technology. For example, the level of CD4+ T cells is often quantified in whole blood from patients infected with the human immunodeficiency virus (HIV) or suspected of HIV infection based on symptomology. In addition to providing a snapshot of the status of the immune system, specific quantification of CD4+ T cells is a critical metric for evaluating the response to antiretroviral therapy (ART). In fact, a 2007 UNAIDS study estimated that only ∼30% of eligible HIV patients had access to antiretroviral therapy (ART), with one of the main reasons being the lack of accessible cell counting facilities in resource- limited areas. Interestingly, Redd and Quinn suggest that simple, accurate, and cost-effective technologies for quantifying whole blood CD4+ cell levels is a critical component in expanding the access to ART.8 This single example brings to light the deficit that exists in cell-counting chemistries and instrumentation that are portable, simple, and cost-effective for use at the point-of-care. Received: May 9, 2013 Accepted: November 4, 2013 Published: November 4, 2013 Article pubs.acs.org/ac © 2013 American Chemical Society 11233 dx.doi.org/10.1021/ac401402h | Anal. Chem. 2013, 85, 11233−11239
  • 2. Paramagnetic beads have been extensively studied for their unique magnetic properties9 and application to a wide array of bioanalytical processes; these include immunoseparation,10 transportation,11 mixing,12 and the detection13,14 of select analytes of interest. Recently, we reported the “pinwheel effect”,8 which describes chaotropic-driven adsorption of DNA onto paramagnetic silica beads in a quantitative manner. Captured images of the induced bead−DNA aggregates followed by image analysis (using a simple algorithm) allows for direct quantification of DNA in crude biological samples. The simplicity of the chemistry (guanidine + beads + sample), the instrumentation (magnetic field + digital camera), and the method (pipet + magnetize + capture image) make this a cost- effective, low-tech method for quantifying DNA in microliter samples with a picogram limit of detection. We showed preliminary evidence for the potential to count WBCs in whole blood, and this spawned a more in-depth exploration of the capabilities of the pinwheel effect for cell counting. In this report, we show that the same assay can be used to monitor the growth of cultured cells using only a few microliters of sample. We also demonstrate that leukocytes can be directly enumerated in whole blood without labeling or purification with an accuracy and precision that compares favorably with Coulter counting. Finally, we make quantifica- tion cell-specific by coupling pinwheel with immunomagnetic cell capture, demonstrating that CD4+ T cells can be enumerated with sufficient sensitivity and accuracy to monitor HIV/AIDS patients. As such, the pinwheel assay represents a new, label-free method for cell counting where the simple protocol and cost-effective instrumentation provides a highly accessible alternative to more expensive counting techniques. ■ METHODS AND MATERIALS Reagents. MagneSil paramagnetic particles were purchased from Promega (Madison, WI). GdnHCl was bought from MP Biomedicals (Solon, OH). MES was bought from Acros Organics. Tris base was bought from Fisher Scientific. EDTA was bought from Sigma-Aldrich. Human SH-SY5Y cells and mouse RAW 264.7 cells were obtained from ATCC. E. coli BL21(DE3) and D29 bacteriophage were obtained from New England Biolabs (Ipswich, MA). Whole blood samples were donated by consenting donors. CD4 isolation kit was bought from Life Technologies. All solutions were prepared in Nanopure water (Barnstead/Thermolyne, Dubuque, IA). Reagent Preparation. Thirty microliters of stock Magnesil beads was washed once with deionized, distilled water (Nanopure) followed by one wash with GdnHCl solution (8 M, 1× TE, adjusted to pH 6.1 with 100 mM MES) and resuspended in 1 mL of GdnHCl solution to make the suspension. Microwell Fabrication, Assay Instrumentation, and Magnetic Field Application. Details have been described previously. The system, with a rotating magnetic field (RMF), of the pinwheel assay for DNA quantification was employed for cell counting without any modifications.15 Image Processing. A gray level threshold was set in the images of magnetic beads and aggregates by an isodata algorithm written in Mathematica software, which identifies the pixels representing the beads and aggregates. The total number of these pixels in the photograph without DNA is defined as 100%, and as more DNA molecules are released from cells, tighter aggregation evolves, corresponding to a smaller percentage. The change of the percentage is defined as degree of aggregation (DA). More DNA molecules result in tighter bead aggregation and higher DA values. Establishment of Calibration Curves. Samples were first incubated with GdnHCl solution in 1:100 volume ratio at room temperature for 30 min. The samples were then serially diluted in GdnHCl solution to appropriate concentrations as shown in the figures. Five microliters of diluted sample, 3 μL of bead suspension, and 12 μL of GdnHCl were mixed and exposed to the RMF for 5 min, after which three photographs of the beads and aggregates were acquired for image analysis. The calibration curve was generated by correlating the mean DA value of three images for each diluted sample with the corresponding final cell concentration in the pinwheel assay. Microbial Growth Testing. E. coli strain BL21(DE3) was cultured in 1000 mL of liquid LB medium and incubated at 37 °C. Samples (1 mL) were collected at hour intervals for 5 h. The culture was split into two equal volumes at t = 3 h, and one volume was treated with 0.1 mg/mL ampicillin. Cell counting based on absorbance measurements at 600 nm was obtained with a UV/Visible spectrophotomer (Beckman Coulter, DU800) in a 1 mL plastic cuvette at room temperature. White Blood Cell Counting for Unknown Samples. Raw blood samples were first incubated with GdnHCl solution in 1:100 volume ratio at room temperature for 30 min. The samples were diluted by 2000 fold. Five μL of diluted sample, 3 μL of bead suspension, and 12 μL of GdnHCl were mixed and exposed to the RMF for 5 min, after which photographs of the beads and aggregates were acquired for image analysis. Considering mixing sample and beads results in another 4- fold dilution, the samples were diluted by 8000 fold from raw blood to the pinwheel assay. The concentration of white blood cells in blood was acquired by comparing DA value with the calibration curve (Figure 4). For the samples with WBC count lower than 4 × 10³ per μL, a final 4000-fold dilution was performed in the pinwheel assay, and more accurate results were acquired because of an optimized dynamic range. Immunomagnetic Separation of CD4+ T Cells from Blood. CD4+ T cells were isolated by a Dynal T4 Quant kit following its protocols. Briefly, whole blood was incubated and rotated with CD14-coated beads for 10 min, followed by another 10 min incubation and rotation with CD4-coated beads. Samples were then washed three times with PBS buffer. Enumeration of CD4+ T Cells with Hemocytometer. Isolated CD4+ T cells were lysed by the lysis solution provided in the Dynal T4 Quant kit. The lysed cells were stained with Sternheimer−Malbin solution and loaded on a hemocytometer, and the nuclei were counted using a conventional white light microscope. Enumeration of CD4+ T Cells with the Pinwheel Assay. After immunomagnetic separation, the isolated CD4+ T cells were incubated in 100 μL of 8 M GdnHCl solutions for 30 min, and the solution was further diluted 20, 40, 80, and 160-fold with 8 M GdnHCl. These four aliquots were then loaded into the pinwheel microwell following the same procedure as white blood cell counting. ■ RESULTS AND DISCUSSION Paramagnetic Bead Aggregation Enables Cell Enu- meration. With the pinwheel effect, DNA adsorbs to silica- coated paramagnetic beads under chaotropic conditions, and driven by a rotating magnetic field (RMF), the beads are intertwined by DNA and rapidly aggregate (in seconds to minutes) (Figure 1A). The degree of aggregation correlates Analytical Chemistry Article dx.doi.org/10.1021/ac401402h | Anal. Chem. 2013, 85, 11233−1123911234
  • 3. well with the concentration of DNA, allowing for fast DNA quantification without the need of fluorescent labels.15 Owing to the specificity of the chaotrope-driven DNA adsorption on silica,16 bead aggregation induced by DNA released from the cell lysate is unaffected by protein, lipid, and other cellular components present at concentrations orders of magnitude higher; this is the case for even a few cells (Figure 1B). Given that each DNA-containing cell in a blood sample releases the same mass of DNA (6.25 pg), the extent of bead aggregation defines the number of cells in the sample. Figure 1 panels B2− B4 show images of beads that have been aggregated by 13, 52, and 195 pg of DNA, respectively. While the protein released from 30 cells is ∼15 ng, it is noteworthy that augmenting the solution with additional protein (BSA; to a final concentration of 1 μg/μL) does not adversely affect aggregation.17 An inherent advantage of the chemistry that induces the pinwheel effect (i.e., guanidine) is that it also lyses cells effectively; thus, no additional reagents are required for direct cell counting. A cell solution added to 8 M GdnHCl at a 1:100 volume ratio induces bead aggregation immediately following vortexing, which is key to the pinwheel assay enabling the enumeration of cells. The rapidity with which cell lysis occurs is supported by the fact that aggregate formation (visually detectable aggregates in seconds) does not improve with longer incubation times (e.g., up to 60 min) (see Supporting Information Figure S1). This yields a simple protocol for cell enumeration: (a) lyse cells in 8 M GdnHCl to release DNA, (b) bring the sample DNA concentration within the dynamic range of the assay through sample dilution, (c) mix the sample with silica-coated magnetic beads in a RMF to induce aggregation, (d) capture digital images and process the images through an algorithm to generate a % DA and, finally, (e) compare resultant value to a standard curve to calculate cell concentration (details are provided in the experimental section). As DNA begins to entangle with the beads,15 small bead aggregates evolve from the initial dispersed state, growing through nucleation with other beads, allowing smaller aggregates to coalesce into larger ones. The higher the DNA concentration, the more aggressive the aggregate formation and subsequent coalescing become. Overall, the beads experience a transition from the dispersed state in the negative control (i.e., without DNA) to a condensed aggregation state with sufficient DNA. Even with only a few cells, aggregation induced by released DNA leads to a decrease of the total number of pixels representing the beads and/or bead aggregates; this we refer to as dark area.15 A threshold is set by an isodata algorithm15 to separate the beads and/or aggregates from image background, shown as the black line in the histogram (Figure 1C). The peak area below the threshold stands for the dark area, and the decrease of dark area represents the loss of dispersed beads due to aggregation. Therefore, we define the decrease of dark area that is normalized against the negative control as DA. Correlating DNA concentration and DA generates a calibration curve for DNA quantification. With each somatic cell containing 6.25 pg DNA (discussed earlier), a simple calculation allows for plotting DA against the number of cells in a particular volume (typically 1 μL). Regardless of the source of DNA, the higher the DNA concentration, the larger the DA. This provides a quantitative correlation between the extent of aggregation and the number of cells in a specific volume of sample, for example, as in Figure 2. Pinwheel assay standard curves for the enumeration of: (a) eukaryotic cells (human WBCs and mouse cells), (b) prokaryotic cells (E. coli), and (c) bacteriophage (D29) are given in Figure 2. While not a “cell”, phage are virus-like macromolecular assemblies of protein and nucleic acid, with an intact genome of length of 49 × 103 base pairs. The DNA extracted from this phage is double-stranded, and with a 49 kbp length, a rough estimate of the length is ∼16 μm.18 As shown in Figure 2, it is still capable of inducing aggregates, but it does so with an effectiveness that is roughly an order of magnitude less than E. coli, whose genome is 4.6 Mb. There is a 3 order of Figure 1. Schematic of the pinwheel effect induced by lysed cells. (A) GdnHCl lyses the cells and drives the released DNA to adsorb on to silica- coated paramagnetic beads, which form aggregates in a rotating magnetic field (RMF). Images of the aggregation are digitized, from which the initial concentration of cells can be measured. (B) Photographs of the same amount of beads with different amounts of DNA that are equivalent to 0, 2, 8, and 32 cells, respectively. Magnetic beads, which remain dispersed in RMF, form visually detectable aggregates within minutes upon mixture with lysed human cells. (C) Gray level histogram of the four photographs. Three regions are identified as aggregates, dispersed beads, and background, respectively, on the basis of the gray level value. The change of the histogram clearly illustrates the loss of dispersed beads and the formation of aggregates. Analytical Chemistry Article dx.doi.org/10.1021/ac401402h | Anal. Chem. 2013, 85, 11233−1123911235
  • 4. magnitude differential in the size of the E. coli DNA versus mouse or human DNA. As the curve in Figure 2 (a semilog plot) shifts from left to right, the sensitivity decreases over 3 orders of magnitude; not surprisingly, this roughly correlates with the decrease in genome size with each cell type. For human cells, ∼8 cells in 20 μL corresponds to 0.4 cells/μL and a DNA concentration of 2.5 pg/μL. Despite this miniscule mass, the induced aggregation is still visually detectable (Figure 1B), with the limit of detection (through image analysis) approaching 0.1 cell/μL, that is, 2 cells in a total of 20 μL (Figure 2). The concept that sensitivity is proportional to DNA length is consistent with our previous observations15 and is rationalized as longer strands of DNA induce bead aggregation more effectively than shorter ones. As a result, each cell type should be calibrated individually in order to acquire accurate results. To further study the size dependence, the actual DNA size distribution should be measured by other techniques such as electrophoresis and correlated more quantitatively with the sensitivity of the pinwheel assay. Microbial Growth Testing with the Pinwheel Assay. Accurate and quick determination of bacteria concentration is essential in microbiology studies. To test the effectiveness of measuring microbial growth with the pinwheel assay, E. coli was cultured in media, and the time evolution of growth was monitored by two methods: light scattering (spectrophotom- etry at 600 nm) and the pinwheel assay. From the liquid culture, 1 mL was sampled every hour, and after 3 h, the cells were split, where half were dosed with buffer and the other half with ampicillin (0.1 mg/mL). Monitoring the bacterial growth conventionally by absorbance at 600 nm (Figure 3A), bacterial cell doubling is apparent (from a 1 mL sample) by the increase of cell number up to the 3 h point. However, addition of ampicillin retards E. coli growth, and not only levels the growth curve (i.e., no further doubling), but the addition of ampicillin actually leads to a reduction in the bacterial concentration.19 Similar evaluation was carried out by pipetting 5 μL aliquots from the growth medium into microwells containing GdnHCl and paramagnetic beads. As given in Figure 3B, the results acquired from the pinwheel assay also illustrate a comparable trend of bacterial growth. For the sake of simplicity, DA is directly compared to illustrate the change of cell concentration. Because DA does not increase linearly with cell count (Figure 2), the difference of DA between “with ampicillin” and “without ampicillin” does not appear to be as substantial as that of the absorbance measurement. A closer match between the absorbance measurement and the pinwheel assay can be obtained by converting the signals in both methods to cell counts. Enumeration of White Blood Cells in Whole Blood. WBCs (leukocytes) are critical components in our defense against foreign bodies and infectious agents. The white blood cell count can be a generic indicator of immune system status and is useful for clinical testing, in particular with molecular diagnostics. The pinwheel assay has the potential to provide a simple and rapid method for determining of WBC count. To generate the calibration curve for WBC counting, blood samples were drawn from four normal patients on the day of the analysis, and the WBC counts were determined by Coulter counter. The samples were lysed with 8 M GdnHCl and serially diluted for pinwheel analysis. Figure 4 illustrates the correlation between degree of aggregation and WBC count after dilution. Curves derived from 4.1, 10.1, and 20.3 (× 103 WBCs/μL predilution) samples overlap well with each other. The 2.3 × 10³ WBCs/μL sample, however, reproducibly yields a higher Figure 2. Calibration curve of the pinwheel assay for cell counting. DA is correlated with cell (or phage) concentration and fitted into an exponential model. The sensitivity decreases from human and mouse cells (eukaryote) to phage D29 (although not a cell), which can be attributed to the decrease of DNA length and genome size. The x-axis is plotted in log scale in order to illustrate the difference of calibration curves between human and mouse cells, which have similar genome sizes. The solid line represents an exponential calibration function fitted to the data at logarithmic scale; the shaded area and gray lines show the 95% and 99% confidence bands (the same for all curve fitting, unless otherwise noted). Figure 3. Microbial growth testing of E. coli in the presence of ampicillin. At the 3 h mark, half the cells were dosed with buffer, while the other half were dosed with ampicillin, as growth monitoring continued. Figure 4. Calibration curve of the pinwheel assay for WBC counting directly in raw blood samples. Four blood samples, with their WBC counts determined with Coulter counter, were analyzed with the pinwheel assay, as represented by ▽ = 2.3, Δ = 4.1, □ = 10.1, and • = 20.3 (× 103 per μL) with associated error bar denoting the standard deviation of three experiments on each sample. The symbol • and the corresponding error bar denote the mean and standard deviation of the four samples. Analytical Chemistry Article dx.doi.org/10.1021/ac401402h | Anal. Chem. 2013, 85, 11233−1123911236
  • 5. DA at the same [WBC]; this is because it falls outside the dynamic range of the assay and, thus, results in a larger standard deviation for the mean values above 40% DA. This may be caused by components in the blood other than WBCs (e.g., proteins such as albumin, or a combination of protein and divalent cations like Ca2+ ), of which the concentration remains relatively high after dilution due to the low initial WBC concentration and low dilution factor. Elucidation of the mechanism is currently ongoing and will be the topic of a separate report when completed. As a result, only the region above a DA of 60% is regarded as the effective calibration range for WBC quantification. Therefore, DA values in that range (>60%) must be obtained for accurate cell counting. To evaluate the ability of the pinwheel process to enumerate the WBCs in unknown samples, dilution is needed so that the DA falls in the effective calibration range. By comparing the measured value with the calibration curve, the WBC count can be estimated following dilution ([WBC]dil), which is then converted to the initial WBC count ([WBC]init) by multiplying by the dilution factor. Given that the calibration curve covers from 0.5 to 5 WBCs/μL, a 4000-fold dilution enables quantification of blood samples with WBC count between 2000 and 20 000 per μL. Since the WBC count of adults typically varies between 4000 and 11 000 per μL, a 4000-fold or 8000-fold dilution would be sufficient to cover the normal range and to identify samples with abnormal WBC count. To test accuracy of the pinwheel-derived WBC counting, nine raw blood samples with unknown WBC counts were acquired, lysed, and diluted appropriately. Three replicates were performed on each sample, and the mean DA was compared to the standard curve to determine initial WBC count. These values were compared to those independently obtained by a Coulter counter, and the results are given in Figure 5A. The counts from both compare favorably for the samples with [WBC]init ranging from 2 × 10³ per μL to 14 × 103 per μL; this covers the normal range for WBC count and suffices for samples where there is a need to identify counts outside the normal range (bracketed by the two dashed lines). Figure 5B provides graphical representation of the excellent correlation between the pinwheel results and those from Coulter counter (R2 = 0.97). Counting CD4+ T Cells with the Pinwheel Assay. While effective for WBC counting, the pinwheel effect is generic because the adsorption of DNA on silica is not specific to genomic sequence; hence, subtyping of cells in a complex mixture is not possible without invoking the use of a “selective” step. We chose CD4+ T cells, a WBC subtype, as a model to demonstrate that selectivity and pinwheel sensitivity could be coupled in a powerful way. CD4+ T-cell levels are critical in Figure 5. WBC counts of nine raw blood samples determined by the pinwheel assay are shown in (A) and compared with the results from Coulter counter. (B) The WBC counts of the nine samples determined with the pinwheel assay correlate well with the results from Coulter counter. The data points represent the mean results of three experiments on each sample, and the error bars denote the standard deviation. The solid blue line represents a linear calibration function fitted to the data with R2 = 0.97, and the black dashed line shows y = x. Figure 6. Immunomagnetic separation of CD4+ T cells from blood and the calibration curve for quantification. (A) Schematic of immunomagnetic separation of CD4+ T cells from crude blood samples. Monocytes, which also express the CD4 antigen, are depleted prior to CD4+ T cells. (B) Purified samples are serially diluted after lysis, and the calibration curve is established by correlating degree of aggregation with the CD4 count determined by microscopy. Analytical Chemistry Article dx.doi.org/10.1021/ac401402h | Anal. Chem. 2013, 85, 11233−1123911237
  • 6. assessing the progress of AIDS and also in monitoring anti-HIV treatment. CD4+ T-cell quantitation is currently accomplished using flow cytometry, where the obvious drawbacks are high cost, high maintenance, and poor portability. A rapid, substantially less expensive and less complex methodology for CD4+ T-cell counting could be valuable, especially if point-of- care applications are to be considered. One solution to this involves a commercial immunomagnetic separation kit. This kit exploits antiCD4+-coated magnetic beads for isolating CD4+ T cells from blood, but also captures monocytes (they express CD4). However, monocytes also express CD14 on their surface,4 allowing for antiCD14-coated beads to deplete the sample of monoctyes, prior to the capture of CD4+ T cells (Figure 6A). In the protocol described by the manufacturer, the captured CD4+ T cells are partially lysed so that their nuclei can be released and enumerated with a hemocytometer under a microscope after staining. While labor-intensive and, in some ways, subjective, immunocapture with microscope-based counting certainly provides a cost-effective alternative to flow cytometry. Studies of normal and HIV-positive individuals have shown a correlation coefficient of 0.97 for CD4+ cell levels relative to values from hemacytometer. To circumvent the microscopic counting of stained cells, we substituted this step with the pinwheel assay. With the pinwheel process, the isolated cells are completely lysed, and pinwheel aggregation is induced by the released DNA, allowing for quantification of cells. The correlation between DA and cell concentration is illustrated in Figure 6B, which provides the calibration curve to determine the CD4+ T-cell count in blood samples. Since the enumeration of CD4+ T cells involves preassay isolation of the cells, the effectiveness of this process relies on the efficient and consistent CD4+ T-cell isolation. The mean isolation yield that was observed (calculated by dividing the microscopic cell count with the flow cytometry count of the original sample) was found to be 91.5 ± 4.3% for four blood samples when the blood samples were withdrawn within 24 h. To evaluate the accuracy of the pinwheel assay, two aliquots of purified cells were acquired from each unknown sample, with one partially lysed for microscopy quantification and the other completely lysed for the pinwheel assay. Comparison shows a good correlation between the two methods with 13 patient blood samples (see Supporting Information Figure S2), which suggests that the pinwheel assay can, indeed, enumerate the isolated cells accurately. In the clinical setting, CD4+ T-cell count can be indicative of the immune status of a patient. When the CD4+ T-cell count is lower, along with other factors, it can represent the progress of HIV infection; when the count is higher, it can indicate recovery from immunodeficiency through decreased viral load. The pinwheel CD4+ levels in 21 blood samples following immunomagnetic separation were compared with the results from flow cytometry (Figure 7A,C). The collective data is from two sample groups from two sources (8 samples analyzed same day as blood draw; 13 samples analyzed >24 h after blood draw). A good correlation was observed between the immunocapture−pinwheel assay and flow cytometry, when the samples were analyzed within 24 h of the blood draw (Figure 7A,B). Dramatically poorer correlation between the pinwheel and flow cytometry methods was observed with samples analyzed more than 24 h postdraw (Figure 7C). This observation is consistent with the observation by Diagbouga et al. that 31%−69% of blood samples exhibit more than a 20% decrease of CD4 count after a 24 h delay,20 which directly affects the accuracy of the pinwheel assay. For HIV-infected patients, initiation of ART is determined by a CD4+ T-cell count that drops below 350 cells/μL. What we have demonstrated here is that, with the 21 whole blood samples evaluated from HIV patients, the pinwheel assay correctly categorized those determined by flow cytometry to be above or below the 350 cells/μL cut off. Only one sample (one Figure 7. Quantification of CD4+ T cells. The pinwheel result correlates well with flow cytometry when the post-drawn time of blood is less than 24 h, as shown in (A) and (B). For the samples with post-drawn time over 24 h, the accuracy of the pinwheel assay is compromised due to the deterioration of sample quality, as shown in (C) and (D). The solid blue lines in (B) and (D) represent linear calibration functions, and the black dashed lines show y = x. The gray dashed lines represent the threshold (350 cells per μL) that defines the starting time of ARV for HIV patients (for (B), R2 = 0.997; for (D), R2 = 0.775). The arrows in (C) and (D) point to the only sample that generated a false result in the pinwheel assay. Analytical Chemistry Article dx.doi.org/10.1021/ac401402h | Anal. Chem. 2013, 85, 11233−1123911238
  • 7. from the >24 h storage time group) was categorized as false positive, and this point is labeled with a gray arrow in Figure 7D. Despite the asynchrony in the storage history of these samples, this still represents a >95% correlation between the immunocapture−pinwheel assay and flow cytometry. This is remarkable and points to the obvious merit of a method that does not require fluorescent reagents, microscopy, or cytometric counting. ■ CONCLUSIONS In conclusion, we have extended the application of the pinwheel assay from nucleic acid quantification to cell counting, and demonstrated (1) microbial growth testing, (2) cell counting in a complex medium (WBC quantification in raw blood), as well as (3) isolation and enumeration of a specific subtype of cells from a mixture (CD4+ T cells). While we have a simple methodology for generic cell counting, specificity was brought to the method by coupling with immunocapture. These examples show the versatility of the pinwheel assay (i.e., that the assay has the potential to be applied in various fields), although we do not anticipate that the pinwheel assay will replace all the conventional methods. As the aggregation of magnetic particles only requires microliter volume of samples and a digital camera as the detection modality, the pinwheel assay could serve as a portable and cost-effective alternative to conventional technologies for point-of-care applications. One of the main advantages is that the pinwheel assay does not require fluorescent labels and complex optics or expensive instrumentation to enumerate cells. Fluorescence provides accurate and sensitive quantification of analytes in various applications, but the labels are often subject to photobleaching, resulting in unstable optical properties, which increases the cost for reagent storage and induces the need for repetitive calibration. By avoiding fluorescent labels, the pinwheel assay offers enhanced simplicity and cost-effectiveness compared to conventional techniques, which are always desired when applying a new technique in resource-limited regions. One of the major drawbacks of the pinwheel assay is that the cells are lysed after counting, and thus will not be available to other cell analyses, which may be problematic if sample availability is limited. Day-to-day variability with the pinwheel method was low, a likely result of the simplicity of the method. User-to-user variability is more likely to be significant, but this can be overcome by building a larger database for calibration of the assay independent of the user. We are currently exploring designs for integrating all of these processes on a single microfluidic device to minimize hands-on operation and user- to-user variabilitythis is essential for progressing toward a cell counting device with sample-in-answer-out capability. Progress on device development has been made in terms of enhancing assay throughput21 and process automation.22 Successful employment of the pinwheel assay in an integrated microfluidic system will not only benefit basic biomedical research but also offer capability to a wide range of clinical applications. ■ ASSOCIATED CONTENT *S Supporting Information Additional information as noted in the text. This material is available free of charge via the Internet at http://pubs.acs.org. ■ AUTHOR INFORMATION Corresponding Author *E-mail: jpl5e@virginia.edu. Present Addresses ■ Microlab Horizon, LLC, 705-D Dale Ave., Charlottesville, VA 22903 (J.L.) ▲ Salisbury University, 1101 Camden Ave., Salisbury, MD 21801 (A.D.) Notes The authors declare no competing financial interest. ■ REFERENCES (1) Chung, T. D.; Kim, H. C. Electrophoresis 2007, 28 (24), 4511− 4520. (2) Rodriguez, W. R.; Christodoulides, N.; Floriano, P. N.; Graham, S.; Mohanty, S.; Dixon, M.; Hsiang, M.; Peter, T.; Zavahir, S.; Thior, I.; Romanovicz, D.; Bernard, B.; Goodey, A. P.; Walker, B. D.; McDevitt., J. T. PLoS Med. 2005, 2 (7), 663−672. (3) Cheng, X.; Irimia, D.; Dixon, M.; Sekine, K.; Demirci, U.; Zamirb, L.; Tompkins, R. G.; Rodriguez, W.; Toner, M. Lab Chip 2007, 7 (2), 170−178. (4) Cheng, X.; Gupta, A.; Chen, C.; Tompkins, R. G.; Rodriguez, W.; Toner, M. Lab Chip 2009, 9 (10), 1357−1364. (5) Cheng, X.; Liub, Y.; Irimia, D.; Demirci, U.; Yang, L.; Zamir, L.; Rodríguez, W. R.; Toner, M.; Bashir, R. Lab Chip 2007, 7 (6), 746− 755. (6) Moon, S.; Keles, H. O.; Ozcan, A.; Khademhosseini, A.; Hæggstrom, E.; Kuritzkes, D.; Demirci, U. Biosens. Bioelectron. 2009, 24 (11), 3208−3214. (7) Wang, Z.; Chin, S.; Chin, C. D.; Sarik, J.; Harper, M.; Justman, J.; Sia, S. K. Anal. Chem. 2010, 82 (1), 36−40. (8) Redd, A. D.; Quinn, T. C. Nat. Rev. Microbiol. 2008, 6, S1. (9) Gijs, M. A. Microfluid. Nanofluid. 2004, 1 (1), 22−40. (10) Chen, G. D.; Alberts, C. J.; Rodriguez, W.; Toner, M. Anal. Chem. 2010, 82 (2), 723−728. (11) Sista, R. S.; Eckhardt, A. E.; Srinivasan, V.; Pollack, M. G.; Palanki, S.; Pamula, V. K. Lab Chip 2008, 8 (12), 2188−2196. (12) Grumann, M.; Geipel, A.; Riegger, L.; Zengerle, R.; Ducree, J. Lab Chip 2005, 5 (5), 560−565. (13) Afshar, R.; Moser, Y.; Lehnert, T.; Gijs, M. A. Anal. Chem. 2011, 83 (3), 1022−1029. (14) Moser, T.; Lehnert, T.; Gijs, M. A. Lab Chip 2009, 9 (22), 3261−3267. (15) Leslie, D. C.; Li, J.; Strachan, B. C.; Begley, M. R.; Finkler, D.; Bazydlo, L. A. L.; Barker, N. S.; Haverstick, D. M.; Utz, M.; Landers, J. P. J. Am. Chem. Soc. 2012, 134 (12), 5689−5696. (16) Melzak, K. A.; Sherwood, C. S.; Turner, R. F. B.; Haynes, C. A. J. Colloid Interface Sci. 1996, 181 (2), 635−644. (17) Leslie, D. C.; Li, J.; Finkler, D. M.; Price, C. W.; Landers, J. P. Proc. 13th Int. Conf. Miniaturized Systems Chem. Life Sci., Jeju, Korea, November 1−5, 2009; vol. 2. (18) Voet, D.; Voet, J. G. Biochemistry, 2nd ed.; John Wiley and Sons: New York, 1995; p 1361. (19) Rogers, H. J.; Mandelstam, J. Biochem. J. 1962, 84, 299−303. (20) Diagbouga, S.; Chazallon, C.; Kazatchkine, M. D.; Van de Perre, P.; Inwoley, A.; M’Boup, S.; David, M. P.; Tenin, A. T.; Soudre, R.; Aboulker, J.; Weiss, L. AIDS 2003, 17 (15), 2201−2208. (21) Li, J.; Landers, J. P. Proc. 15th Int. Conf. Miniaturized Systems Chem. Life Sci.Seattle, WA, October 2−6, 2011; pp 1956−1958 (22) Ouyang, Y.; Li, J.; Landers, J. P. Proc. 17th Int. Conf. Miniaturized Systems Chem. Life Sci., Freiburg, Germany, October 27−31, 2013; Analytical Chemistry Article dx.doi.org/10.1021/ac401402h | Anal. Chem. 2013, 85, 11233−1123911239