


![THANK YOU Enquires & comments R S Raghav ICFAI Business School [email_address]](https://image.slidesharecdn.com/ashley-final-ppt-1229814555788310-1/85/Ashok-leyland-valuation-13-320.jpg)

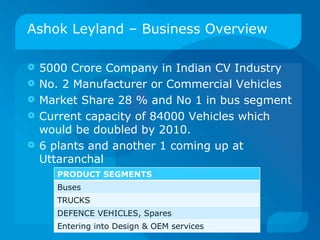
Ashok Leyland is the second largest manufacturer of commercial vehicles in India with a 28% market share. It has plans to double its production capacity of 84,000 vehicles by 2010 through expanding its 6 existing plants and opening a new one. The company operates in multiple vehicle segments including buses, trucks, and defense vehicles. While the auto industry has faced difficulties due to economic factors, Ashok Leyland has performed well with revenue growth of 7.81% and PAT growth of 29.11% in FY2008. However, rising fuel and raw material prices as well as interest rate hikes pose concerns for the future.