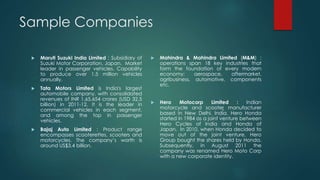
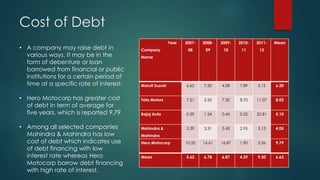
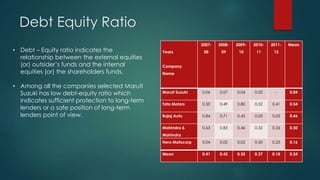
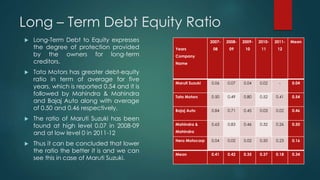
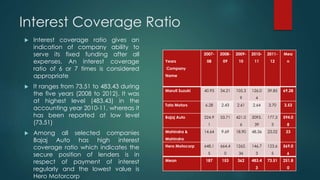
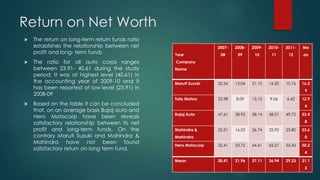
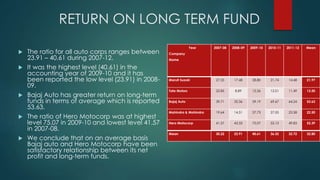
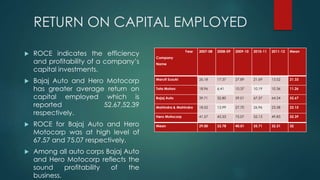
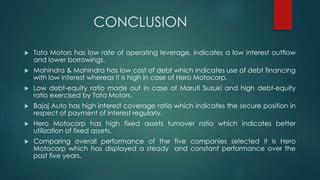
SlideShare a Scribd company logo
CAPITAL STRUCTURE ANALYSIS
OF INDIAN AUTOMOBILE
INDUSTRY
Introduction: Automobile Industry
Overview
 The automobile industry is vital to
the growth of the Indian
economy.
 In the last decade their share in
the Indian economy is around 5%
of GDP.
 Economic progress is indicated by
the amount of goods and services
produced which gives an impetus
for transportation and boost the
sale of vehicles.
 Main segment in Indian
Automobile Industry:-
 Passenger vehicles: Cars and
buses
 Commercial vehicles: Goods
carrier , MUV, SUV, Minivans,
Trucks, Tippers
 Three wheelers: Rickshaws, Trolleys,
Delivery Vans
 Two wheelers: Scooters,
Motorcycles and Mopeds
Sample Companies
 Maruti Suzuki India Limited : Subsidiary of
Suzuki Motor Corporation, Japan. Market
leader in passenger vehicles. Capability
to produce over 1.5 million vehicles
annually.
 Tata Motors Limited is India's largest
automobile company, with consolidated
revenues of INR 1,65,654 crores (USD 32.5
billion) in 2011-12. It is the leader in
commercial vehicles in each segment,
and among the top in passenger
vehicles.
 Bajaj Auto Limited : Product range
encompasses scooterettes, scooters and
motorcycles. The company’s worth is
around US$3.4 billion.
 Mahindra & Mahindra Limited (M&M) :
operations span 18 key industries that
form the foundation of every modern
economy: aerospace, aftermarket,
agribusiness, automotive, components
etc.
 Hero Motocorp Limited : Indian
motorcycle and scooter manufacturer
based in New Delhi, India. Hero Honda
started in 1984 as a joint venture between
Hero Cycles of India and Honda of
Japan. In 2010, when Honda decided to
move out of the joint venture, Hero
Group bought the shares held by Honda.
Subsequently, in August 2011 the
company was renamed Hero Moto Corp
with a new corporate identity.
Objectives of Study
 To assess the capital structure of
the selected companies.
 To know the status of capital
structure among selected
automobile industries
 To determine the long-term
profitability of the selected
companies.
 To assess the change in
proportion of debt and equity.
 To offer suitable suggestions for
framing effective capital
structure to meet the
requirement of the selected
companies.
 Period of the study:- The study
covers a period of five years from
2007-08 to 2011 -2012.
Tools Used
Following tools used:-
 Leverage analysis(Combined Leverage)
1. Operating Leverage
2. Financial Leverage
 Cost of capital analysis
1. Cost of Equity
2. Cost of Debt
 Ratio analysis
1. Debt- Equity Ratio
2. Long Term Debt- Equity Ratio
3. Interest Coverage Ratio
4. Fixed Assets Turnover Ratio
5. Return on Net Worth
6. Return on long term fund
7. Return on Capital Employed
Leverage Analysis
Operating Leverage
Year
Company
Name
2007-
08
2008-
09
2009-
10
2010-
11
2011-
12
Mean
Maruti Suzuki 0.86 1.17 0.95 0.97 0.93 0.98
Tata Motors 0.64 0.61 0.66 0.75 0.63 0.66
Bajaj Auto 0.92 1.01 0.97 0.97 0.96 0.97
Mahindra &
Mahindra
0.83 1.08 0.97 0.93 0.82 0.93
Hero Motocorp 1.01 0.98 1.00 0.99 0.97 0.99
Mean 0.85 0.97 0.91 0.92 0.86 0.90
 Operating leverage refers to the
relationship between firm’s sales
revenue and its earnings before interest
and tax.
 Where, contribution= sales-variable cost.
O.L = Contribution/Earning before
interest and tax.
 Hero Moto Corp : Ranges from 0.97
to 1.01.
 Maruti Suzuki : Ranges from 0.86 to
1.17.
 Bajaj Auto : Ranges from 0.92 to
1.01.
 Tata Motors : Ranges from 0.63 to
0.75.
 Tata Motors has low rate of operating
leverage, which indicates a low interest
outflow and consequently lower
borrowings.
Financial Leverage:
Year
Company
Name
2007-08 2008-
09
2009-
10
2010-
11
2011-12 Mean
Maruti Suzuki 1.05 1.18 1.06 1.12 1.41 1.16
Tata Motors 1.50 0.12 1.80 2.60 3.36 1.88
Bajaj Auto 0.63 1.14 1.04 0.75 0.93 0.90
Mahindra &
Mahindra
0.93 1.25 1.09 1.01 1.08 1.07
Hero Motocorp 0.97 0.98 0.97 1.08 1.27 1.05
Mean 1.02 0.93 1.19 1.31 1.61 1.21
• Financial leverage can be described as the
extent to which a business or investor is using
the borrowed money.
• Tata Motors has greater financial leverage in
terms of average for five years.
• Bajaj Auto has low financial leverage which
indicates good among all selected
companies.
Cost of capital
analysis
Cost of Equity
Year
Company
Name
2007-08 2008-09 2009-10 2010-11 2011-12 Mean
Maruti Suzuki 0.96 0.22 0.42 0.81 0.50 0.58
Tata Motors 47.15 3.78 5.74 11.21 1.28 13.83
Bajaj Auto 10.22 2.50 2.60 2.51 2.11 3.99
Mahindra &
Mahindra
8.37 1.85 1.22 1.68 1.34 2.89
Hero Motocorp 2.36 1.16 5.54 5.51 2.37 3.39
Mean 13.81 1.90 3.10 4.34 1.52 4.94
• Equity is the permanent capital for a
firm.
• Cost of equity of Maruti Suzuki was at
high level 0.96 in 2007-08 and at low
level 0.22 in 2008-09
• In Bajaj Auto cost of equity was at high
level 10.20 in 2007-08 and at low level
2.11 in 2011-12.
Cost of Debt
Year
Company
Name
2007-
08
2008-
09
2009-
10
2010-
11
2011-
12
Mean
Maruti Suzuki 6.62 7.30 4.08 7.89 5.12 6.20
Tata Motors 7.51 5.35 7.50 8.70 11.07 8.03
Bajaj Auto 0.39 1.34 0.45 0.52 22.81 5.10
Mahindra &
Mahindra
3.39 3.31 5.45 2.95 5.13 4.05
Hero Motocorp 10.20 16.61 16.87 1.90 3.36 9.79
Mean 5.62 6.78 6.87 4.39 9.50 6.63
• A company may raise debt in
various ways. It may be in the
form of debenture or loan
borrowed from financial or public
institutions for a certain period of
time at a specific rate of interest.
• Hero Motocorp has greater cost
of debt in term of average for
five years, which is reported 9.79
• Among all selected companies
Mahindra & Mahindra has low
cost of debt which indicates use
of debt financing with low
interest rate whereas Hero
Motocorp borrow debt financing
with high rate of interest.
Ratio analysis
Debt Equity Ratio
Years
Company
Name
2007-
08
2008-
09
2009-
10
2010-
11
2011-
12
Mean
Maruti Suzuki 0.06 0.07 0.04 0.02 - 0.04
Tata Motors 0.50 0.49 0.80 0.52 0.41 0.54
Bajaj Auto 0.84 0.71 0.45 0.03 0.02 0.46
Mahindra &
Mahindra
0.63 0.83 0.46 0.32 0.26 0.50
Hero Motocorp 0.04 0.02 0.02 0.50 0.23 0.16
Mean 0.41 0.42 0.35 0.37 0.18 0.34
• Debt – Equity ratio indicates the
relationship between the external equities
(or) outsider’s funds and the internal
equities (or) the shareholders funds.
• Among all the companies selected Maruti
Suzuki has low debt-equity ratio which
indicates sufficient protection to long-term
lenders or a safe position of long-term
lenders point of view.
Long – Term Debt Equity Ratio
Years
Company
Name
2007-
08
2008-
09
2009-
10
2010-
11
2011-
12
Mean
Maruti Suzuki 0.06 0.07 0.04 0.02 - 0.04
Tata Motors 0.50 0.49 0.80 0.52 0.41 0.54
Bajaj Auto 0.84 0.71 0.45 0.03 0.02 0.46
Mahindra &
Mahindra
0.63 0.83 0.46 0.32 0.26 0.50
Hero Motocorp 0.04 0.02 0.02 0.50 0.23 0.16
Mean 0.41 0.42 0.35 0.37 0.18 0.34
 Long-Term Debt to Equity expresses
the degree of protection provided
by the owners for long-term
creditors.
 Tata Motors has greater debt-equity
ratio in term of average for five
years, which is reported 0.54 and it is
followed by Mahindra & Mahindra
and Bajaj Auto along with average
of 0.50 and 0.46 respectively.
 The ratio of Maruti Suzuki has been
found at high level 0.07 in 2008-09
and at low level 0 in 2011-12
 Thus it can be concluded that lower
the ratio the better it is and we can
see this in case of Maruti Suzuki.
Interest Coverage Ratio
Years
Company
Name
2007-
08
2008-
09
2009-
10
2010-
11
2011-
12
Mea
n
Maruti Suzuki 40.93 34.21 105.3
9
126.0
4
39.85 69.28
Tata Motors 6.28 2.43 2.61 2.64 3.70 3.53
Bajaj Auto 224.9
1
53.71 421.0
6
2093.
39
177.3
3
594.0
8
Mahindra &
Mahindra
14.64 9.69 18.90 48.36 23.02 23
Hero Motocorp 648.1
5
664.4
0
1262.
36
146.7
3
123.6
5
569.0
6
Mean 187 153 362 483.4
3
73.51 251.8
0
 Interest coverage ratio gives an
indication of company ability to
serve its fixed funding after all
expenses. An interest coverage
ratio of 6 or 7 times is considered
appropriate
 It ranges from 73.51 to 483.43 during
the five years (2008 to 2012). It was
at highest level (483.43) in the
accounting year 2010-11, whereas it
has been reported at low level
(73.51)
 Among all selected companies
Bajaj Auto has high interest
coverage ratio which indicates the
secure position of lenders is in
respect of payment of interest
regularly and the lowest value is
Hero Motorcorp
Fixed Asset Turnover Ratio
Year
Company
Name
2007-
08
2008-
09
2009
-10
2010
-11
2011-
12
Mea
n
Maruti Suzuki 2.48 2.38 2.82 3.13 2.46 2.65
Tata Motors 2.69 1.29 1.24 1.42 1.64 1.66
Bajaj Auto 2.95 2.60 3.50 4.85 5.75 3.93
Mahindra &
Mahindra
3.22 2.84 3.85 4.08 4.32 3.66
Hero Motocorp 5.89 5.34 6.29 3.70 4.05 5.54
Mean 3.45 2.89 3.54 3.44 3.64 3.40
 The fixed assets turnover ratio
measures the efficiency with
which fixed assets are
employed.
 The ratio for all auto corps
ranges between 2.89 to 3.64 in
the study period. It was at
highest level 3.64 in the
accounting year of 2011-12,
whereas it has been reported at
low level 2.89 in 2008-09
 It can be concluded that on an
average basis Hero Motocorp
has high fixed assets turnover
ratio which indicates better
utilization of fixed assets and it is
opposite for Tata Motors
Return on Net Worth
Year
Company
Name
2007-
08
2008-
09
2009-
10
2010-
11
2011-
12
Me
an
Maruti Suzuki 20.56 13.04 21.10 16.50 10.76 16.3
9
Tata Motors 25.98 8.09 15.15 9.06 6.42 12.9
4
Bajaj Auto 47.61 38.92 58.14 68.01 49.72 52.4
8
Mahindra &
Mahindra
25.51 16.03 26.74 25.92 23.80 23.6
0
Hero Motocorp 32.41 33.72 64.41 65.21 55.43 50.2
4
Mean 30.41 21.96 37.11 36.94 29.23 31.1
3
 The return on long-term return funds ratio
establishes the relationship between net
profit and long- term funds
 The ratio for all auto corps ranges
between 23.91- 40.61 during the study
period. It was at highest level (40.61) in
the accounting year of 2009-10 and it
has been reported at low level (23.91) in
2008-09
 Based on the table it can be concluded
that, on an average basis Bajaj auto and
Hero Motocorp have been reveals
satisfactory relationship between its net
profit and long-term funds. On the
contrary Maruti Suzuki and Mahindra &
Mahindra have not been found
satisfactory return on long term fund.
RETURN ON LONG TERM FUND
 The ratio for all auto corps ranges between
23.91 – 40.61 during 2007-12.
 It was the highest level (40.61) in the
accounting year of 2009-10 and it has
been reported the low level (23.91) in 2008-
09.
 Bajaj Auto has greater return on long-term
funds in terms of average which is reported
53.63.
 The ratio of Hero Motocorp was at highest
level 75.07 in 2009-10 and lowest level 41.57
in 2007-08.
 We conclude that on an average basis
Bajaj auto and Hero Motocorp have been
satisfactory relationship between its net
profit and long-term funds.
Year
Company
Name
2007-08 2008-09 2009-10 2010-11 2011-12 Mean
Maruti Suzuki 27.35 17.48 28.80 21.74 14.48 21.97
Tata Motors 22.85 8.89 12.26 12.01 11.49 13.50
Bajaj Auto 39.71 35.36 59.19 69.67 64.24 53.63
Mahindra & Mahindra 19.64 14.51 27.73 27.05 23.58 22.50
Hero Motocorp 41.57 43.33 75.07 52.13 49.83 52.39
Mean 30.22 23.91 40.61 36.52 32.72 32.80
RETURN ON CAPITAL EMPLOYED
 ROCE indicates the efficiency
and profitability of a company’s
capital investments.
 Bajaj Auto and Hero Motocorp
has greater average return on
capital employed which is
reported 52.67,52.39
respectively.
 ROCE for Bajaj Auto and Hero
Motocorp was at high level of
67.57 and 75.07 respectively.
 Among all auto corps Bajaj Auto
and Hero Motocorp reflects the
sound profitability of the
business.
Year
Company
Name
2007-08 2008-09 2009-10 2010-11 2011-12 Mean
Maruti Suzuki 26.18 17.37 27.89 21.69 13.52 21.33
Tata Motors 18.96 6.41 10.37 10.19 10.36 11.26
Bajaj Auto 39.71 32.80 59.01 67.57 64.24 52.67
Mahindra & Mahindra 18.52 13.99 27.70 26.96 23.58 22.15
Hero Motocorp 41.57 43.33 75.07 52.13 49.83 52.39
Mean 29.00 22.78 40.01 35.71 32.31 32
SUGGESTION
 Tata Motors total risk was high , so it should increase its equity to
reduce the risk.
 All the selected companies should try to maintain their debt-equity
proportion at the same level.
 Bajaj Auto must give special attention to increase the earnings per
share to safeguard and improve the welfare of its shareholders.
 Tata Motors and Maruti Suzuki should try to reduce their operating
expenses and financial burden to convert revenue into actual profit.
CONCLUSION
 Tata Motors has low rate of operating leverage, indicates a low interest outflow
and lower borrowings.
 Mahindra & Mahindra has low cost of debt which indicates use of debt financing
with low interest whereas it is high in case of Hero Motocorp.
 Low debt-equity ratio made out in case of Maruti Suzuki and high debt-equity
ratio exercised by Tata Motors.
 Bajaj Auto has high interest coverage ratio which indicates the secure position in
respect of payment of interest regularly.
 Hero Motocorp has high fixed assets turnover ratio which indicates better
utilization of fixed assets.
 Comparing overall performance of the five companies selected it is Hero
Motocorp which has displayed a steady and constant performance over the
past five years.
THANK YOU

More Related Content

What's hot

Presentation on two wheeler industry in india
Presentation on two wheeler industry in indiaPresentation on two wheeler industry in india
Presentation on two wheeler industry in india
Institute for technology and management
 
Bajaj Auto Co Introduction
Bajaj Auto Co IntroductionBajaj Auto Co Introduction
Bajaj Auto Co Introduction
Praful Metange
 
Hero MotoCorp Financial Analysis Report
Hero MotoCorp Financial Analysis ReportHero MotoCorp Financial Analysis Report
Hero MotoCorp Financial Analysis ReportPrateek Singh Bapna
 
Tata motors Financial Analysis
Tata motors Financial AnalysisTata motors Financial Analysis
Tata motors Financial Analysis
N V Jagadeesh Kumar
 
MAHINDRA AND MAHINDRA FINANCIAL MANAGEMENT REPORT
MAHINDRA AND MAHINDRA FINANCIAL MANAGEMENT REPORTMAHINDRA AND MAHINDRA FINANCIAL MANAGEMENT REPORT
MAHINDRA AND MAHINDRA FINANCIAL MANAGEMENT REPORT
SagarDuttPhuloria
 
PESTLE ANALYSIS ON AUTOMOBILE INDUSTRY IN INDIA-BY MANISH BADHIYE
PESTLE ANALYSIS ON AUTOMOBILE INDUSTRY IN INDIA-BY MANISH BADHIYEPESTLE ANALYSIS ON AUTOMOBILE INDUSTRY IN INDIA-BY MANISH BADHIYE
PESTLE ANALYSIS ON AUTOMOBILE INDUSTRY IN INDIA-BY MANISH BADHIYEManish Badhiye
 
Bajaj
BajajBajaj
SWOT analysis of TATA motors
SWOT analysis of TATA motorsSWOT analysis of TATA motors
SWOT analysis of TATA motors
Sai Malleswar
 
Eicher motors
Eicher motorsEicher motors
Eicher motors
Naveen Mechu
 
Hero moto corp
Hero moto corpHero moto corp
Hero moto corp
swapnilshinde9561
 
Hero motocorp ltd full PPT
Hero motocorp ltd full PPTHero motocorp ltd full PPT
Hero motocorp ltd full PPT
Sushant N'kkr
 
Marketing strategy of maruti suzuki
Marketing strategy of maruti suzukiMarketing strategy of maruti suzuki
Marketing strategy of maruti suzuki
saurabhkumarlohal
 
Project on automobile sector in india
Project on automobile sector in indiaProject on automobile sector in india
Project on automobile sector in india
Shaikh Mussaddik
 
AN IMMERSION STUDY REPORT ON BAJAJ AUTO LIMITED
AN IMMERSION STUDY REPORT ON  BAJAJ AUTO LIMITEDAN IMMERSION STUDY REPORT ON  BAJAJ AUTO LIMITED
AN IMMERSION STUDY REPORT ON BAJAJ AUTO LIMITED
shah kunal
 
Maruti suzuki STRATEGIC MANAGEMENT
Maruti suzuki STRATEGIC MANAGEMENTMaruti suzuki STRATEGIC MANAGEMENT
Maruti suzuki STRATEGIC MANAGEMENTsanjay p
 
Hero Honda Joint Venture Split
Hero Honda Joint Venture SplitHero Honda Joint Venture Split
Hero Honda Joint Venture Split
Anant Lodha
 
Ratio Analysis on Maruti Suzuki
Ratio Analysis on Maruti SuzukiRatio Analysis on Maruti Suzuki
Ratio Analysis on Maruti Suzuki
Rahul's Ventures
 
Mahindra & mahindra
Mahindra & mahindraMahindra & mahindra
Mahindra & mahindraBHAVIN GALA
 
Bajaj Auto
Bajaj AutoBajaj Auto
Bajaj Auto
bhushan8233
 
Financial analysis of Tata Steel
Financial analysis of Tata SteelFinancial analysis of Tata Steel
Financial analysis of Tata Steel
Shubhank Shukla
 

What's hot (20)

Presentation on two wheeler industry in india
Presentation on two wheeler industry in indiaPresentation on two wheeler industry in india
Presentation on two wheeler industry in india
 
Bajaj Auto Co Introduction
Bajaj Auto Co IntroductionBajaj Auto Co Introduction
Bajaj Auto Co Introduction
 
Hero MotoCorp Financial Analysis Report
Hero MotoCorp Financial Analysis ReportHero MotoCorp Financial Analysis Report
Hero MotoCorp Financial Analysis Report
 
Tata motors Financial Analysis
Tata motors Financial AnalysisTata motors Financial Analysis
Tata motors Financial Analysis
 
MAHINDRA AND MAHINDRA FINANCIAL MANAGEMENT REPORT
MAHINDRA AND MAHINDRA FINANCIAL MANAGEMENT REPORTMAHINDRA AND MAHINDRA FINANCIAL MANAGEMENT REPORT
MAHINDRA AND MAHINDRA FINANCIAL MANAGEMENT REPORT
 
PESTLE ANALYSIS ON AUTOMOBILE INDUSTRY IN INDIA-BY MANISH BADHIYE
PESTLE ANALYSIS ON AUTOMOBILE INDUSTRY IN INDIA-BY MANISH BADHIYEPESTLE ANALYSIS ON AUTOMOBILE INDUSTRY IN INDIA-BY MANISH BADHIYE
PESTLE ANALYSIS ON AUTOMOBILE INDUSTRY IN INDIA-BY MANISH BADHIYE
 
Bajaj
BajajBajaj
Bajaj
 
SWOT analysis of TATA motors
SWOT analysis of TATA motorsSWOT analysis of TATA motors
SWOT analysis of TATA motors
 
Eicher motors
Eicher motorsEicher motors
Eicher motors
 
Hero moto corp
Hero moto corpHero moto corp
Hero moto corp
 
Hero motocorp ltd full PPT
Hero motocorp ltd full PPTHero motocorp ltd full PPT
Hero motocorp ltd full PPT
 
Marketing strategy of maruti suzuki
Marketing strategy of maruti suzukiMarketing strategy of maruti suzuki
Marketing strategy of maruti suzuki
 
Project on automobile sector in india
Project on automobile sector in indiaProject on automobile sector in india
Project on automobile sector in india
 
AN IMMERSION STUDY REPORT ON BAJAJ AUTO LIMITED
AN IMMERSION STUDY REPORT ON  BAJAJ AUTO LIMITEDAN IMMERSION STUDY REPORT ON  BAJAJ AUTO LIMITED
AN IMMERSION STUDY REPORT ON BAJAJ AUTO LIMITED
 
Maruti suzuki STRATEGIC MANAGEMENT
Maruti suzuki STRATEGIC MANAGEMENTMaruti suzuki STRATEGIC MANAGEMENT
Maruti suzuki STRATEGIC MANAGEMENT
 
Hero Honda Joint Venture Split
Hero Honda Joint Venture SplitHero Honda Joint Venture Split
Hero Honda Joint Venture Split
 
Ratio Analysis on Maruti Suzuki
Ratio Analysis on Maruti SuzukiRatio Analysis on Maruti Suzuki
Ratio Analysis on Maruti Suzuki
 
Mahindra & mahindra
Mahindra & mahindraMahindra & mahindra
Mahindra & mahindra
 
Bajaj Auto
Bajaj AutoBajaj Auto
Bajaj Auto
 
Financial analysis of Tata Steel
Financial analysis of Tata SteelFinancial analysis of Tata Steel
Financial analysis of Tata Steel
 

Viewers also liked

Capital structure Analysis of Indian Oil Corporation Limited (IOCL)
Capital structure Analysis of Indian Oil Corporation Limited (IOCL)Capital structure Analysis of Indian Oil Corporation Limited (IOCL)
Capital structure Analysis of Indian Oil Corporation Limited (IOCL)
Kangkan Deka
 
Capital structure analysis
Capital structure analysisCapital structure analysis
Capital structure analysis
lambavikash
 
Financial Statement Analysis and Valuation Of Apex Foods Ltd
Financial Statement Analysis and Valuation OfApex Foods LtdFinancial Statement Analysis and Valuation OfApex Foods Ltd
Financial Statement Analysis and Valuation Of Apex Foods Ltd
Monir Hossain
 
Capital Structure & Financial Leverage Analysis of Software Industry
Capital Structure & Financial Leverage Analysis of Software IndustryCapital Structure & Financial Leverage Analysis of Software Industry
Capital Structure & Financial Leverage Analysis of Software Industryanujsurana
 
Project on indian automotive industry
Project on indian automotive industryProject on indian automotive industry
Project on indian automotive industryLal Sivaraj
 
Capital Structure
Capital StructureCapital Structure
Capital StructureDayasagar S
 
Capital structure ppt
Capital structure pptCapital structure ppt
Capital structure ppt
Lakshmipathi Bendapudi
 
Dissertation_Capital Structure final
Dissertation_Capital Structure finalDissertation_Capital Structure final
Dissertation_Capital Structure finalJasmin Taylor
 
The Future of Decision Making with a National Spatial Database Infrastructure...
The Future of Decision Making with a National Spatial Database Infrastructure...The Future of Decision Making with a National Spatial Database Infrastructure...
The Future of Decision Making with a National Spatial Database Infrastructure...
Dr. Mohamed Gabr
 
Capital structure analysis for nrb bearings
Capital structure analysis for nrb bearingsCapital structure analysis for nrb bearings
Capital structure analysis for nrb bearings
Sumit Kr Singh
 
Plant Location Decission
Plant Location DecissionPlant Location Decission
Plant Location DecissionJay Sanghrajka
 
Factors affecting capital structure
Factors affecting capital structureFactors affecting capital structure
Factors affecting capital structure
Sandeep Suresh
 
Capital structure theory
Capital structure theoryCapital structure theory
Capital structure theory
Ana Yat
 
Detailed Analysis of Tata Motors Ltd. by calculating its cost of capital usin...
Detailed Analysis of Tata Motors Ltd. by calculating its cost of capital usin...Detailed Analysis of Tata Motors Ltd. by calculating its cost of capital usin...
Detailed Analysis of Tata Motors Ltd. by calculating its cost of capital usin...
Tushar Sharma
 
Comperative analysis of food indusrty(nestle, shezan int, engro food ltd and ...
Comperative analysis of food indusrty(nestle, shezan int, engro food ltd and ...Comperative analysis of food indusrty(nestle, shezan int, engro food ltd and ...
Comperative analysis of food indusrty(nestle, shezan int, engro food ltd and ...
Sheeraz Khan
 
Facility location
Facility locationFacility location
Facility locationSartaj
 

Viewers also liked (20)

Capital structure Analysis of Indian Oil Corporation Limited (IOCL)
Capital structure Analysis of Indian Oil Corporation Limited (IOCL)Capital structure Analysis of Indian Oil Corporation Limited (IOCL)
Capital structure Analysis of Indian Oil Corporation Limited (IOCL)
 
Capital structure analysis
Capital structure analysisCapital structure analysis
Capital structure analysis
 
Capital structure analysis
Capital structure analysisCapital structure analysis
Capital structure analysis
 
HARSHIT PPT
HARSHIT PPTHARSHIT PPT
HARSHIT PPT
 
Financial Statement Analysis and Valuation Of Apex Foods Ltd
Financial Statement Analysis and Valuation OfApex Foods LtdFinancial Statement Analysis and Valuation OfApex Foods Ltd
Financial Statement Analysis and Valuation Of Apex Foods Ltd
 
Capital Structure & Financial Leverage Analysis of Software Industry
Capital Structure & Financial Leverage Analysis of Software IndustryCapital Structure & Financial Leverage Analysis of Software Industry
Capital Structure & Financial Leverage Analysis of Software Industry
 
Project on indian automotive industry
Project on indian automotive industryProject on indian automotive industry
Project on indian automotive industry
 
Capital Structure
Capital StructureCapital Structure
Capital Structure
 
Capital structure ppt
Capital structure pptCapital structure ppt
Capital structure ppt
 
Dissertation_Capital Structure final
Dissertation_Capital Structure finalDissertation_Capital Structure final
Dissertation_Capital Structure final
 
The Future of Decision Making with a National Spatial Database Infrastructure...
The Future of Decision Making with a National Spatial Database Infrastructure...The Future of Decision Making with a National Spatial Database Infrastructure...
The Future of Decision Making with a National Spatial Database Infrastructure...
 
Capital structure analysis for nrb bearings
Capital structure analysis for nrb bearingsCapital structure analysis for nrb bearings
Capital structure analysis for nrb bearings
 
Plant Location Decission
Plant Location DecissionPlant Location Decission
Plant Location Decission
 
Factors affecting capital structure
Factors affecting capital structureFactors affecting capital structure
Factors affecting capital structure
 
Capital structure theory
Capital structure theoryCapital structure theory
Capital structure theory
 
Detailed Analysis of Tata Motors Ltd. by calculating its cost of capital usin...
Detailed Analysis of Tata Motors Ltd. by calculating its cost of capital usin...Detailed Analysis of Tata Motors Ltd. by calculating its cost of capital usin...
Detailed Analysis of Tata Motors Ltd. by calculating its cost of capital usin...
 
Pecking and tradeoff theory
Pecking and tradeoff theoryPecking and tradeoff theory
Pecking and tradeoff theory
 
Comperative analysis of food indusrty(nestle, shezan int, engro food ltd and ...
Comperative analysis of food indusrty(nestle, shezan int, engro food ltd and ...Comperative analysis of food indusrty(nestle, shezan int, engro food ltd and ...
Comperative analysis of food indusrty(nestle, shezan int, engro food ltd and ...
 
Automobile industry analysis
Automobile industry analysisAutomobile industry analysis
Automobile industry analysis
 
Facility location
Facility locationFacility location
Facility location
 

Similar to Capital Structure Analysis

Managerial accounting assignment, financial ratio analysis of automobile comp...
Managerial accounting assignment, financial ratio analysis of automobile comp...Managerial accounting assignment, financial ratio analysis of automobile comp...
Managerial accounting assignment, financial ratio analysis of automobile comp...Tushar Upadhyay
 
Ijm 06 09_005
Ijm 06 09_005Ijm 06 09_005
Ijm 06 09_005
IAEME Publication
 
Ijm 06 09_005
Ijm 06 09_005Ijm 06 09_005
Ijm 06 09_005
IAEME Publication
 
A U T O F I N A N C E I N I N D I A2
A U T O  F I N A N C E  I N  I N D I A2A U T O  F I N A N C E  I N  I N D I A2
A U T O F I N A N C E I N I N D I A2Rohan Sehgal
 
Mahindra & Mahindra Final Project
Mahindra & Mahindra  Final ProjectMahindra & Mahindra  Final Project
Mahindra & Mahindra Final Project
Ronit Das
 
Maruti Suzuki India Ltd Financial Statement Analysis
Maruti Suzuki India Ltd Financial Statement AnalysisMaruti Suzuki India Ltd Financial Statement Analysis
Maruti Suzuki India Ltd Financial Statement Analysis
Maruthi Nataraj K
 
Ppt on wealth maximization
Ppt on wealth maximizationPpt on wealth maximization
Ppt on wealth maximization
RaniPoojaSingh
 
Group_5_22581_Kushagra_Singh.pptx
Group_5_22581_Kushagra_Singh.pptxGroup_5_22581_Kushagra_Singh.pptx
Group_5_22581_Kushagra_Singh.pptx
KushagraSingh272372
 
Hero Moto Corp
Hero Moto CorpHero Moto Corp
Hero Moto Corp
Kunal Khamesra
 
Maruti Suzuki 2017 (WHITE PAPER PRESENTATION)
Maruti Suzuki 2017 (WHITE PAPER PRESENTATION)Maruti Suzuki 2017 (WHITE PAPER PRESENTATION)
Maruti Suzuki 2017 (WHITE PAPER PRESENTATION)
PAUL issac
 
62283049 tata-motors-ratio-analysis
62283049 tata-motors-ratio-analysis62283049 tata-motors-ratio-analysis
62283049 tata-motors-ratio-analysisSudip Thakur
 
Vitara Brezza
 Vitara Brezza Vitara Brezza
Vitara Brezza
PIBM
 
AMAR KUMAR REPORT FINAL.pdf
AMAR KUMAR REPORT FINAL.pdfAMAR KUMAR REPORT FINAL.pdf
AMAR KUMAR REPORT FINAL.pdf
PrinceVerma938105
 
Content page1. Source problems ……………………………………………………………….. 2.docx
Content page1. Source problems ……………………………………………………………….. 2.docxContent page1. Source problems ……………………………………………………………….. 2.docx
Content page1. Source problems ……………………………………………………………….. 2.docx
maxinesmith73660
 
Maruti suzuki
Maruti suzukiMaruti suzuki
Maruti suzukiWipro
 
Maruti suzuki ppt
Maruti suzuki pptMaruti suzuki ppt
Maruti suzuki ppt
Wipro
 
A project report on brand image of motorcycles and the colour survey for the ...
A project report on brand image of motorcycles and the colour survey for the ...A project report on brand image of motorcycles and the colour survey for the ...
A project report on brand image of motorcycles and the colour survey for the ...
Projects Kart
 
Automobile_car
Automobile_carAutomobile_car
Automobile_car
Saurav Kumar
 

Similar to Capital Structure Analysis (20)

Managerial accounting assignment, financial ratio analysis of automobile comp...
Managerial accounting assignment, financial ratio analysis of automobile comp...Managerial accounting assignment, financial ratio analysis of automobile comp...
Managerial accounting assignment, financial ratio analysis of automobile comp...
 
Ijm 06 09_005
Ijm 06 09_005Ijm 06 09_005
Ijm 06 09_005
 
Ijm 06 09_005
Ijm 06 09_005Ijm 06 09_005
Ijm 06 09_005
 
A U T O F I N A N C E I N I N D I A2
A U T O  F I N A N C E  I N  I N D I A2A U T O  F I N A N C E  I N  I N D I A2
A U T O F I N A N C E I N I N D I A2
 
Mahindra & Mahindra Final Project
Mahindra & Mahindra  Final ProjectMahindra & Mahindra  Final Project
Mahindra & Mahindra Final Project
 
Bajaj, Hero, TVS
Bajaj, Hero, TVSBajaj, Hero, TVS
Bajaj, Hero, TVS
 
Maruti Suzuki India Ltd Financial Statement Analysis
Maruti Suzuki India Ltd Financial Statement AnalysisMaruti Suzuki India Ltd Financial Statement Analysis
Maruti Suzuki India Ltd Financial Statement Analysis
 
Ppt on wealth maximization
Ppt on wealth maximizationPpt on wealth maximization
Ppt on wealth maximization
 
Group_5_22581_Kushagra_Singh.pptx
Group_5_22581_Kushagra_Singh.pptxGroup_5_22581_Kushagra_Singh.pptx
Group_5_22581_Kushagra_Singh.pptx
 
Hero Moto Corp
Hero Moto CorpHero Moto Corp
Hero Moto Corp
 
Ratio analysis
Ratio analysisRatio analysis
Ratio analysis
 
Maruti Suzuki 2017 (WHITE PAPER PRESENTATION)
Maruti Suzuki 2017 (WHITE PAPER PRESENTATION)Maruti Suzuki 2017 (WHITE PAPER PRESENTATION)
Maruti Suzuki 2017 (WHITE PAPER PRESENTATION)
 
62283049 tata-motors-ratio-analysis
62283049 tata-motors-ratio-analysis62283049 tata-motors-ratio-analysis
62283049 tata-motors-ratio-analysis
 
Vitara Brezza
 Vitara Brezza Vitara Brezza
Vitara Brezza
 
AMAR KUMAR REPORT FINAL.pdf
AMAR KUMAR REPORT FINAL.pdfAMAR KUMAR REPORT FINAL.pdf
AMAR KUMAR REPORT FINAL.pdf
 
Content page1. Source problems ……………………………………………………………….. 2.docx
Content page1. Source problems ……………………………………………………………….. 2.docxContent page1. Source problems ……………………………………………………………….. 2.docx
Content page1. Source problems ……………………………………………………………….. 2.docx
 
Maruti suzuki
Maruti suzukiMaruti suzuki
Maruti suzuki
 
Maruti suzuki ppt
Maruti suzuki pptMaruti suzuki ppt
Maruti suzuki ppt
 
A project report on brand image of motorcycles and the colour survey for the ...
A project report on brand image of motorcycles and the colour survey for the ...A project report on brand image of motorcycles and the colour survey for the ...
A project report on brand image of motorcycles and the colour survey for the ...
 
Automobile_car
Automobile_carAutomobile_car
Automobile_car
 

Recently uploaded

Tyre Industrymarket overview with examples of CEAT
Tyre Industrymarket overview with examples of CEATTyre Industrymarket overview with examples of CEAT
Tyre Industrymarket overview with examples of CEAT
kshamashah95
 
Bài tập - Tiếng anh 11 Global Success UNIT 1 - Bản HS.doc
Bài tập - Tiếng anh 11 Global Success UNIT 1 - Bản HS.docBài tập - Tiếng anh 11 Global Success UNIT 1 - Bản HS.doc
Bài tập - Tiếng anh 11 Global Success UNIT 1 - Bản HS.doc
daothibichhang1
 
Core technology of Hyundai Motor Group's EV platform 'E-GMP'
Core technology of Hyundai Motor Group's EV platform 'E-GMP'Core technology of Hyundai Motor Group's EV platform 'E-GMP'
Core technology of Hyundai Motor Group's EV platform 'E-GMP'
Hyundai Motor Group
 
Empowering Limpopo Entrepreneurs Consulting SMEs.pptx
Empowering Limpopo Entrepreneurs  Consulting SMEs.pptxEmpowering Limpopo Entrepreneurs  Consulting SMEs.pptx
Empowering Limpopo Entrepreneurs Consulting SMEs.pptx
Precious Mvulane CA (SA),RA
 
Digital Fleet Management - Why Your Business Need It?
Digital Fleet Management - Why Your Business Need It?Digital Fleet Management - Why Your Business Need It?
Digital Fleet Management - Why Your Business Need It?
jennifermiller8137
 
Why Is Your BMW X3 Hood Not Responding To Release Commands
Why Is Your BMW X3 Hood Not Responding To Release CommandsWhy Is Your BMW X3 Hood Not Responding To Release Commands
Why Is Your BMW X3 Hood Not Responding To Release Commands
Dart Auto
 
Statistics5,c.xz,c.;c.;d.c;d;ssssss.pptx
Statistics5,c.xz,c.;c.;d.c;d;ssssss.pptxStatistics5,c.xz,c.;c.;d.c;d;ssssss.pptx
Statistics5,c.xz,c.;c.;d.c;d;ssssss.pptx
coc7987515756
 
欧洲杯比赛投注官网-欧洲杯比赛投注官网网站-欧洲杯比赛投注官网|【​网址​🎉ac123.net🎉​】
欧洲杯比赛投注官网-欧洲杯比赛投注官网网站-欧洲杯比赛投注官网|【​网址​🎉ac123.net🎉​】欧洲杯比赛投注官网-欧洲杯比赛投注官网网站-欧洲杯比赛投注官网|【​网址​🎉ac123.net🎉​】
欧洲杯比赛投注官网-欧洲杯比赛投注官网网站-欧洲杯比赛投注官网|【​网址​🎉ac123.net🎉​】
ahmedendrise81
 
Antique Plastic Traders Company Profile
Antique Plastic Traders Company ProfileAntique Plastic Traders Company Profile
Antique Plastic Traders Company Profile
Antique Plastic Traders
 
What do the symbols on vehicle dashboard mean?
What do the symbols on vehicle dashboard mean?What do the symbols on vehicle dashboard mean?
What do the symbols on vehicle dashboard mean?
Hyundai Motor Group
 
Ec460b lc Excavator Volvo Service Repair.pdf
Ec460b lc Excavator Volvo Service Repair.pdfEc460b lc Excavator Volvo Service Repair.pdf
Ec460b lc Excavator Volvo Service Repair.pdf
Excavator
 
Ec330B Lc Excavator Volvo Service Repair.pdf
Ec330B Lc Excavator Volvo Service Repair.pdfEc330B Lc Excavator Volvo Service Repair.pdf
Ec330B Lc Excavator Volvo Service Repair.pdf
Excavator
 
Wondering if Your Mercedes EIS is at Fault Here’s How to Tell
Wondering if Your Mercedes EIS is at Fault Here’s How to TellWondering if Your Mercedes EIS is at Fault Here’s How to Tell
Wondering if Your Mercedes EIS is at Fault Here’s How to Tell
Vic Auto Collision & Repair
 
What Causes 'Trans Failsafe Prog' to Trigger in BMW X5
What Causes 'Trans Failsafe Prog' to Trigger in BMW X5What Causes 'Trans Failsafe Prog' to Trigger in BMW X5
What Causes 'Trans Failsafe Prog' to Trigger in BMW X5
European Service Center
 
gtyccccccccccccccccccccccccccccccccccccccccccccccccccccccc
gtycccccccccccccccccccccccccccccccccccccccccccccccccccccccgtyccccccccccccccccccccccccccccccccccccccccccccccccccccccc
gtyccccccccccccccccccccccccccccccccccccccccccccccccccccccc
4thzenzstar
 
Things to remember while upgrading the brakes of your car
Things to remember while upgrading the brakes of your carThings to remember while upgrading the brakes of your car
Things to remember while upgrading the brakes of your car
jennifermiller8137
 
What Does the PARKTRONIC Inoperative, See Owner's Manual Message Mean for You...
What Does the PARKTRONIC Inoperative, See Owner's Manual Message Mean for You...What Does the PARKTRONIC Inoperative, See Owner's Manual Message Mean for You...
What Does the PARKTRONIC Inoperative, See Owner's Manual Message Mean for You...
Autohaus Service and Sales
 
What Exactly Is The Common Rail Direct Injection System & How Does It Work
What Exactly Is The Common Rail Direct Injection System & How Does It WorkWhat Exactly Is The Common Rail Direct Injection System & How Does It Work
What Exactly Is The Common Rail Direct Injection System & How Does It Work
Motor Cars International
 
Why Isn't Your BMW X5's Comfort Access Functioning Properly Find Out Here
Why Isn't Your BMW X5's Comfort Access Functioning Properly Find Out HereWhy Isn't Your BMW X5's Comfort Access Functioning Properly Find Out Here
Why Isn't Your BMW X5's Comfort Access Functioning Properly Find Out Here
Masters European & Gapanese Auto Repair
 
一比一原版(AIS毕业证)奥克兰商学院毕业证成绩单如何办理
一比一原版(AIS毕业证)奥克兰商学院毕业证成绩单如何办理一比一原版(AIS毕业证)奥克兰商学院毕业证成绩单如何办理
一比一原版(AIS毕业证)奥克兰商学院毕业证成绩单如何办理
eygkup
 

Recently uploaded (20)

Tyre Industrymarket overview with examples of CEAT
Tyre Industrymarket overview with examples of CEATTyre Industrymarket overview with examples of CEAT
Tyre Industrymarket overview with examples of CEAT
 
Bài tập - Tiếng anh 11 Global Success UNIT 1 - Bản HS.doc
Bài tập - Tiếng anh 11 Global Success UNIT 1 - Bản HS.docBài tập - Tiếng anh 11 Global Success UNIT 1 - Bản HS.doc
Bài tập - Tiếng anh 11 Global Success UNIT 1 - Bản HS.doc
 
Core technology of Hyundai Motor Group's EV platform 'E-GMP'
Core technology of Hyundai Motor Group's EV platform 'E-GMP'Core technology of Hyundai Motor Group's EV platform 'E-GMP'
Core technology of Hyundai Motor Group's EV platform 'E-GMP'
 
Empowering Limpopo Entrepreneurs Consulting SMEs.pptx
Empowering Limpopo Entrepreneurs  Consulting SMEs.pptxEmpowering Limpopo Entrepreneurs  Consulting SMEs.pptx
Empowering Limpopo Entrepreneurs Consulting SMEs.pptx
 
Digital Fleet Management - Why Your Business Need It?
Digital Fleet Management - Why Your Business Need It?Digital Fleet Management - Why Your Business Need It?
Digital Fleet Management - Why Your Business Need It?
 
Why Is Your BMW X3 Hood Not Responding To Release Commands
Why Is Your BMW X3 Hood Not Responding To Release CommandsWhy Is Your BMW X3 Hood Not Responding To Release Commands
Why Is Your BMW X3 Hood Not Responding To Release Commands
 
Statistics5,c.xz,c.;c.;d.c;d;ssssss.pptx
Statistics5,c.xz,c.;c.;d.c;d;ssssss.pptxStatistics5,c.xz,c.;c.;d.c;d;ssssss.pptx
Statistics5,c.xz,c.;c.;d.c;d;ssssss.pptx
 
欧洲杯比赛投注官网-欧洲杯比赛投注官网网站-欧洲杯比赛投注官网|【​网址​🎉ac123.net🎉​】
欧洲杯比赛投注官网-欧洲杯比赛投注官网网站-欧洲杯比赛投注官网|【​网址​🎉ac123.net🎉​】欧洲杯比赛投注官网-欧洲杯比赛投注官网网站-欧洲杯比赛投注官网|【​网址​🎉ac123.net🎉​】
欧洲杯比赛投注官网-欧洲杯比赛投注官网网站-欧洲杯比赛投注官网|【​网址​🎉ac123.net🎉​】
 
Antique Plastic Traders Company Profile
Antique Plastic Traders Company ProfileAntique Plastic Traders Company Profile
Antique Plastic Traders Company Profile
 
What do the symbols on vehicle dashboard mean?
What do the symbols on vehicle dashboard mean?What do the symbols on vehicle dashboard mean?
What do the symbols on vehicle dashboard mean?
 
Ec460b lc Excavator Volvo Service Repair.pdf
Ec460b lc Excavator Volvo Service Repair.pdfEc460b lc Excavator Volvo Service Repair.pdf
Ec460b lc Excavator Volvo Service Repair.pdf
 
Ec330B Lc Excavator Volvo Service Repair.pdf
Ec330B Lc Excavator Volvo Service Repair.pdfEc330B Lc Excavator Volvo Service Repair.pdf
Ec330B Lc Excavator Volvo Service Repair.pdf
 
Wondering if Your Mercedes EIS is at Fault Here’s How to Tell
Wondering if Your Mercedes EIS is at Fault Here’s How to TellWondering if Your Mercedes EIS is at Fault Here’s How to Tell
Wondering if Your Mercedes EIS is at Fault Here’s How to Tell
 
What Causes 'Trans Failsafe Prog' to Trigger in BMW X5
What Causes 'Trans Failsafe Prog' to Trigger in BMW X5What Causes 'Trans Failsafe Prog' to Trigger in BMW X5
What Causes 'Trans Failsafe Prog' to Trigger in BMW X5
 
gtyccccccccccccccccccccccccccccccccccccccccccccccccccccccc
gtycccccccccccccccccccccccccccccccccccccccccccccccccccccccgtyccccccccccccccccccccccccccccccccccccccccccccccccccccccc
gtyccccccccccccccccccccccccccccccccccccccccccccccccccccccc
 
Things to remember while upgrading the brakes of your car
Things to remember while upgrading the brakes of your carThings to remember while upgrading the brakes of your car
Things to remember while upgrading the brakes of your car
 
What Does the PARKTRONIC Inoperative, See Owner's Manual Message Mean for You...
What Does the PARKTRONIC Inoperative, See Owner's Manual Message Mean for You...What Does the PARKTRONIC Inoperative, See Owner's Manual Message Mean for You...
What Does the PARKTRONIC Inoperative, See Owner's Manual Message Mean for You...
 
What Exactly Is The Common Rail Direct Injection System & How Does It Work
What Exactly Is The Common Rail Direct Injection System & How Does It WorkWhat Exactly Is The Common Rail Direct Injection System & How Does It Work
What Exactly Is The Common Rail Direct Injection System & How Does It Work
 
Why Isn't Your BMW X5's Comfort Access Functioning Properly Find Out Here
Why Isn't Your BMW X5's Comfort Access Functioning Properly Find Out HereWhy Isn't Your BMW X5's Comfort Access Functioning Properly Find Out Here
Why Isn't Your BMW X5's Comfort Access Functioning Properly Find Out Here
 
一比一原版(AIS毕业证)奥克兰商学院毕业证成绩单如何办理
一比一原版(AIS毕业证)奥克兰商学院毕业证成绩单如何办理一比一原版(AIS毕业证)奥克兰商学院毕业证成绩单如何办理
一比一原版(AIS毕业证)奥克兰商学院毕业证成绩单如何办理
 

Capital Structure Analysis

  • 1. CAPITAL STRUCTURE ANALYSIS OF INDIAN AUTOMOBILE INDUSTRY
  • 2. Introduction: Automobile Industry Overview  The automobile industry is vital to the growth of the Indian economy.  In the last decade their share in the Indian economy is around 5% of GDP.  Economic progress is indicated by the amount of goods and services produced which gives an impetus for transportation and boost the sale of vehicles.  Main segment in Indian Automobile Industry:-  Passenger vehicles: Cars and buses  Commercial vehicles: Goods carrier , MUV, SUV, Minivans, Trucks, Tippers  Three wheelers: Rickshaws, Trolleys, Delivery Vans  Two wheelers: Scooters, Motorcycles and Mopeds
  • 3. Sample Companies  Maruti Suzuki India Limited : Subsidiary of Suzuki Motor Corporation, Japan. Market leader in passenger vehicles. Capability to produce over 1.5 million vehicles annually.  Tata Motors Limited is India's largest automobile company, with consolidated revenues of INR 1,65,654 crores (USD 32.5 billion) in 2011-12. It is the leader in commercial vehicles in each segment, and among the top in passenger vehicles.  Bajaj Auto Limited : Product range encompasses scooterettes, scooters and motorcycles. The company’s worth is around US$3.4 billion.  Mahindra & Mahindra Limited (M&M) : operations span 18 key industries that form the foundation of every modern economy: aerospace, aftermarket, agribusiness, automotive, components etc.  Hero Motocorp Limited : Indian motorcycle and scooter manufacturer based in New Delhi, India. Hero Honda started in 1984 as a joint venture between Hero Cycles of India and Honda of Japan. In 2010, when Honda decided to move out of the joint venture, Hero Group bought the shares held by Honda. Subsequently, in August 2011 the company was renamed Hero Moto Corp with a new corporate identity.
  • 4. Objectives of Study  To assess the capital structure of the selected companies.  To know the status of capital structure among selected automobile industries  To determine the long-term profitability of the selected companies.  To assess the change in proportion of debt and equity.  To offer suitable suggestions for framing effective capital structure to meet the requirement of the selected companies.  Period of the study:- The study covers a period of five years from 2007-08 to 2011 -2012. Tools Used Following tools used:-  Leverage analysis(Combined Leverage) 1. Operating Leverage 2. Financial Leverage  Cost of capital analysis 1. Cost of Equity 2. Cost of Debt  Ratio analysis 1. Debt- Equity Ratio 2. Long Term Debt- Equity Ratio 3. Interest Coverage Ratio 4. Fixed Assets Turnover Ratio 5. Return on Net Worth 6. Return on long term fund 7. Return on Capital Employed
  • 6. Operating Leverage Year Company Name 2007- 08 2008- 09 2009- 10 2010- 11 2011- 12 Mean Maruti Suzuki 0.86 1.17 0.95 0.97 0.93 0.98 Tata Motors 0.64 0.61 0.66 0.75 0.63 0.66 Bajaj Auto 0.92 1.01 0.97 0.97 0.96 0.97 Mahindra & Mahindra 0.83 1.08 0.97 0.93 0.82 0.93 Hero Motocorp 1.01 0.98 1.00 0.99 0.97 0.99 Mean 0.85 0.97 0.91 0.92 0.86 0.90  Operating leverage refers to the relationship between firm’s sales revenue and its earnings before interest and tax.  Where, contribution= sales-variable cost. O.L = Contribution/Earning before interest and tax.  Hero Moto Corp : Ranges from 0.97 to 1.01.  Maruti Suzuki : Ranges from 0.86 to 1.17.  Bajaj Auto : Ranges from 0.92 to 1.01.  Tata Motors : Ranges from 0.63 to 0.75.  Tata Motors has low rate of operating leverage, which indicates a low interest outflow and consequently lower borrowings.
  • 7. Financial Leverage: Year Company Name 2007-08 2008- 09 2009- 10 2010- 11 2011-12 Mean Maruti Suzuki 1.05 1.18 1.06 1.12 1.41 1.16 Tata Motors 1.50 0.12 1.80 2.60 3.36 1.88 Bajaj Auto 0.63 1.14 1.04 0.75 0.93 0.90 Mahindra & Mahindra 0.93 1.25 1.09 1.01 1.08 1.07 Hero Motocorp 0.97 0.98 0.97 1.08 1.27 1.05 Mean 1.02 0.93 1.19 1.31 1.61 1.21 • Financial leverage can be described as the extent to which a business or investor is using the borrowed money. • Tata Motors has greater financial leverage in terms of average for five years. • Bajaj Auto has low financial leverage which indicates good among all selected companies.
  • 9. Cost of Equity Year Company Name 2007-08 2008-09 2009-10 2010-11 2011-12 Mean Maruti Suzuki 0.96 0.22 0.42 0.81 0.50 0.58 Tata Motors 47.15 3.78 5.74 11.21 1.28 13.83 Bajaj Auto 10.22 2.50 2.60 2.51 2.11 3.99 Mahindra & Mahindra 8.37 1.85 1.22 1.68 1.34 2.89 Hero Motocorp 2.36 1.16 5.54 5.51 2.37 3.39 Mean 13.81 1.90 3.10 4.34 1.52 4.94 • Equity is the permanent capital for a firm. • Cost of equity of Maruti Suzuki was at high level 0.96 in 2007-08 and at low level 0.22 in 2008-09 • In Bajaj Auto cost of equity was at high level 10.20 in 2007-08 and at low level 2.11 in 2011-12.
  • 10. Cost of Debt Year Company Name 2007- 08 2008- 09 2009- 10 2010- 11 2011- 12 Mean Maruti Suzuki 6.62 7.30 4.08 7.89 5.12 6.20 Tata Motors 7.51 5.35 7.50 8.70 11.07 8.03 Bajaj Auto 0.39 1.34 0.45 0.52 22.81 5.10 Mahindra & Mahindra 3.39 3.31 5.45 2.95 5.13 4.05 Hero Motocorp 10.20 16.61 16.87 1.90 3.36 9.79 Mean 5.62 6.78 6.87 4.39 9.50 6.63 • A company may raise debt in various ways. It may be in the form of debenture or loan borrowed from financial or public institutions for a certain period of time at a specific rate of interest. • Hero Motocorp has greater cost of debt in term of average for five years, which is reported 9.79 • Among all selected companies Mahindra & Mahindra has low cost of debt which indicates use of debt financing with low interest rate whereas Hero Motocorp borrow debt financing with high rate of interest.
  • 12. Debt Equity Ratio Years Company Name 2007- 08 2008- 09 2009- 10 2010- 11 2011- 12 Mean Maruti Suzuki 0.06 0.07 0.04 0.02 - 0.04 Tata Motors 0.50 0.49 0.80 0.52 0.41 0.54 Bajaj Auto 0.84 0.71 0.45 0.03 0.02 0.46 Mahindra & Mahindra 0.63 0.83 0.46 0.32 0.26 0.50 Hero Motocorp 0.04 0.02 0.02 0.50 0.23 0.16 Mean 0.41 0.42 0.35 0.37 0.18 0.34 • Debt – Equity ratio indicates the relationship between the external equities (or) outsider’s funds and the internal equities (or) the shareholders funds. • Among all the companies selected Maruti Suzuki has low debt-equity ratio which indicates sufficient protection to long-term lenders or a safe position of long-term lenders point of view.
  • 13. Long – Term Debt Equity Ratio Years Company Name 2007- 08 2008- 09 2009- 10 2010- 11 2011- 12 Mean Maruti Suzuki 0.06 0.07 0.04 0.02 - 0.04 Tata Motors 0.50 0.49 0.80 0.52 0.41 0.54 Bajaj Auto 0.84 0.71 0.45 0.03 0.02 0.46 Mahindra & Mahindra 0.63 0.83 0.46 0.32 0.26 0.50 Hero Motocorp 0.04 0.02 0.02 0.50 0.23 0.16 Mean 0.41 0.42 0.35 0.37 0.18 0.34  Long-Term Debt to Equity expresses the degree of protection provided by the owners for long-term creditors.  Tata Motors has greater debt-equity ratio in term of average for five years, which is reported 0.54 and it is followed by Mahindra & Mahindra and Bajaj Auto along with average of 0.50 and 0.46 respectively.  The ratio of Maruti Suzuki has been found at high level 0.07 in 2008-09 and at low level 0 in 2011-12  Thus it can be concluded that lower the ratio the better it is and we can see this in case of Maruti Suzuki.
  • 14. Interest Coverage Ratio Years Company Name 2007- 08 2008- 09 2009- 10 2010- 11 2011- 12 Mea n Maruti Suzuki 40.93 34.21 105.3 9 126.0 4 39.85 69.28 Tata Motors 6.28 2.43 2.61 2.64 3.70 3.53 Bajaj Auto 224.9 1 53.71 421.0 6 2093. 39 177.3 3 594.0 8 Mahindra & Mahindra 14.64 9.69 18.90 48.36 23.02 23 Hero Motocorp 648.1 5 664.4 0 1262. 36 146.7 3 123.6 5 569.0 6 Mean 187 153 362 483.4 3 73.51 251.8 0  Interest coverage ratio gives an indication of company ability to serve its fixed funding after all expenses. An interest coverage ratio of 6 or 7 times is considered appropriate  It ranges from 73.51 to 483.43 during the five years (2008 to 2012). It was at highest level (483.43) in the accounting year 2010-11, whereas it has been reported at low level (73.51)  Among all selected companies Bajaj Auto has high interest coverage ratio which indicates the secure position of lenders is in respect of payment of interest regularly and the lowest value is Hero Motorcorp
  • 15. Fixed Asset Turnover Ratio Year Company Name 2007- 08 2008- 09 2009 -10 2010 -11 2011- 12 Mea n Maruti Suzuki 2.48 2.38 2.82 3.13 2.46 2.65 Tata Motors 2.69 1.29 1.24 1.42 1.64 1.66 Bajaj Auto 2.95 2.60 3.50 4.85 5.75 3.93 Mahindra & Mahindra 3.22 2.84 3.85 4.08 4.32 3.66 Hero Motocorp 5.89 5.34 6.29 3.70 4.05 5.54 Mean 3.45 2.89 3.54 3.44 3.64 3.40  The fixed assets turnover ratio measures the efficiency with which fixed assets are employed.  The ratio for all auto corps ranges between 2.89 to 3.64 in the study period. It was at highest level 3.64 in the accounting year of 2011-12, whereas it has been reported at low level 2.89 in 2008-09  It can be concluded that on an average basis Hero Motocorp has high fixed assets turnover ratio which indicates better utilization of fixed assets and it is opposite for Tata Motors
  • 16. Return on Net Worth Year Company Name 2007- 08 2008- 09 2009- 10 2010- 11 2011- 12 Me an Maruti Suzuki 20.56 13.04 21.10 16.50 10.76 16.3 9 Tata Motors 25.98 8.09 15.15 9.06 6.42 12.9 4 Bajaj Auto 47.61 38.92 58.14 68.01 49.72 52.4 8 Mahindra & Mahindra 25.51 16.03 26.74 25.92 23.80 23.6 0 Hero Motocorp 32.41 33.72 64.41 65.21 55.43 50.2 4 Mean 30.41 21.96 37.11 36.94 29.23 31.1 3  The return on long-term return funds ratio establishes the relationship between net profit and long- term funds  The ratio for all auto corps ranges between 23.91- 40.61 during the study period. It was at highest level (40.61) in the accounting year of 2009-10 and it has been reported at low level (23.91) in 2008-09  Based on the table it can be concluded that, on an average basis Bajaj auto and Hero Motocorp have been reveals satisfactory relationship between its net profit and long-term funds. On the contrary Maruti Suzuki and Mahindra & Mahindra have not been found satisfactory return on long term fund.
  • 17. RETURN ON LONG TERM FUND  The ratio for all auto corps ranges between 23.91 – 40.61 during 2007-12.  It was the highest level (40.61) in the accounting year of 2009-10 and it has been reported the low level (23.91) in 2008- 09.  Bajaj Auto has greater return on long-term funds in terms of average which is reported 53.63.  The ratio of Hero Motocorp was at highest level 75.07 in 2009-10 and lowest level 41.57 in 2007-08.  We conclude that on an average basis Bajaj auto and Hero Motocorp have been satisfactory relationship between its net profit and long-term funds. Year Company Name 2007-08 2008-09 2009-10 2010-11 2011-12 Mean Maruti Suzuki 27.35 17.48 28.80 21.74 14.48 21.97 Tata Motors 22.85 8.89 12.26 12.01 11.49 13.50 Bajaj Auto 39.71 35.36 59.19 69.67 64.24 53.63 Mahindra & Mahindra 19.64 14.51 27.73 27.05 23.58 22.50 Hero Motocorp 41.57 43.33 75.07 52.13 49.83 52.39 Mean 30.22 23.91 40.61 36.52 32.72 32.80
  • 18. RETURN ON CAPITAL EMPLOYED  ROCE indicates the efficiency and profitability of a company’s capital investments.  Bajaj Auto and Hero Motocorp has greater average return on capital employed which is reported 52.67,52.39 respectively.  ROCE for Bajaj Auto and Hero Motocorp was at high level of 67.57 and 75.07 respectively.  Among all auto corps Bajaj Auto and Hero Motocorp reflects the sound profitability of the business. Year Company Name 2007-08 2008-09 2009-10 2010-11 2011-12 Mean Maruti Suzuki 26.18 17.37 27.89 21.69 13.52 21.33 Tata Motors 18.96 6.41 10.37 10.19 10.36 11.26 Bajaj Auto 39.71 32.80 59.01 67.57 64.24 52.67 Mahindra & Mahindra 18.52 13.99 27.70 26.96 23.58 22.15 Hero Motocorp 41.57 43.33 75.07 52.13 49.83 52.39 Mean 29.00 22.78 40.01 35.71 32.31 32
  • 19. SUGGESTION  Tata Motors total risk was high , so it should increase its equity to reduce the risk.  All the selected companies should try to maintain their debt-equity proportion at the same level.  Bajaj Auto must give special attention to increase the earnings per share to safeguard and improve the welfare of its shareholders.  Tata Motors and Maruti Suzuki should try to reduce their operating expenses and financial burden to convert revenue into actual profit.
  • 20. CONCLUSION  Tata Motors has low rate of operating leverage, indicates a low interest outflow and lower borrowings.  Mahindra & Mahindra has low cost of debt which indicates use of debt financing with low interest whereas it is high in case of Hero Motocorp.  Low debt-equity ratio made out in case of Maruti Suzuki and high debt-equity ratio exercised by Tata Motors.  Bajaj Auto has high interest coverage ratio which indicates the secure position in respect of payment of interest regularly.  Hero Motocorp has high fixed assets turnover ratio which indicates better utilization of fixed assets.  Comparing overall performance of the five companies selected it is Hero Motocorp which has displayed a steady and constant performance over the past five years.