
Recommended
Recommended
More Related Content
What's hot
What's hot (20)
Viewers also liked
Viewers also liked (20)
Similar to Project, Program & Portofolio Management Contribution, an Article from the PMI Indonesia Chapter Board for Excellentia Edition 37 by Rahmat Mulyana
Similar to Project, Program & Portofolio Management Contribution, an Article from the PMI Indonesia Chapter Board for Excellentia Edition 37 by Rahmat Mulyana (20)
Recently uploaded
Recently uploaded (20)
Project, Program & Portofolio Management Contribution, an Article from the PMI Indonesia Chapter Board for Excellentia Edition 37 by Rahmat Mulyana
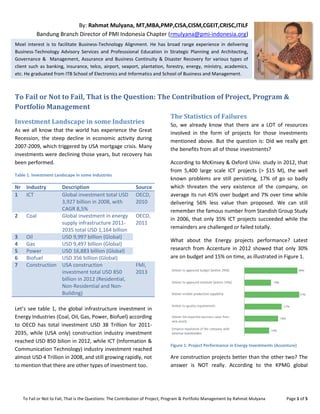
- 1. To Fail or Not to Fail, That is the Questions: The Contribution of Project, Program & Portfolio Management by Rahmat Mulyana Page 1 of 5 To Fail or Not to Fail, That is the Question: The Contribution of Project, Program & Portfolio Management Investment Landscape in some Industries As we all know that the world has experience the Great Recession, the steep decline in economic activity during 2007-2009, which triggered by USA mortgage crisis. Many investments were declining those years, but recovery has been performed. Table 1. Investment Landscape in some Industries Nr Industry Description Source 1 ICT Global investment total USD 3,927 billion in 2008, with CAGR 8,5% OECD, 2010 2 Coal Global investment in energy supply infrastructure 2011- 2035 total USD 1,164 billion OECD, 2011 3 Oil USD 9,997 billion (Global) 4 Gas USD 9,497 billion (Global) 5 Power USD 16,883 billion (Global) 6 Biofuel USD 356 billion (Global) 7 Construction USA construction investment total USD 850 billion in 2012 (Residential, Non-Residential and Non- Building) FMI, 2013 Let’s see table 1, the global infrastructure investment in Energy Industries (Coal, Oil, Gas, Power, Biofuel) according to OECD has total investment USD 38 Trillion for 2011- 2035, while (USA only) construction industry investment reached USD 850 bilion in 2012, while ICT (Information & Communication Technology) industry investment reached almost USD 4 Trillion in 2008, and still growing rapidly, not to mention that there are other types of investment too. The Statistics of Failures So, we already know that there are a LOT of resources involved in the form of projects for those investments mentioned above. But the question is: Did we really get the benefits from all of those investments? According to McKinsey & Oxford Univ. study in 2012, that from 5,400 large scale ICT projects (> $15 M), the well known problems are still persisting, 17% of go so badly which threaten the very existence of the company, on average its run 45% over budget and 7% over time while delivering 56% less value than proposed. We can still remember the famous number from Standish Group Study in 2006, that only 35% ICT projects succeeded while the remainders are challenged or failed totally. What about the Energy projects performance? Latest research from Accenture in 2012 showed that only 30% are on budget and 15% on time, as illustrated in Figure 1. Figure 1. Project Performance in Energy Investments (Accenture) Are construction projects better than the other two? The answer is NOT really. According to the KPMG global By: Rahmat Mulyana, MT,MBA,PMP,CISA,CISM,CGEIT,CRISC,ITILF Bandung Branch Director of PMI Indonesia Chapter (rmulyana@pmi-indonesia.org) Moel interest is to facilitate Business-Technology Alignment. He has broad range experience in delivering Business-Technology Advisory Services and Professsional Education in Strategic Planning and Architecting, Governance & Management, Assurance and Business Continuity & Disaster Recovery for various types of client such as banking, insurance, telco, airport, seaport, plantation, forestry, energy, ministry, academics, etc. He graduated from ITB School of Electronics and Informatics and School of Business and Management.
- 2. To Fail or Not to Fail, That is the Questions: The Contribution of Project, Program & Portfolio Management by Rahmat Mulyana Page 2 of 5 research in 2013, 77% of executives surveyed say that their organisation is experiencing underperforming projects. There are some main causes such as project delays (51%), poor estimating practices (50%), failed risk management processes (47%), poor subcontractor performance (37%), design errors and omissions (36%), lack of available resources (20%), change in project management team (17%) and poor client relations (16%), as illustrated in Figure 2. Figure 2. Project Performance in Construction Investments (KPMG) It’s all about Value, Risk & Resources There is no silver bullet to solve all those underperforming and failures. But the research in ICT field performed by CISR MIT Sloan (2002), Harvard (2005), ITGI (2011), etc. showed that better Governance & Management practices are the answer for this problem. Its enhancement has correlation impact with improving business competitiveness until higher profits performance as illustrated in Figure 3. Figure 3. Correlation Between IT Score and Business Performance Actually there are 3 main objectives regarding Governance & Management practices which are: Benefit (Value) Realisation and Risk & Resources Optimisation. Figure 4. IT Governance & Management (ISO 38500) RESOURCE OPTIMISATION is about how to make effective and efficient use of the assets that we bought, created and operated in the governance (evaluate, direct and monitor), project management and operations practices as illustrated in Figure 4, such as applications, infrastructures, human resources and data & information. RISK OPTIMISATION is about how to best mitigate the impact of uncertainty in achieving our objectives. Our task is not to eliminate risk (remember that risk is comparable with returns) but maintaining it optimally under our risk appetite so when the worst case happened we can still tolerate its impact. The hardest part is BENEFIT REALISATION since this is the most neglected part of the objective. Project management is exist to deliver unique deliverables which created from initialisation until closing, and these are the common practices. But what happened when it is delivered, going live and giving back to the investors? This is actually the beginning of benefit realisation until the assets are diminished by depreciation and amortisation. The survey conducted by CIO Magazine showed that only a few who performed it consistently. The key point here is benefit must be realised and overcoming the total cost of ownership.
- 3. To Fail or Not to Fail, That is the Questions: The Contribution of Project, Program & Portfolio Management by Rahmat Mulyana Page 3 of 5 The Seven Enabler of Success In order to achieve the three objectives of Governance & Management mentioned above, there are seven enabler that should be addressed as illustrated in Figure 5. Figure 5. The Seven Enabler of Governance & Management (COBIT 5) The first enabler is Principles, Policies and Framework. Regarding this enabler, PMI has released many best practices framework to its constituents such as the famous PMBOK 5 (2013), the Standard of Program Management Third Ed (2013), the Standard of Portfolio Management Thied Ed (2013) and Organisational PM Maturity Model (OPM3) Third Ed (2013), as illustrated in Figure 6. This framework should be addressed in the Enterprise principles which usually placed in Strategic Plan and the Enterprise Policies. Figure 6. Best Practice Framework from PMI The second enabler is Processes. The portfolio, program and project management processes and also the monitoring & evaluation processes from OPM3 should be derived from the Policies and the Frameworks in the form of Guidance, SOP (Standards & Procedures) and Working Instruction which is suitable for our organisation. The third enabler is Organisational Structures. Again, please do remember, there are no structures that fit for all, but there are some generic guidance available, such as not creating superman which has too much power (remember power tend to corrupt), use SOD-based ARCI chart (Accountable, Responsible, Consulted, Informed), use dual control, use compensating control if SOD is violated, etc. There are some structure good practices such as the implementation of PMO (Program and Project Management Office), Program & Project Steering Committee, Risk Management and Compliance Division, Internal Audit Division (remember Three Lines of Defense and Internal Consulting, not WATCHDOG), External Audit, etc. The forth enabler is Culture, Ethics and Behaviour. Good practice for creating, encouraging and maintaining desired behaviour throghout the enterprise include communication of the underlying corporate values, awareness which strengthened by the example behaviour exercised by senior management/champions. Incentives to encourage and deterrents to enforce, clear link between behaviour and reward scheme, etc. The fifth enabler is Information, which usually way be more effective and efficient if delivered and supported by the sixth enabler which is Services, Application and Infrastructure represented by the adequate Enterprise Architecture and Information System used by the Enterprise, in this case Portfolio and Program & Project Management tools. Figure 7. Portfolio and Program & Project Management (Forrester)
- 4. To Fail or Not to Fail, That is the Questions: The Contribution of Project, Program & Portfolio Management by Rahmat Mulyana Page 4 of 5 There are so many tools which could be used to support Portfolio and Program & Project Management but usually organizations rarely use a single tool for both purposes as illustrated in Figure 7. Lets do the Right Things: Portfolio Management According to ISO 21500:2012, a portfolio is a collection of projects and programmes and other work that are grouped together to facilitate the effective management of that work to meet strategic goals. Portfolio management is about DOING THE RIGHT THINGS. It should be cascaded from the Enterprise Strategy, and then becoming direction for program and project execution, until the deliverables are operated as illustrated in Figure 8. Figure 8. Cascading from Strategy into Operation (OPM3) There are some tools which can help us implementing the Portfolio Management good practices. Latest research from Forrester in 2012 in the form of the famous Forrester Wave showed that the leaders are CA, Planview, HP and Daptiv, while the others are strong performers such as Planisware, Microsoft, Clarizen, AtTask, Rally as illustrated in Figure 9. Figure 9. Portfolio Management Tools (Forrester) By performing portfolio management then we will have an evaluated and prioritized list regarding the program & project based on matrix of urgency and importance as illustrated in Figure 10. Figure 10. Portfolio of Program & Project Bubble Board (KPMG) Lets do Things Right: Program & Project Management After we have selected and prioritized the strategic initiatives of program and project in the form of portfolio, then the next job is DOING THINGS RIGHT. The more complex the project, the more important the right tool. There are so many tools available, according to Forrester Wave illustrated in Figure 11, the leaders are Planview, HP, CA, Microsoft, Rally, Daptiv and the strong performers are AtTask, Clarizen and Planisware.
- 5. To Fail or Not to Fail, That is the Questions: The Contribution of Project, Program & Portfolio Management by Rahmat Mulyana Page 5 of 5 Figure 11. Program & Project Management Tools (Forrester) The system should provide adequate control of project management practice such as WBS, Gantt Chart, Resource, Sharing, Document/ Storage, Communication, Discussion, Alert, Reporting as illustrated in Figure 12. Figure 12. Project Management Tools Example The Opportunity Lies A”head” Last but not least, the seventh enabler is People, Skills and Competency. Located in the last does not mean that it is less important, instead it is the key to operate all of the enablers mentioned before, it is the BRAINWARE that make all of them are possible to be performed. Regarding the competency, it is divided into two categories which are soft competence and hard competence. Spencer defines 20 soft competency compiled in 6 category such as Achievement & Action, Helping & Human Service, Impact & Influence, Managerial, Cognitive and Personal Effectiveness. While for hard competence it is depend on the related- field of project management. In IT field could use SFIA (Skill Framework of Information Age), European e- Competency Framework (ECF), NWCET Skill Standards for IT, IPA Japan IT Skill Standards, as illustrated in Figure 13. Figure 13. Project & Portfolio Management Competency (ECF) The skills should be standardized by related-certification such as CAPM, PMP, PgMP, PMI-RMP, PMI-SP and PMI- ACP from Project Management Institute. Please do remember that all of these enablers are controls which should be implemented adequately to mitigate our risk based on our appetite. Too much controls will slow us down (overkilling), but too less will make us vulnerable, for example to fraud, underperformance, failures, etc. That’s it for now, hopefully this article will serve you right =RM=