architectural structures
•
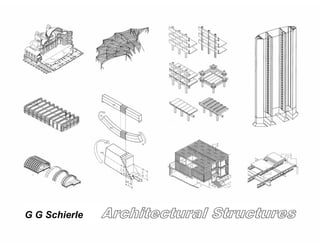
15 likes•5,524 views

Ebook Architecture Structures giới thiệu đặc điểm chịu lực của kết cấu thép, kế cấu gỗ, kết cấu bê tông. Quyển sách giới thiệu cấu trúc của một số công trình cao tầng điển hình trên thế giới.

Recommended
Recommended
More Related Content
What's hot
What's hot (18)
Viewers also liked
Viewers also liked (20)
Similar to architectural structures
Similar to architectural structures (20)
More from Hi House
More from Hi House (19)
Recently uploaded
Recently uploaded (20)
architectural structures
- 1. G G Schierle Architectural Structures
- 2. G G Schierle Architectural Structures Excerpts ISBN 0-18-195009-x Copyright © G Schierle 1990-2006. All rights reserved Portions of this document reproduce sections from the 2003 International Building Code, International Code Council, Falls Church, Virginia. All rights reserved. AISC data, copyright © American Institute of Steel Construction, Inc. Reprinted with permission. All rights reserved USGS data copyright © United States Geological Survey, courtesy USGS University of Southern California Custom Publishing C/O Chauncey Jemes Los Angeles, CA 90089-2540 e-mail:jemes@usc.edu Tel. 213-740-8946 Fax: 213-740-7686
- 3. Preface To foster informed intuition for structures, this book has many illustrations visualizing structural behavior and to complement and clarify mathematical concepts. While the book is primarily targeted for students of architecture, it also serves as reference book for students of civil engineering, and professional architects, engineers, and contractors. The book is organized in six parts. Part I starts with an introduction of key developments in the historic evolution of structures and proceeds to introduce loads on buildings and basic systems to resist them. Part II introduces fundamentals: statics and strength of material, as well as analysis and design of basic elements, such as beams and columns. Part III introduces design methods: ASD and LRFD; design of masonry (ASD) and concrete (strength method); design for wind and seismic forces; as well as conceptual design, explored on case studies. Part IV introduces structure systems for horizontal spans, categorized by bending, axial, form, and tensile resistance. All systems are introduced with conceptual diagrams, describing their structural behavior and alternate options. Case studies describe their use in real projects. Part V introduces vertical structures in similar fashion. Part VI introduces material properties and details for wood, steel, masonry, concrete, and membrane structures. Appendices include math derivation, graphs and tables. Text and graphics are correlated on the same page for easy reading and comprehension. Prerequisites for the book are algebra, trigonometry, and Newtonian physics. The book can be used in courses of statics and strength of material, structure systems and structural materials. Math derivations visualized help understanding and to introduce concepts also to readers with more artistic or visual modes of learning. The book includes many graphs to streamline complex tasks. The graphs, which feature US and SI units to facilitate correlation, include: • Design graphs for span limits and span/depth ratios • Column design graphs • Seismic design graphs • Wind design graphs Acknowledgements I am grateful to many students and others for various contributions to this book, ranging from suggestions to illustrations; most notably drawings by Bronne Dytog and June Yip; but also Xiaojun Cheng. Lucia Ho, Maki Kawaguchi, Ping Kuo, Jennifer Lin, Sassu Mitra, Rick Patratara, Shina Rau, Srinivas Rau, Madhu Thangavelu, and Sharmilla Thanka. Students that provided data and comments include Laura Mae Bryan, Sabina Cheng, Samy Chong, Claudia Chiu, Kristin Donour, Miriam Figueroa, Ping Han, Nick Ketpura, Samuel Kuo, Jason Mazin, Neha Sivaprasad, Timothy Petrash, Musette Profant, Katie Rahill, Reed Suzuki, Bogdan Tomalevski, Carole Wong, Nasim Yalpani. Others that provided comments or material: include: Andrea Cohen Gehring, Jeff Guh, Robert Harris, Theo Heizmann, Helge Wang, Will Shepphird, Robert Timme, Matt Warren, and Walter Winkle. Architects and engineers that provided drawings include: Norman Foster, Von Gerkan Marg, Arata Isozaki, David Lawrence Gray, Paul M. Kaufmann, Pierre Koenig, Panos Koulermos, Edward Niles, Jörg Schlaich, James Tyler, Widom Wein Cohen, and Dimitry Vergun. To my family Copyright G Schierle, 1990-2006
- 4. Units SI * units (metric) US units Remark Conversion factor ** Remark Length Millimeter mm 25.4 Inch in Centimeter cm 10 mm 30.48 Foot ft 12 in Meter m 1000 mm 0.9144 Yard yd 3 ft Kilometer km 1000 m 1.609 Mile mi 5280 ft Area Square millimeter mm2 645.16 Square in in2 Sq. centimeter cm2 100 mm2 929 Square foot ft2 144 in2 Square meter m2 1 Mil 0.835 Sq. yard yd2 9 ft2 Hectar ha 10000 m2 2.472 Acre Acre = 4840 yd2 Volume Cubic millimeter mm3 16387 Cubic inch in3 Cubic centimeter cm3 1 k mm3 28317 Cubic foot ft3 Cubic meter m3 1 Mil cm3 0.7646 Cubic yard yd3 Liter l 0.001 m3 0.264 Gallon US gal = 3.785 liter Mass Gram g 28.35 Ounce oz Kilogram kg 1000 g 0.4536 Pound Lb, # 16 oz Tonn t 1000 kg 0.4536 Kip k 1000 # Force / load Newton N 4.448 Pound Lb, # Kilo Newton kN 1000 N 4.448 Kip k 1000 # Newton/ meter N/m 14.59 Pound/ ft plf Kilo Newton/ m kN/m 14.59 Kip/ ft klf 1000 plf Stress Pascal= N/m2 Pa 6895 Pound/ in2 psi Kilo Pascal kPa 1000 Pa 6895 Kip / in2 ksi 1000 Fabric stress Kilo Newton / m kN/m 175 Pound/ in Lb/in Fabric Load / soil pressure Kilo Pascal kPa 1000 Pa 47.88 Pound/ ft2 psf Moment Newton-meter N-m 1.356 Pound-foot Lb-ft, #’ Kilo Newton-m kN-m 1000 N- 1.356 Kip-foot k-ft, k’ 1000#’ Temperature Celcius °C .55(F-32) Fahrenheit °F Water freezing 0°C = 32°F Water boiling 100°C = 212°F * SI = System International (French - designation for metric system) ** Multiplying US units with conversion factor = SI units Dividing SI units by conversion factor = US units Prefixes Prefix Factor Micro- 0.000001 MIli-, m 0.00001 Centi- 0.01 Deci- 0.1 Semi-, hemi-, demi- 0.5 Uni- 1 Bi-, di- 2 Tri-, ter- 3 Tetra-, tetr-, quadr- 4 Pent-, penta-, quintu- 5 Sex-, sexi-, hexi-, hexa-, 6 Hep-, septi-, 7 Oct-, oct-, octa-, octo- 8 Non-, nona- 9 Dec-, deca-, deci, deka- 10 Hect-, hector- 100 Kilo-, k 1,000 Mega-, M 1,000,000 Giga-, G 1,000,000,000 Tera- 1,000,000,000,000 Copyright G Schierle, 1990-2006
- 5. Contents PART I: BACKGROUND 1 Historic Evolution 1-2 Walls 1-6 Post-and-beam 1-10 Arch, Vault, Dome 1-21 Suspended 1-24 Truss 1-26 Skyscraper 2 Loads 2-2 Introduction 2-2 Dead load 2-4 Live load 2-5 Seismic load 2-6 Wind load 2-8 Tributary load and load path 3 Basic Concepts 3-2 Synergy, Strength, Stiffness, Stability 3-3 Rupture length 3-4 Horizontal structures Slab, plate, deck (one & two-way) Beam, arch and cable Truss 3-9 Vertical/lateral structures Wall Cantilever Moment frame Braced frame PART II: MECHANICS 4 Statics 4-2 Force and moment 4-3 Static equilibrium 4-4 Supports 4-5 Reactions 4-10 Static determinacy 4-13 Vector analysis 4-15 Truss analysis 4-17 Funicular 4-21 Vector reactions 5 Strength Stiffness Stability 5-2 Force types 5-3 Force vs. stress 5-4 Allowable stress 5-5 Axial stress 5-6 Shear stress 5-8 Torsion 5-9 Principal stress 5-10 Strain 5-10 Hook’s law 5-11 Elastic Modulus 5-14 Thermal strain 5-14 Thermal stress 5-17 Stability 6 Bending 6-4 Bending and shear 6-8 Equilibrium method 6-10 Area method 6-13 Indeterminate beams 6-14 Flexure formula 6-15 Section modulus 6-16 Moment of inertia 6-18 Shear stress 6-22 Deflection 7 Buckling 7-3 Euler formula 7-3 Slenderness ratio 7-4 Combined stress 7-5 Kern 7-6 Arch and vault 7-7 Wood buckling 7-12 Steel buckling PART III: DESIGN METHODS 8 ASD, LRFD, Masonry and Concrete Design 8-2 ASD (Allowable Stress Design) 8-3 LRFD (Load Resistance Factor Design) 8-4 Masonry design (ASD) 8-10 Concrete strength design (LRFD) Copyright G Schierle, 1990-2006
- 6. 9 Lateral Force Design 9-2 Design for wind 9-8 Seismic design 9-13 SD-graphs 9-15 Analysis steps 9-18 Vertical distribution 9-19 Horizontal diaphragms 9-22 Eccentricity 9-23 Hazard configurations 9-24 Stability issues 9-27 Seismic safety items 10 Conceptual Design 10-1 System selection 10-3 Global moment and shear 10-4 Radial pressure 10-5 Examples 10-7 Case studies 10-15 Portal method 10-17 Moment frame 10-19 Braced frame 10-21 Test models 10-23 Sample projects 10-29 Computer aided design PART IV: HORIZONTAL SYSTEMS 11 Bending Resistant 11-1 Bending concepts 11-3 Beam optimization 11-5 Joist, beam, girder 11-11 Vierendeel 11-17 Folded plate 11-22 Cylindrical shell 12 Axial Resistant 12-2 Truss Truss configurations Prismatic truss Folded truss 12-13 Space truss 12-22 Tree structures 13 Form-Resistant 13-2 Funicular concepts 13-4 Arch 13-10 Vault 13-17 Dome 13-23 Grid shell 13-29 HP shell 13-37 Freeform shell 14 Tensile Resistant 14-1 Tension members 14-2 Prestress 14-3 Stayed structures 14-8 Propped structures 14-10 Suspended structures 14-17 Cable truss 14-21 Anticlastic structures 14-42 Pneumatic structures PART V: VERTICAL SYSTEMS 15 General Background 15-2 Tall structures 15-3 Gravity load 15-4 Lateral load 15-7 Structure systems 15-11 Floor framing 15-12 Beam-column interaction 16 Shear Resistant 16-2 Classic walls 16-3 Seismic failures 16-4 Shear walls 16-6 Shear wall stability 16-7 Wood shear walls 16-10 Shear wall reinforcing 17 Bending Resistant 17-2 Cantilever 17-6 Moment frame 17-13 Framed tube 17-16 Bundled tube Copyright G Schierle, 1990-2006
- 7. 18 Axial Resistant 18-2 Braced frame 18-8 Belt truss and outrigger 18-12 Braced tube 18-16 Eccentric braced frame 19 Suspended high-rise 19-2 Suspension rational 19-3 Design options 19-3 Limits 19-4 Case studies PART VI: MATERIAL 20 Wood 20-1 Material 20-5 Heavy timber 20-13 Grid structures Balloon framing Platform framing 20-29 Projects 21 Steel 21-1 Material 21-7 Heavy steel 21-29 Light gauge steel 21-33 Projects 22 Masonry 22-1 Material 22-7 Brick masonry 22-18 Concrete masonry 22-22 Stone masonry 22-23 Projects 23 Concrete 23-1 Material 23-4 Reinforced concrete 23-17 Prestressed concrete 23-20 Precast concrete 23-24 Tilt-up concrete 23-26 Projects 24 Fabric and cables 24-1 Material 24-2 Fabric 24-4 Cables 24-10 Projects Appendix A: Beam Formulas A-2 Beam formulas A-3 Bending coefficients Appendix B: Geometric Properties B-2 Centroid B-4 Moment of Inertia B-6 Parallel Axis Theorem B-7 Radius of Gyration B-8 Geometric properties Appendix C: Lateral Design Data C-2 Wind design data C-7 Seismic design data Appendix D: Material and Buckling Data D-2 Wood D-8 Steel Appendix E: Design Tables E-2 Span Ranges for Structure Elements E-3 Span Ranges for Structure Systems Copyright G Schierle, 1990-2006
- 8. 3-1 BACKGROUND Basic Concepts 3 Basic Concepts This chapter on basic concept introduces: • Structural design for: • Strength • Stiffness • Stability • Synergy • Rupture length (material properties, i.e., structural efficiency) • Basic structure systems • Horizontal structures • Vertical / lateral structures for: o Gravity load o Lateral load Copyright G Schierle, 1990-2006
- 9. 3-2 BACKGROUND Basic Concepts Strength, Stiffness, Stability, Synergy Structures must be designed to satisfy three Ss and should satisfy all four Ss of structural design – as demonstrated on the following examples, illustrated at left. 1 Strength to prevent breaking 2 Stiffness to prevent excessive deformation 3 Stability to prevent collapse 4 Synergy to reinforce architectural design, described on two examples: Pragmatic example: Beam composed of wooden boards Philosophical example: Auditorium design Comparing beams of wooden boards, b = 12” wide and d = 1”deep, each. Stiffness is defined by the Moment of Inertia, I = b d3/12 1 board, I = 12x13/12 I = 1 10 boards I = 10 (12x13/12) I = 10 10 boards glued, I = 12x103/12 I = 1000 Strength is defined by the Section modulus, S = I/(d/2) 1 board, S = 1/o.5 S = 2 10 boards, S = 10/0.5 S = 20 10 boards, glued, S =1000/5 S = 200 Note: The same amount of material is 100 times stiffer and 10 times stronger when glued together to transfer shear and thereby engage top and bottom fibers in compression and tension (a system, greater than the sum of its parts). On a philosophical level, structures can strengthen architectural design as shown on the example of an auditorium: • Architecturally, columns define the circulation • Structurally, column location reduces bending in roof beams over 500% ! Copyright G Schierle, 1990-2006
- 10. 3-3 BACKGROUND Basic Concepts Rupture length Rupture length is the maximum length a bar of constant cross section area can be suspended without rupture under its weight in tension (compression for concrete & masonry). Rapture length defines material efficiency as strength / weight ratio: R = F / λ R = rupture length F = breaking strength λ = specific gravity (self weight) Rupture length, is of particular importance for long-span structures. The depth of horizontal span members increases with span. Consequently the weight also increases with span. Therefore the capacity of material to span depends on both its strength and weight. This is why lightweight material, such as glass fiber fabrics are good for long- span structures. For some material, a thin line extends the rupture length to account for different material grades. The graph data is partly based on a study of the Light weight Structures Institute, University Stuttgart, Germany Copyright G Schierle, 1990-2006
- 11. 3-4 BACKGROUND Basic Concepts Horizontal structures Horizontal systems come in two types: one way and two way. Two way systems are only efficient for spaces with about equal span in both directions; as described below. The diagrams here show one way systems at left and two way systems at right 1 Plywood deck on wood joists 2 Concrete slab on metal deck and steel joists 3 One way concrete slab 4 One way beams 5 One way rib slab 6 Two way concrete plate 7 Two way concrete slab on drop panels 8 Two way concrete slab on edge beams 9 Two way beams 10 Two way waffle slab 11 Deflection ∆ for span length L1 12 Deflection ∆=16 due to double span L2 = 2 L1 Note: Deflection increases with the fourth power of span. Hence for double span deflection increase 16-fold.. Therefore two way systems over rectangular plan are ineffective because elements that span the short way control deflection and consequently have to resist most load and elements that span the long way are very ineffective. 11 12 Copyright G Schierle, 1990-2006
- 12. 3-5 BACKGROUND Basic Concepts Trusses Trusses support load much like beams, but for longer spans. As the depth and thus dead weight of beams increases with span they become increasingly inefficient, requiring most capacity to support their own weight rather than imposed live load. Trusses replace bulk by triangulation to reduce dead weight. 1 Unstable square panel deforms under load. Only triangles are intrinsically stable polygons 2 Truss of triangular panels with inward sloping diagonal bars that elongate in tension under load (preferred configuration) 3 Outward sloping diagonal bars compress (disadvantage) 4 Top chords shorten in compression Bottom chords elongate in tension under gravity load 5 Gable truss with top compression and bottom tension Copyright G Schierle, 1990-2006
- 13. 3-6 BACKGROUND Basic Concepts Warren trusses Pompidou Center, Paris by Piano and Rogers Prismatic trusses IBM Sport Center by Michael Hopkins (Prismatic trusses of triangular cross section provide rotational resistance) Space trusses square and triangular plan Note: Two way space trusses are most effective if the spans in the principle directions are about equal, as described for two-way slabs above. The base modules of trusses should be compatible with plan configuration (square, triangular, etc.) Copyright G Schierle, 1990-2006
- 14. 3-7 BACKGROUND Basic Concepts Funicular structures The funicular concept can be best described and visualized with cables or chains, suspended from two points, that adjust their form for any load in tension. But funicular structures may also be compressed like arches. Yet, although funicular tension structures adjust their form for pure tension under any load, funicular compression structures may be subject to bending in addition to compression since their form is rigid and not adaptable. The funicular line for tension and compression are inversely identical; the form of a cable becomes the form of an arch upside-down. Thus funicular forms may be found on tensile elements. 1 Funicular tension triangle under single load 2 Funicular compression triangle under single load 3 Funicular tension trapezoid under twin loads 4 Funicular compression trapezoid under twin loads 5 Funicular tension polygon under point loads 6 Funicular compression polygon under point load 7 Funicular tension parabola under uniform load 8 Funicular compression parabola under uniform load Copyright G Schierle, 1990-2006
- 15. 3-8 BACKGROUND Basic Concepts Vault IBM traveling exhibit by Renzo Piano A series of trussed arches in linear extrusion form a vault space The trussed arches consist of wood bars with metal connectors for quick assembly and disassembly as required for the traveling exhibit. Plastic panels form the enclosing skin, The trussed arches provide depth and rigidity to accommodate various load conditions Suspension roof Exhibit hall Hanover by Thomas Herzog Copyright G Schierle, 1990-2006
- 16. 3-9 BACKGROUND Basic Concepts Vertical structures Vertical elements Vertical elements transfer load from roof to foundation, carrying gravity and/or lateral load. Although elements may resist only gravity or only lateral load, most are designed to resist both. Shear walls designed for both gravity and lateral load may use gravity dead load to resist overturning which is most important for short walls. Four basic elements are used individually or in combination to resist gravity and lateral loads 1 Wall under gravity load 2 Wall under lateral load (shear wall) 3 Cantilever under gravity load 4 Cantilever under lateral load 5 Moment frame under gravity load 6 Moment frame under lateral load 7 Braced frame under gravity load 9 Braced frame under lateral load Copyright G Schierle, 1990-2006
- 17. 3-10 BACKGROUND Basic Concepts Vertical systems Vertical systems transfer the load of horizontal systems from roof to foundation, carrying gravity and/or lateral load. Although they may resist gravity or lateral load only, most resist both, gravity load in compression, lateral load in shear. Walls are usually designed to define spaces and provide support, an appropriate solution for apartment and hotel buildings. The four systems are: 1 Shear walls (apartments / hotels) 2 Cantilever (Johnson Wax tower by F L Wright) 3 Moment frame 4 Braced frame A Concrete moment resistant joint Column re-bars penetrate beam and beam re-bars penetrate column) B Steel moment resistant joint (stiffener plates between column flanges resist beam flange stress) Vertical / lateral element selection criteria Element Advantages Challenges Shear wall Architectural criteria Structural criteria Good for apartments/hotels Very stiff, good for wind resistance Inflexible for future changes Stiffness increases seismic forces Cantilever Architectural criteria Structural criteria Flexible planning Around cantilever Ductile, much like a tree trunk Must remain in future changes Too flexible for tall structures Moment frame Architectural criteria Structural criteria Most flexible, good for office buildings Ductile, absorbs seismic force Expensive, drift may cause problems Tall structures need additional stiffening Braced frame Architectural criteria Structural criteria More flexible then Shear walls Very stiff, good for Wind resistance Less flexible than moment frame Stiffness increases seismic forces B Copyright G Schierle, 1990-2006
- 18. 3-11 BACKGROUND Basic Concepts Shear walls As the name implies, shear walls resist lateral load in shear. Shear walls may be of wood, concrete or masonry. In the US the most common material for low-rise apartments is light-weight wood framing with plywood or particle board sheathing. Framing studs, spaced 16 or 24 inches, support gravity load and sheathing resists lateral shear. In seismic areas concrete and masonry shear walls must be reinforced with steel bars to resist lateral shear. 1 Wood shear wall with plywood sheathing 2 Light gauge steel shear wall with plywood sheathing 3 Concrete shear wall with steel reinforcing 4 CMU shear wall with steel reinforcing 5 Un-reinforced brick masonry (not allowed in seismic areas) 8 Two-wythe brick shear wall with steel reinforcing Copyright G Schierle, 1990-2006
- 19. 3-12 BACKGROUND Basic Concepts Cantilevers Cantilevers resist lateral load primarily in bending. They may consist of single towers or multiple towers. Single towers act much like trees and require large footings like tree roots to resist overturning. Bending in cantilevers increases from top down, justifying tapered form in response. 1 Single tower cantilever 2 Single tower cantilever under lateral load 3 Twin tower cantilever 4 Twin tower cantilever under lateral load 5 Suspended tower with single cantilever 6 Suspended tower under lateral load Copyright G Schierle, 1990-2006
- 20. 3-13 BACKGROUND Basic Concepts Moment frames Moment frames resist gravity and lateral load in bending and compression. They are derived from post-and beam portals with moment resisting beam to column connections (for convenience refered to as moment frames and moment joints). The effect of moment joints is that load applied to the beam will rotate its ends and in turn rotate the attached columns. Equally, load applied to columns will rotate their ends and in turn rotate the beam. This mutual interaction makes moment frames effective to resist lateral load with ductility. Ductility is the capacity to deform without breaking, a good property to resist earthquakes, resulting in smaller seismic forces than in shear walls and braced frames. However, in areas with prevailing wind load, the greater stiffness of shear walls and braced frames is an advantage, The effect of moment joints to resist loads is visualized through amplified deformation as follows: 1 Portal with pin joints collapses under lateral load 2 Portal with moment joints at base under lateral load 3 Portal with moment beam/column joints under gravity load 4 Portal with moment beam/column joints under lateral load 5 Portal with all moment joints under gravity load 6 Portal with all moment joints under lateral load 7 High-rise moment frame under gravity load 8 Moment frame building under lateral load I Inflection points (zero bending between negative and positive bending Note: deformations reverse under reversed load Copyright G Schierle, 1990-2006
- 21. 3-14 BACKGROUND Basic Concepts Braced frames Braced frames resist gravity load in bending and axial compression, and lateral load in axial compression and tension by triangulation, much like trusses. The triangulation results in greater stiffness, an advantage to resist wind load, but increases seismic forces, a disadvantage to resist earthquakes. Triangulation may take several configurations, single diagonals, A-bracing, V-bracing, X-bracing, etc., considering both architectural and structural criteria. For example, location of doors may be effected by bracing and impossible with X-bracing. Structurally, a single diagonal brace is the longest, which increases buckling tendency under compression. Also the number of costly joints varies: two for single diagonals, three for A- and V-braces, and five joints for X-braces. The effect of bracing to resist load is visualized through amplified deformation as follows: 1 Single diagonal portal under gravity and lateral loads 2 A-braced portal under gravity and lateral load 3 V-braced portal under gravity and lateral load 4 X-braced portal under gravity and lateral load 5 Braced frame building without and with lateral load Note: deformations and forces reverse under reversed load Copyright G Schierle, 1990-2006
- 22. 4-1 MECHANICS Statics Part II Mechanics Mechanics, as defined for the study of structures, is the behavior of physical systems under the action of forces; this includes both statics and dynamics. Dynamics is the branch of mechanics that deals with the motion of a system of material particles under the influence of forces. Dynamic equilibrium, also known as kinetic equilibrium, is the condition of a mechanical system when the kinetic reaction of all forces acting on it are in dynamic equilibrium. Statics is the branch of mechanics that deals with forces and force systems that act on bodies in equilibrium as described in the following. 4 Statics Statics is the branch of mechanics that deals with forces and force systems that act on bodies in equilibrium. Since buildings are typically designed to be at rest (in equilibrium), the subject of this book is primarily focused on statics. Even though loads like earthquakes are dynamic they are usually treated as equivalent static forces. Copyright G Schierle, 1990-2006
- 23. 4-2 MECHANICS Statics Force and Moment Force is an action on a body that tends to: • change the shape of an object or • move an object or • change the motion of an object US units: # (pound), k (kip) SI units: N (Newton), kN (kilo Newton) Moment is a force acting about a point at a distance called lever arm M =P L (Force x lever arm) The lever arm is measured normal (perpendicular) to the force. Moments tend to: • rotate an object or • bend an object (bending moment) US units: #’ (pound-feet), k’ (kip-feet), #” (pound-inch), k” (kip-inch) SI units: N-m (Newton-meter), kN-m (kilo-Newton-meter) 1 Gravity force (compresses the pyramid) 2 Pulling force (moves the boulder) 3 Moment = force times lever arm (M = P L) A Point about which the force rotates L Lever arm M Moment P Force Copyright G Schierle, 1990-2006
- 24. 4-3 MECHANICS Statics Static Equilibrium For any body to be in static equilibrium, all forces and moments acting on it must be in equilibrium, i.e. their sum must equal zero. This powerful concept is used for static analysis and defined by the following three equation of statics: Σ H = 0 (all horizontal forces must equal zero) Σ V = 0 (all vertical forces must equal zero) Σ M = 0 (all moments must equal zero) The equilibrium equations are illustrated as follows: 1 Horizontal equilibrium: pulling left and right with equal forces, mathematically defined as Σ H = 0 = + 100 – 100 = 0 2 Vertical equilibrium: pushing up with a force equal to a weight, mathematically defined as: Σ V = 0 = – 2 x 100 + 200 = 0 3 Moment equilibrium: balancing both sides of a balance board, mathematically defined as: Σ M = 0 = – 50# (8’) + 200# (2’) = - 400 + 400 = 0 Much of this book is based on the three equilibrium equations. Copyright G Schierle, 1990-2006
- 25. 4-4 MECHANICS Statics Supports For convenience, support types are described for beams, but apply to other horizontal elements, like trusses, as well. The type of support affects analysis and design, as well as performance. Given the three equations of statics defined above, ΣH=0, ΣV=0, and ΣM=0, beams with three unknown reactions are considered determinate (as described below) and can be analyzed by the three static equations. Beams with more than three unknown reactions are considered indeterminate and cannot be analyzed by the three static equations alone. A beam with two pin supports (1 has four unknown reactions, one horizontal and one vertical reaction at each support. Under load, in addition to bending, this beam would deform like a suspended cable in tension, making the analysis more complex and not possible with static equations. By contrast, a beam with one pin and one roller support (2) has only three unknown reactions, one horizontal and two vertical. In bridge structures such supports are quite common. To simplify analysis, in building structures this type of support may be assumed, since supporting walls or columns usually are flexible enough to simulate the same behavior as one pin and one roller support. The diagrams at left show for each support on top the physical conditions and below the symbolic abstraction. 1 Beam with fixed supports at both ends subject to bending and tension 2 Simple beam with one pin and one roller support subject to bending only 3 Beam with flexible supports, behaves like a simple beam Simple beams, supported by one pin and one roller, are very common and easy to analyze. Designations of roller- and pin supports are used to describe the structural behavior assumed for analysis, but do not always reflect the actual physical support. For example, a pin support is not an actual pin but a support that resists horizontal and vertical movement but allows rotation. Roller supports may consist of Teflon or similar material of low friction that allows horizontal movement like a roller. Copyright G Schierle, 1990-2006
- 26. 4-5 MECHANICS Statics Support symbols The diagrams show common types of support at left and related symbols at right. In addition to the pin and roller support described above, they also include fixed-end support (as used in steel and concrete moment frames, for example). Support types Degrees of freedom Support type Horizontal movement Vertical movement Rotation 1 Roller Free Fixed Free 2 Pin Fixed Fixed Free 3 Rigid Fixed Fixed Fixed Copyright G Schierle, 1990-2006
- 27. 4-6 MECHANICS Statics Reactions Support reactions for asymmetrical loads and/or supports are computed using the equations of statics, ΣH=0, ΣV=0, and ΣM=0. The following examples illustrate the use of the three equations to find reactions. 1 Weight lifter on balcony Assume: P = 400#, L = 6’ Σ V = 0 ↑ + R – P = 0 R = P R = 400 # Σ M = 0, + P L – M = 0 M = P L = 400 x 6 M =2,400 #’ 2. Flag pole Assume: H = 80# (wind load on flag) L = 20’ Σ H = 0 → + W – H = 0 H = W H = 80 # Σ M = 0 + W L + M = 0 M = - W L = - 80 x 20 M = -1,600 #’ Note: The negative moment implies, the positive moment arrow must be reversed 3 Tow truck Assume: P = 2k, C = 7’, L = 10’ Σ Ma = 0 + Rb L - P C = 0 Rb = P C / L = 2 x 7 / 10 Rb = 1.4k Σ Mb = 0 + Ra L - P (C+L) = 0 Ra = P (C+L) /L = 2 (7+10) / 10 Ra = +3.4k Check Σ V = 0 Σ V = 0 = +3.4 –1.4 –2 ΣV = 0 Note: The lever arm is always perpendicular to load Rb pointing downward is provided by the truck weight a b Ra Rb Copyright G Schierle, 1990-2006
- 28. 4-7 MECHANICS Statics Beam reactions To find reactions for asymmetrical beams: • Draw an abstract beam diagram to illustrate computations • Use Σ M = 0 at one support to find reaction at other support • Verify results for vertical equilibrium 1 Floor framing 2 Abstract beam diagram Assume: DL = 10 psf LL = 20 psf Σ = 30 psf Uniform beam load: w = 30 psf x 2’ w = 60 plf For convenience, substitute total beam load W for uniform load w at its centroid Total beam load W = w L = 60 (12+4) W = 960 # Support reactions: Σ M b = 0 + 12 Ra – 4 W = 0 Ra = 4 x 960 / 12 Ra = 320 # Σ Ma = 0 + 8 W – 12 Rb= 0 12 Rb = 8 x 960 Rb = 8 x 960 / 12 Rb = 640 # Check Σ V = 0 ↑+ Ra + Rb – W= 320 + 640 – 960 = 0 Σ V = 0 Alternate method (use uniform load directly) Support reactions: Σ M b = 0 + 12 Ra – 4 x 60 plf x 16’ = 0 Ra = 4 x 60 x 16 / 12 Ra = 320 # Σ M a = 0 + 8 x 60 x 16 – 12 Rb= 0 12 Rb = 8 x 60 x 16 Rb = 8 x 60 x 16 / 12 Rb = 640 # Check Σ V = 0 ↑+ Ra + Rb – W= 320 + 640 – 960 = 0 Σ V = 0 W=960 Copyright G Schierle, 1990-2006
- 29. 4-8 MECHANICS Statics 1 Simple beam with point loads Assume: P = 1.2k R = 5 P / 2 = 5 x 1.2 / 2 R = 3 k 2 Beam with overhang and point loads Assume: P = 2k Σ M b = 0 + 12 Ra - 2x16 - 2x12 - 2x8 - 2x4 = 0 Ra = (32 + 24 + 16 + 8) / 12 Ra = 6.67 k Σ Ma = 0 + -12 Rb - 2x4 + 2x4 + 2x8 + 2x12 = 0 Rb = (2 x 8 + 2 x 12) / 12 Rb = 3.33 k Check Σ V = 0 ↑+ 6.67 + 3.33 – 5 x 2 Σ V = 0 3 Beam with uniform load and point load (wall) Assume: w = 100 plf, P = 800# Σ M c = 0 + 16 Ra – 100x16x8 – 800x12 = 0 Ra = (100x16x8 + 800x12) / 16 Ra = 1,400 # Σ Ma = 0 + -16 Rc + 100x16x8 + 800 x 4 +800 x16 = 0 Rc = (100x16x8 + 800x4 +800 x16) / 16 Rc = 1800 # Check Σ V = 0 ↑ + 1400+1800-100x16-800-800 Σ V = 0 Copyright G Schierle, 1990-2006
- 30. 4-13 MECHANICS Statics Vector Analysis First used by Leonardo da Vinci, graphic vector analysis is a powerful method to analyze and visualize the flow of forces through a structure. However, the use of this method is restricted to statically determinate systems. In addition to forces, vectors may represent displacement, velocity, etc. Though only two-dimensional forces are described here, vectors may represent forces in three-dimensional space as well. Vectors are defined by magnitude, line of action, and direction, represented by a straight line with an arrow and defined as follows: Magnitude is the vector length in a force scale, like 1” =10 k or 1 cm=50 kN Line of Action is the vector slope and location in space Direction is defined by an arrow pointing in the direction of action 1 Two force vectors P1 and P2 acting on a body pull in a certain direction. The resultant R is a force with the same results as P1 and P2 combined, pulling in the same general direction. The resultant is found by drawing a force parallelogram [A] or a force triangle [B]. Lines in the vector triangle must be parallel to corresponding lines in the vector plan [A]. The line of action of the resultant is at the intersection of P1 / P2 in the vector plan [A]. Since most structures must be at rest it is more useful to find the equilibriant E that puts a set of forces in equilibrium [C]. The equilibriant is equal in magnitude but opposite in direction to the resultant. The equilibriant closes a force triangle with all vectors connected head-to-tail. The line of action of the equilibriant is also at the intersection of P1/P2 in the vector plan [A]. 2 The equilibriant of three forces [D] is found, combining interim resultant R1-2 of forces P1 and P2 with P3 [E]. This process may be repeated for any number of forces. The interim resultants help to clarify the process but are not required [F]. The line of action of the equilibriant is located at the intersection of all forces in the vector plan [D]. Finding the equilibriant for any number of forces may be stated as follows: The equilibriant closes a force polygon with all forces connected head-to-tail, and puts them in equilibrium in the force plan. 3 The equilibriant of forces without a common cross-point [G] is found in stages: First the interim resultant R1-2 of P1 and P2 is found [H] and located at the intersection of P1/P2 in the vector plan [G]. P3 is then combined with R1-2 to find the equilibriant for all three forces, located at the intersection of R1-2 with P3 in the vector plan. The process is repeated for any number of forces. Copyright G Schierle, 1990-2006
- 31. 4-14 MECHANICS Statics Vector components Vector components have the same effect on a body as the initial vector. Thus components relate to a vector as two vectors relate to a resultant or equilibriant. 1 The component forces C1 and C2 in two cables supporting a load P are found by drawing a force triangle [B] with corresponding lines parallel to the those in the vector plan [A]. 2 Forces in more than two cables supporting a load P are indeterminate [C] and cannot be found by graphic vector method since there are infinite number of solutions [D]. A problem with more than two unknown force components requires consideration of relative cable stiffness (cross-section area, length, and stiffness). Hence we can state: Only two components can be found by graphic vector method 3 This example demonstrates graphic vector analysis: Forces are drawn on a vector plan with line of action and direction [E]. The magnitude may be written on each vector or the vector may be drawn at a force scale. A force polygon [F] is drawn next at a force scale, such as 1” = 1k. For good accuracy, the force scale should be as large as space permits. The line of action of the equilibriant (or resultant) is then transposed into the vector plan at the intersection of all force vectors [E]. Copyright G Schierle, 1990-2006
- 32. 4-15 MECHANICS Statics Truss Analysis Graphic truss analysis (Bow’s Notation) is a method to find bar forces using graphic vectors as in the following steps: A Draw a truss scaled as large as possible (1) and compute the reactions as for beams (by moment method for asymmetrical trusses). B Letter the spaces between loads, reactions, and truss bars. Name bars by adjacent letters: bar BH between B and H, etc. C Draw a force polygon for external loads and reactions in a force scale, such as 1”=10 pounds (2). Use a large scale for accuracy. A closed polygon with head-to- tail arrows implies equilibrium. Offset the reactions to the right for clarity. D Draw polygons for each joint to find forces in connected bars. Closed polygons with head-to-tail arrows are in equilibrium. Start with left joint ABHG. Draw a vector parallel to bar BH through B in the polygon. H is along BH. Draw a vector parallel to bar HG through G to find H at intersection BH-HG. E Measure the bar forces as vector length in the polygon. F Find bar tension and compression. Start with direction of load AB and follow polygon ABHGA with head-to-tail arrows. Transpose arrows to respective bars in the truss next to the joint. Arrows pushing toward the joint are in compression; arrows pulling away are in tension. Since the arrows reverse for adjacent joints, draw them only on the truss but not on the polygon. G Draw equilibrium arrows on opposite bar ends; then proceed to the next joint with two unknown bar forces or less (3). Draw polygons for all joints (4), starting with known loads or bars (for symmetrical trusses half analysis is needed). 1 Truss diagram 2 Force polygon for loads, reactions, and the first joint polygon 3 Truss with completed tension and compression arrows 4 Completed force polygon for left half of truss 5 Tabulated bar forces (- implies compression) Copyright G Schierle, 1990-2006
- 33. 4-16 MECHANICS Statics Truss Example Some trusses have bars with zero force under certain loads. The example here has zero force in bars HG, LM, and PG under the given load. Under asymmetrical loads these bars would not be zero and, therefore, cannot be eliminated. Bars with zero force have vectors of zero length in the equilibrium polygon and, therefore, have both letters at the same location. Tension and compression in truss bars can be visually verified by deformed shape (4), exaggerated for clarity. Bars in tension will elongate; bars in compression will shorten. In the truss illustrated the top chord is in compression; the bottom chord is in tension; inward sloping diagonal bars in tension; outward sloping diagonal bars in compression. Since diagonal bars are the longest and, therefore, more likely subject to buckling, they are best oriented as tension bars. 1 Truss diagram 2 Force polygon 3 Tabulated bar forces (+ implies tension, - compression) 4 Deformed truss to visualize tension and compression bars A Bar elongation causes tension B Bar shortening causes compression Copyright G Schierle, 1990-2006
- 34. 4-17 MECHANICS Statics Funicular Graphic vector are powerful means to design funicular structures, like arches and suspension roofs; providing both form and forces under uniform and random loads. Arch Assume: Arch span L = 150, arch spacing e = 20’ DL = 14 psf LL = 16 psf Σ = 30 psf Uniform load w = 30 psf x 20’ / 1000 w = 0.6 klf Vertical reactions R = w L /2 = 0.6 x 150 / 2 R = 45 k Draw vector polygon, starting with vertical reaction R Horizontal reaction H = 56 k Max. arch force (diagonal vector parallel to arch tangent) F = 72 k 1 Arch structure 2 Parabolic arch by graphic method Process: Draw AB and AC (tangents of arch at supports) Divide tangents AB and AC into equal segments Lines connecting AB to AC define parabolic arch envelope 3 Arch profile Process: Define desired arch rise D (usually D = L/5) Define point A at 2D above supports AB and AC are tangents of parabolic arch at supports Compute vertical reactions R = w L /2 4 Equilibrium vector polygon at supports (force scale: 1” = 50 k) Process: Draw vertical vector (reaction R) Complete vector polygon (diagonal vector parallel to tangent) Measure vectors (H = horizontal reaction, F = max. arch force) Note: The arch force varies from minimum at crown (equal to horizontal reaction), gradually increasing with arch slope, to maximum at the supports. Copyright G Schierle, 1990-2006
- 35. 4-18 MECHANICS Statics Suspension roof Assume: Span L = 300, cable spacing e = 10’, sag f = 30’, height difference h = 50’ DL = 14 psf LL = 16 psf Σ = 30 psf Uniform load w = 30 psf x 10’ / 1000 w = 0.3 klf Total load W = w L = 0.3 x 300 R = 90 k Draw vector polygon, starting with total load W Horizontal reaction H = 113 k Vertical reactions Left reactions Rl = 26 k Right reaction Rr = 64 k Cable tension At left support Tl =115 k At right support (maximum) Tr = 129 k 1 Cable roof structure 2 Parabolic cable by graphic method Process: Draw AB and AC (tangents of cable at supports) Divide tangents AB and AC into equal segments Lines connecting AB to AC define parabolic cable envelop 3 Cable profile Process: Define desired cable sag f (usually f = L/10) Define point A at 2f below midpoint of line BC AB and AC are tangents of parabolic cable at supports Compute total load W = w L 4 Equilibrium vector polygon at supports (force scale: 1” = 50 k) Process: Draw vertical vector (total load W) Draw equilibrium polygon W-Tl-Tr Draw equilibrium polygons at left support Tl-H-Rl Draw equilibrium polygons at right support Tr-Rr-H Measure vectors H, Rl, Rr at force scale Note: This powerful method finds five unknowns: H, Rl, Rr. Tl. Tr The maximum cable force is at the highest support Copyright G Schierle, 1990-2006
- 36. 5-1 MECHANICS Strength Stiffness Stability 5 Strength Stiffness Stability This chapter introduces the theory and examples of strength, stiffness, and stability described n the following sections: Force types; force vs. stress; allowable stress; axial stress; shear stress; principle stress and Mohr’s circle; torsion; strain; Hooke’s law; Poisson’s ratio; creep, elastic modulus; thermal strain; thermal stress; and stability. Copyright G Schierle, 1990-2006
- 37. 5-2 MECHANICS Strength Stiffness Stability Force types Forces on structures include tension, compression, shear, bending, and torsion. Their effects and notations are tabulated below and all but bending and related shear are described on the following pages. Bending and related shear are more complex and further described in the next chapter. Type of forces Force type Action Symbol Notation Tension Elongates Internal reaction arrows + Compression Shortens Internal reaction arrows - Shear Sliding force Arrow couple Clockwise couple + Bending Elongates one side shortens other side Concave and convex arcs Concave arc + Convex arc - Torsion Twists Bar with arrows Right-hand-rule + 1 Axial force (tension and compression) 2 Shear 3 Bending 4 Torsion 5 Force actions 6 Symbols and notations A Tension B Compression C Shear D Bending E TorsionCopyright G Schierle, 1990-2006
- 38. 5-3 MECHANICS Strength Stiffness Stability Force vs. stress Force and stress refer to the same phenomena, but with different meanings. Force is an external action, measured in absolute units: # (pound), k (kip); or SI units: N (Newton), kN (kilo Newton). Stress is an internal reaction in relative units (force/area ), measured in psi (pound per square inch), ksi (kip per square inch); or SI units: Pa (Pascal), kPa (kilo Pascal). Axial stress is computed as: f = P / A where f = stress P = force A = cross section area Note: stress can be compared to allowable stress of a given material. • Force is the load or action on a member • Stress can be compared to allowable stress for any material, expressed as: F ≥ f (Allowable stress must be equal or greater than actual stress) where F = allowable stress f = actual stress The type of stress is usually defined by subscript: Fa, fa (axial stress, capital F = allowable stress) Fb, fb (bending stress, capital F = allowable stress) Fv, fv (shear stress, capital F = allowable stress) The following examples of axial stress demonstrate force and stress relations: 1 Wood column (compression) Assume: Force P = 2000#, allowable stress F = 1000 psi A = 2 x 2 = 4 in2 (cross section area) Stress f = P / A ‘ 2000# / 4 f = 500 psi 1000 > 500, ok 2 Steel rod (tension) Assume: P = 6 k, ½” rod, Fa = 30 ksi Cross section area A = π r2 = (0.5/2)2 π A = 0.2 in2 Stress f = P / A = 5 k / 0.2 f = 25 ksi 25 < 30, ok 3 Spiked heel on wood stair (compression) Assume: P = 200# (impact load), A = 0.04 in2, Fa= 400 psi Stress f = P / A = 200 / 0.04 f = 5000 psi 5000 >> 400. NOT ok Note: The heel would sink into the wood, yield it and mark an indentation Copyright G Schierle, 1990-2006
- 39. 5-5 MECHANICS Strength Stiffness Stability Axial stress Axial stress acts in the axis of members, such as columns. Axial tension is common in rods and cables; wile axial compression is common in walls and columns. The following examples illustrates axial design and analysis. Analysis determines if an element is ok; design defines the required size. The equation, fa = P/A, is used for analysis. The equation A = P/Fa, is used for design. Allowable stress, Fa, includes a factor of safety. 1 Crane cable design Assume: P = 12 k, Fa = 70 ksi Find required cable size Metallic cross section Am (cables are about 60% metallic) Am = P / Fa = 12 k / 70 ksi Am = 0.17 in2 Gross cable area Ag = Am/ 0.6 = 0.17 / 0.6 Ag = 0.28 in2 Cable size φ = 2 (A/π)1/2 = 2 (0.28 / π)1/2 = 0.6” use φ = 5/8” 2 Suspension hanger analysis (Hong Kong-Shanghai bank) Assume: load per floor P=227 k, Fa=30 ksi, level 1 A = 12 in2. level 6 A = 75 in2 Hanger stress Level 1: fa = P / A = 227 / 12 fa = 19 ksi < 30 Level 6: fa = 6 P / A = 6 x 227 / 75 fa = 18 ksi < 30 3 Post/footing analysis Assume: P = 12,000 #, 3’x3’x2’ footing at 150 pcf, 4x4 post (3.5”x3.5” actual) Allowable post stress Fa = 1000 psi, allowable soil pressure Fs = 2000 psf Post stress P/A = 12,000 # / (3.5”x 3.5”) fa = 980 psi < 1000 Soil pressure fs = P/A = (12,000 # + 3’x3’x2’x150 pcf)/ (3’x3’) fs = 1633 psf < 2000 4 Slab/wall/footing, analyze a 1’ wide strip Assume: allowable wall stress Fa = 360 psi; allowable soil pressure Fs=1500 psf Concrete slab, t =8” thick, L = 20’ span CMU wall, h =10’, DL = 80 psf, t = 8” nominal (7 5/8” = 7.625” actual) Slab load 100 psf DL+ 40 psf LL DL+LL =140 psf Load at wall base P = 140psf (20’/2) + 80 psf (10’) P = 2,200 # Wall stress fa = P / A = 2200 # / (12”x7.625”) fa = 24 psi < 360 Load on soil P = 2200 + 150 pcf x 2’ x 1’ P = 2,500 # Soil pressure fs = 2,500 # / (1’ x2’) fs = 1250 psf < 1500 Copyright G Schierle, 1990-2006
- 40. 5-6 MECHANICS Strength Stiffness Stability Shear stress Shear stress occurs in many situations, including the following examples, but also in conjunction with bending, described in the next chapter on bending. Shear stress develops as a resistance to sliding of adjacent parts or fibers, as shown on the following examples. Depending on the number of shear planes (the joining surface [A] of connected elements) shear is defined as single shear or double shear. A Shear plane B Shear crack 1 Single shear Assume: P = 3 k = 3000 #, 2”x4” wood bars with ½” bolt of Fv = 20 ksi Shear area (bolt cross section) A = π r2 = π (0.5/2)2 A = 0.2 in2 Shear stress fv = P / A = 3/ 0.2 fv = 15 ksi < 20 2 Check end block (A) Assume: Block length 6”, wood Fv = 95 psi, all other as above End block shear area A = 2x 2” x 6” A =24 in2 Shear stress fv = P / A = 3000# / 24 fv =125 psi > 95 NOT ok Required block length e = 125 x 6”/ 95 = 7.9: use e = 8 3 Double shear Assume: P = 22 k, 2 5/8” bolts of Fv = 20 ksi Shear area A = 4π r2 = 4 π (0.625/2)2 A = 1.2 in2 Shear stress fv = P / A = 22 / 1.2 fv = 18 ksi < 20 4 Double shear, glued Assume: P = 6000 #, Wood bars, Fv = 95 psi Shear area A = 2 x 4” x 8” A = 64 in2 Shear stress Fv = P / A = 6000 / 64 fv =94 psi < 95 5 Twin beam double shear Assume: P = R = 12 k, 2 ½“ bolts, Fv = 20 ksi Shear area A = 4π r2 = 4 π (0.5/2)2 A = 0.79 in2 Shear stress fv = P / A = 12 / 0.79 fv = 15 ksi < 20 6 Shear wall Assume: P = 20 k, 8” CMU wall, t = 7.625”, L = 8’, Fv = 30 psi Shear area A = 7.625” x 12” x 8 ‘ A =732 in2 Shear stress fv = P / A = 20,000 # / 732 fv = 27 psi < 30 Copyright G Schierle, 1990-2006
- 41. 5-8 MECHANICS Strength Stiffness Stability Torsion Torsion is very common in machines but less common in building structures. The examples here include a small detail and an entire garage. 1 Door handle Assume: P = 10 #, e = 3” Torsion moment M M = P e = 10 x 3 M = 30 #’ 2 Tuck-under parking Assume: Shear e =10’, base shear V = 12 k Torsion moment M M = V e = 12 k x 10’ M = 120 k’ Note: The torsion moment is the product of base shear v and lever arm e, the distance from center of mass to center of resistance (rear shear wall). In the past, torsion of tuck-under parking was assumed to be resisted by cross shear walls. However, since the Northridge Earthquake of 1994 where several buildings with tuck-under parking collapsed, such buildings are designed with moment resistant beam/column joints at the open rear side. Copyright G Schierle, 1990-2006
- 42. 5-9 MECHANICS Strength Stiffness Stability Principle stress Shear stress in one direction, at 45 degrees acts as tensile and compressive stress, defined as principle stress. Shear stress is zero in the direction of principle stress, where the normal stress is maximum. At any direction between maximum principle stress and maximum shear stress, there is a combination of shear stress and normal stress. The magnitude of shear and principle stress is sometimes required for design of details. Professor Otto Mohr of Dresden University develop 1895 a graphic method to define the relationships between shear stress and principle stress, named Mohr’s Circle. Mohr’s circle is derived in books on mechanics (Popov, 1968). Isostatic lines Isostatic lines define the directions of principal stress to visualize the stress trajectories in beams and other elements. Isostatic lines can be defined by experimentally by photo- elastic model simulation or graphically by Mohr’s circle. 1 Simple beam with a square marked for investigation 2 Free-body of square marked on beam with shear stress arrows 3 Free-body square with shear arrows divided into pairs of equal effect 4 Free-body square with principal stress arrows (resultant shear stress vectors) 5 Free-body square rotated 45 degrees in direction of principal stress 6 Beam with isostatic lines (thick compression lines and thin tension lines) Note: Under gravity load beam shear increases from zero at mid-span to maximum at supports. Beam compression and tension, caused by bending stress, increase from zero at both supports to maximum at mid-span. The isostatic lines reflect this stress pattern; vertical orientation dominated by shear at both supports and horizontal orientation dominated by normal stress at mid-span. Isostaic lines appear as approximate tension “cables” and compression “arches”.Copyright G Schierle, 1990-2006
- 43. 5-10 MECHANICS Strength Stiffness Stability Strain Strain is a deformation caused by stress, or change in temperature, described later. Strain may elongate or shorten a solid, depending on the type of stress. Hooke’s law Material expand and contract under tension and compression, respectively. The stress/strain relationship, called Hooke’s law after the English scientist Robert Hooke, who discovered it in the 17th century, has since been confirmed by many empirical tests. The Hooke’s law assumes isotropic material (equal properties in any direction). The stress/strain relation is visualized here by a spring, as substitute for rods as used in testing machines, to amplify the deformation. 1 Elongation due to tension 2 Shortening due to compression 3 Stress / strain graph L Unstressed length ∆L Strain (elongation or shortening under load) P Applied load ε Unit strain Epsilon (ε = ∆L/L) E Elastic modulus E = f / εf Stress f = P / A A Cross section area of assumed rod Copyright G Schierle, 1990-2006
- 44. 5-11 MECHANICS Strength Stiffness Stability Stress/strain relations Although stress/strain tests may be done for any materials, for convenience the following test description assumes a steel rod. After measuring the unstressed length, load is applied and the strain recorded. The load is then incrementally increased and all related elongations recorded on a Cartesian graph, strain on the horizontal axis, stress on the vertical axis. The recorded measure points are connected by a line. A straight line implies linear stress/strain relations, a curved line implies non-linear relations. Most structural materials are linear up to the proportional limit, and non-linear beyond that point. If the rod returns to its original length after the load is removed, the material is considered elastic; if it remains deformed it is considered plastic. The remaining deformation is the permanent set. Rubber is an elastic material; clay a plastic material. Some materials, such as steel, are elastic-plastic, i.e., up to the elastic limit steel is elastic; beyond the elastic limit it is plastic. The transition from elastic to plastic strain is also called yield point. Materials which deform much and absorb energy before breaking are considered ductile; materials which break abruptly are considered brittle. Mild steel is considered a ductile material; concrete is usually brittle. 1 Test loads 1 to 5 kip 2 Stress-strain graph (horizontal axis = strain, vertical axis = stress) 3 Linear material (linear stress/strain relation 4 Non-linear material (non-linear stress /strain relation) 5 Elastic material (returns to original size if unloaded, like rubber) 6 Plastic material (remains permanently deformed like clay) 7 Brittle material (breaks abruptly) 8 Ductile material (deforms and absorbs energy before breaking) Elastic modulus E E = f / ε = Elastic Modulus (defines material stiffness) f Stress ε Unit strain (ε = ∆L/L) S Permanent set (remaining strain after stress is removed) Derivation of working equation to compute strain: L f P L E AE ∆ =ε= = solving for ∆L ∆L = PL / AE The equation is used to compute strain due to load. It shows that strain: • Increases with increasing P and L • Increases inversely with A and E Copyright G Schierle, 1990-2006
- 45. 5-12 MECHANICS Strength Stiffness Stability Poisson’s ratio Poisson’s ratio is named after French scientist Poisson who defined it 1807 as ratio of lateral strain / axial strain. All materials shrink laterally when elongated and expand when compressed. Poisson’s ratio is defined as: ν = lateral strain / axial strain Based on empirical tests, Poisson’s ratio for most materials is in the range of 0.25 to 0.35; only rubber reaches 0.5, the maximum for isotropic material. Creep Creep is a time dependent strain, most critical in concrete where it is caused by moisture squeezed from pores under stress. Creep tends to diminish with time. Concrete creep may exceed elastic strain several times, as demonstrated by Case Study 9 of Northridge Earthquake failures (Schierle, 2002). Yet much research is needed to provide design data and guidelines regarding creep. Elastic modulus The elastic modulus E, also called modulus of elasticity or Young’s modulus Y, after English scientist Young, who defined it 1807. The term elastic modulus is actually a misnomer since it defines stiffness, the opposite of elasticity. Note: Since E=f/ε and ε is a ratio without units, the elastic modulus has the same units as stress 1 Poisson’s ratio effect 2 Creep deformation (C = creep, T = time) 3 Elastic / plastic stress / strain curve (E = elastic range, P = plastic range) 4 Abstract steel graph (A = proportional limit, B = elastic limit, C = yield point, CD = yield plateau, E = ultimate strength, F = breaking point) 5 Mild steel stress / strain curve 6 High strength steel stress / strain curve 7 Concrete stress / strain curve (compressive strengths: A=9 ksi, B=4 ksi, C=3 ksi) 8 Stress / strain of linearly elastic wood Allowable stress vs. elastic modulus (typically about 1:1000 ratio) Material Allowable stress (psi) Elastic modulus (psi) Wood 1,400 1,400,000 Steel 30,000 30,000,000 Masonry 1,500 1,500,000 Concrete 3,000 3,000,000 Copyright G Schierle, 1990-2006
- 46. 5-13 MECHANICS Strength Stiffness Stability Strain examples Elevator cables Assume 4 cables φ ½” each, 60% metallic areaBreaking strength Fy = 210 ksi Allowable stress (210 ksi / 3) Fa = 70ksi Elastic Modulus E = 16,000ksi L = 800’ each P = 8k Metallic area Am = 4 π r2 = 4 x .6 π (0.5/2)2 Am = 0.47in2 Stress f = P / A = 8 / 0.47 f = 17ksi 17 < 70, ok Elongation under load ∆L = PL / AE ∆L = 8k x 800” x 12” / (0.47x16000) ∆L = 10” 2 Suspended building 3 Differential strain Assume 10 stories @ 14’ = 10x14’x12” L = 1680” Average column stress f = 18 ksi Average strand stress f = 60 ksi Elastic modulus (steel) E = 29,000 ksi Elastic modulus (strand) E = 22,000 ksi ∆L = PL/AE, since f = P/A → ∆L = f L/E Column strain ∆L = 18ksi x 1680” / 29000 ∆L = 1” Strand strain ∆L = 60ksi x 1680” / 22000 ∆L = 4.6” Differential settlement ∆L = 5.6” 4 Shorten hangers under DL to reduce differential strain, or prestress strands to reduce ∆L by half Note: Differential strain is additive since both strains are downwards To limit differential strain, suspended buildings have <= 10 stories / stack Copyright G Schierle, 1990-2006
- 47. 5-14 MECHANICS Strength Stiffness Stability Thermal strain Unrestrained objects expand and contract if subjected to temperature increase and decrease, respectively. Thermal strain is defined by a coefficient α for each material. Thermal strain varies linearly with temperature variation. 1 Bar of initial length L 2 Thermal strain ∆L due to temperature increase, computed as: ∆L = α ∆t L where α = thermal coefficient (in/in/oF) [/oC (SI units)] ∆t = temperature increase (+) / decrease (-) L = initial length Thermal stress Thermal stress is caused when thermal strain is prevented by restrains. 3 Bar of initial length L 4 Elongation ∆L due to heat 5 Heated bar reduced to initial length by load P 6 Restrained bar under stress Thermal stress derivation: Since ∆L = PL / AE and f = P/A ∆L = f L / E → f = E ∆L/L ∆L = α ∆t L → f = E α ∆t L/L f = α ∆t E where f = thermal stress E = elastic modulus Coefficient of thermal expansion α and elastic modulus E Material US α (10-6/oF) US Eα (106psi) SI α (10-6/oC) SI Eα (106gPa) Aluminum 13 10 24 69 Steel 6.5 29 11.7 200 Concrete 6 3 – 4 11 20 – 28 Masonry 4 1 – 3 7 7 – 21 Wood 1.7 – 2.5 1.2 – 2.2 3.5 - 4.5 8 – 15 Glass 44 9.6 80 66 Plastics 68 - 80 0.3 – 0.4 122 - 144 2 – 2.8 Aluminum 13 10 24 70 Copyright G Schierle, 1990-2006
- 48. 5-16 MECHANICS Strength Stiffness Stability Thermal examples 1 Curtain wall Assume: Aluminum curtain wall, find required expansion joint ∆t = 100 o F (summer vs. winter temperature) 2 story mullion, L = 30’ x 12” = 360” α = 13 x 10-6 in/in/o F E = 10 x 10 6 psi Thermal strain ∆L = α ∆t L = 13 x 10-6 x 100 o x 360” ∆L = 0.47” Use ½” expansion joints 0.5 > 0.47 Assume ignorant designer forgets expansion joint Thermal stress: f = α ∆t E = 13x10-6x100x10x10-6 psi f = 13,000 psi Note: 106 and 10-6 cancel out and can be ignored 13,000 psi is too much stress for aluminum 2 High-rise building, differential expansion Assume: Steel columns exposed to outside temperature ∆t = 50oF (south vs. north temperature) L = 840’ (60 stories at 14’) α = 6.5 x 10⁻⁶ in/in/o F Differential expansion ∆L = α ∆t L = 6.5 x 10-6 x 50 o x 840’ x 12” ∆L = 3.3” Note: the differential expansion would cause bending stress 3 Masonry expansion joints (masonry expansion joints should be at maximum L = 100’) Assume Temperature variation ∆t = 70o F Joint spacing L=100’ x 12” L = 1200” Thermal coefficient α = 4x10⁻⁶/oF E-modulus E = 1.5x10⁶ psi Required joint width ∆L = α ∆t L = (4 x 10⁻⁶) 70o (1200”) ∆L = 0.34” Use 3/8” expansion joint 0.375 > 0.34 Check thermal stress without expansion joint f = α ∆t E f = 4x10-6 x 70o x 1.5x106 f = 280psi L Copyright G Schierle, 1990-2006
- 49. 5-17 MECHANICS Strength Stiffness Stability Stability Stability is more complex and in some manifestations more difficult to measure than strength and stiffness but can be broadly defined as capacity to resist: • Displacement • Overturning • Collapse • Buckling Diagrams 1-3 give a theoretical definition; all the other diagrams illustrate stability of conceptual structures. 1 Unstable 2 Neutral 3 Stable 4 Weak stability: high center of gravity, narrow base 5 Strong stability: low center of gravity, broad base 6 Unstable post and beam portal 7 Stable moment frame 8 Unstable T-frame with pin joint at base 9 Stable twin T-frames 1 2 3 Copyright G Schierle, 1990-2006
- 50. 5-19 MECHANICS Strength Stiffness Stability Buckling stability Buckling stability is more complex to measure than strength and stiffness and largely based on empirical test data.. This introduction of buckling stability is intended to give only a qualitative intuitive understanding. Column buckling is defined as function of slenderness and beam buckling as function of compactness. A formula for column buckling was first defined in the 18th century by Swiss mathematician Leonhard Euler. Today column buckling is largely based on empirical tests which confirmed Euler’s theory for slender columns; though short and stubby columns may crush due to lack of compressive strength. Beam buckling is based on empirical test defined by compactness, a quality similar to column slenderness. 1 Slender column buckles in direction of least dimension 2 Square column resist buckling equally in both directions 3 Blocking resists buckling about least dimension 4 Long and slender wood joist subject to buckling 5 blocking resists buckling of wood joist 6 Web buckling of steel beam 7 Stiffener plates resist web buckling A Blocking of wood stud B Blocking of wood joist C Stiffener plate welded to web P Load Copyright G Schierle, 1990-2006
- 51. 6-1 FUNDAMENTALS: Bending 6 Bending Bending elements are very common in structures, most notably as beams. Therefore, the theory of bending is also referred to as beam theory, not only because beams are the most common bending elements but their form is most convenient to derive and describe the theory. For convenience, similar elements, such as joists and girders, are also considered beams. Although they are different in the order or hierarchy of structures, their bending behavior is similar to that of beams, so is that of other bending elements, such as slabs, etc., shown on the next page. Thus, although the following description applies to the other bending elements, the beam analogy is used for convenience. Beams are subject to load that acts usually perpendicular to the long axis but is carried in bending along the long axis to vertical supports. Under gravity load beams are subject to bending moments that shorten the top in compression and elongate the bottom in tension. Most beams are also subject to shear, a sliding force, that acts both horizontally and vertically. Because beams and other bending elements are very common, the beam theory is important in structural design and analysis. As for other structural elements, beam investigation may involve analysis or design; analysis, if a given beam is defined by architectural or other factors; design, if beam dimensions must be determined to support applied loads within allowable stress and deflection. Both, analysis and design, require to find the tributary load, reactions, shear, and bending moment. In addition, analysis requires to find deflections, shear- and bending stress, and verify if they meet allowable limits; by contrast design requires sizing the beam, usually starting with an estimated size. The following notations are commonly used for bending and shear stress: fb= actual bending stress Fb= allowable bending stress fv= actual shear stress Fv= allowable shear stress Allowable stresses are given in building codes for various materials. Allowable stresses assumed in this chapter are: Wood Fb= 1450 psi (9998 kPa) Fv= 95 psi (655 kPa) Steel Fb= 22 ksi (152 MPa) Fv= 14 ksi (97 MPa) The more complex design and analysis of concrete and masonry will be introduces-later. Copyright G Schierle, 1990-2006
- 52. 6-4 FUNDAMENTALS: Bending Bending and Shear Although derivation and numeric examples are required to analyze and design beams, intuitive understanding is an important prerequisite to gain deeper insight into the behavior of beams. The following is an intuitive introduction to beam bending and shear. A simple beam with uniform load is used for convenience. Bending moment Gravity load on a simple beam shortens the top and elongates the bottom, causing compressive and tensile stresses at top and bottom, respectively; with zero stress at the neutral axis (N. A.). In beams of symmetrical cross-section, the neutral axis is at the center. The compressive and tensile stress blocks generate an internal force couple that resists the external bending moment caused by load. 1 Simple beam with pin and roller supports 2 Deformed beam under uniform gravity load 3 Free-body diagram with bending stress block that generates an internal force couple to resist the external bending moment caused by load Copyright G Schierle, 1990-2006
- 53. 6-5 FUNDAMENTALS: Bending Shear force With few exceptions, described later, shear coexists with bending. When shear is present it acts both horizontally and vertically at equal magnitude. In wood beams horizontal shear is more critical because wood’s shear capacity is much smaller parallel than perpendicular to the grain. 1 Beam under uniform load with shear cracks as they occur in some concrete beams near the supports where shear is maximum 2 Tendency of beam parts to slide vertically generates vertical shear stress that is zero at mid-span and increases to maximum at the supports where the vertical shear deformation is greatest 3 Tendency of beam layers to slide horizontally generates horizontal shear that is zero at mid-span and increases toward the supports. This is visualized, assuming a beam composed of several boards 4 Shear diagram reflects shear distribution over beam length 5 Unloaded beam marked with squares to visualize shear 6 Loaded beam with squares deformed into rhomboids due to shear 7 Horizontal and vertical shear couples on a square beam part are equal to balance rotational tendencies (ΣM = 0). Therefore, horizontal and vertical shear stresses are equal at any point on the beam. 8 Shear vectors generate compression and tension diagonal to the shear. This tends to generate diagonal tension cracks in concrete beams Copyright G Schierle, 1990-2006
- 54. 6-7 FUNDAMENTALS: Bending Bending and shear stress Bending and shear stresses in beams relate to bending moment and shear force similar to the way axial stress relates to axial force (f = P/A). Bending and shear stresses are derived here for a rectangular beam of homogeneous material (beam of constant property). A general derivation follows later with the Flexure Formula. 1 Simple wood beam with hatched area and square marked for inquiry 2 Shear diagram with hatched area marked for inquiry 3 Bending moment diagram with hatched area marked for inquiry 4 Partial beam of length x, with stress blocks for bending fb and shear fv, where x is assumed a differential (very small) length Reactions, found by equilibrium ΣM = 0 (clockwise +) at c: +12 Ra-3(8)=0; Ra=3(8)/12 Ra = 2 k at a: -12 Rc+3(4)=0; Rc=3(4)/12 Rc = 1 k Shear V, found by vertical equilibrium, ΣV=0 (upward +). right of a and left of b V= 0+2 V = 2 k right of b and left of c V= 2-3 V = -1 k Bending moment M, found by equilibrium ΣM=0 (clockwise +) at a: M = +2(0) M = 0 k’ at b: M = +2(4) M = 8 k’ at c: M = +2(12)-3(8) M = 0 k’ Bending stress fb is derived, referring to 4. Bending is resisted by the force couple C-T, with lever arm 2/3 d = distance between centroids of triangular stress blocks. C=T= fb bd/4, M= C(2d/3) = (fbbd/4)(2d/3) = fbbd2/6, or fb= M/(bd2/6); where bd2/6 = S= Section Modulus for rectangular beam; thus fb= M/S For our beam: S= bd2/6= 4(12)2/6= S = 96 in3 fb= M/S= 8(1000)12/96 * fb = 1000 psi * multiplying by 1000 converts kips to pounds, by 12 converts feet to inches. Shear stress fv is derived, referring to 4. Bending stress blocks pushing and pulling in opposite directions create horizontal shear stress. The maximum shear stress is fv=C/bx, where b = width and x = length of resisting shear plane. Shear at left support is V = R. Let M = bending moment at x, and fb= bending stress at x, then M = RX = VX, and fb=M/S=Vx/S. Substituting Vx/S for fb in C = fbbd/4, the compressive top force, yields C=(Vx/S)(bd/4). Thus fv=C/(bx) yields fv=(Vx/S)(bd/4)/(bx). Substituting bd2/6 for S yields bd V db Vbd bx bd bd Vx fv 4 6 6/ 4/4/ 6/ 222 === , or fv = 1.5 V / bd For the sample beam: fv = 1.5(2)1000/(4x12) fv = 63 psi 1 2 3 4 Copyright G Schierle, 1990-2006
- 55. 6-8 FUNDAMENTALS: Bending Equilibrium Method Cantilever beam with point load Assume a beam of length L = 10 ft, supporting a load P = 2 k. The beam bending moment and shear force may be computed, like the external reactions, by equations of equilibrium ΣH=0, ΣV= 0, and ΣM=0. Bending moment and shear force cause bending- and shear stress, similar to axial load yielding axial stress f= P/A. Formulas for bending- and shear stress are given on the next page and derived later in this chapter. 1 Cantilever beam with concentrated load V Shear diagram (shear force at any point along beam) M Bending moment diagram (bending moment at any point along beam) ∆ Deflection diagram (exaggerated for clarity) Reactions, found by equilibrium, ΣV=0 (up +) and ΣM=0 (clockwise +) at b ΣV= 0 = R–2= 0 R = 2 k at b ΣM= 0 = M–2(10)= 0 M = 20 k’ Shear V, found by vertical equilibrium, ΣV=0 (up +) right of a = left of b V= 0-2 V = - 2 k Left of a and right of b, shear is zero because there is no beam to resist it (reaction at b reduces shear to zero). Shear may be checked, considering it starts and stops with zero. Concentrated loads or reactions change shear from left to right of them. Without load between a and b (beam DL assumed negligible) shear is constant. Bending moment M, found by moment equilibrium, ΣM=0 (clockwise +) at a M = -2(0) = 0 k’ at mid-span M = -2(5) = -10 k’ at b M = -2(10) = -20 k’ The mid-span moment being half the moment at b implies linear distribution. The support reaction moment is equal and opposite to the beam moment. Deflection ∆ is described later. Diagrams visualize positive and negative bending by concave and convex curvature, respectively. They are drawn, visualizing a highly flexible beam, and may be used to verify bending. Copyright G Schierle, 1990-2006
- 56. 6-9 FUNDAMENTALS: Bending Simple beam with uniform load 1 Beam of L= 20 ft span, with uniformly distributed load w = 100 plf 2 Free-body diagram of partial beam x units long 3 Shear diagram 4 Bending moment diagram To find the distribution of shear and bending along the beam, we investigate the beam at intervals of 5’, from left to right. This is not normally required. Reactions R are half the load on each support due to symmetry R= w L/2 = 100 (20)/2 R= +1000 lbs Shear force Vx at any distance x from left is found using ∑ V = 0 ∑ V = 0; R - w x - Vx = 0; solving for Vx Vx = R - w x at x = 0’ V = 0 + Ra = 0 +1000 V = +1000 lbs at x = 5’ V = + 1000 - 100 (5) V = +500 lbs at x = 10’ V = + 1000 - 100 (10) V = 0 lbs at x = 15’ V = + 1000 - 100 (15) V = -500 lbs at x = 20’ V = + 1000 - 100 (20) V = -1000 lbs Bending moment Mx at any distance x from left is found by ∑ M = 0. ∑ M = 0; R x – w x (x/2) - Mx = 0; solving for Mx Mx = R x - w x2/2 at x = 0 M = 1000 (0) - 100 (0)2/2 M = 0 lb-ft at x = 5’ M = 1000 (5) - 100 (5)2/2 M = 3750 lb-ft at x = 10’ M = 1000 (10)-100 (10)2/2 M = 5000 lb-ft at x = 15’ M = 1000 (15)-100 (15)2/2 M = 3750 lb-ft at x = 20’ M = 1000 (20)-100 (20)2/2 M = 0 lb-ft Bending is zero at both supports since pins and rollers have no moment resistance. Since the bending formula Mx= Rx-wx2/2 is quadratic, bending increase is quadratic (parabolic curve) toward maximum at center, and decreases to zero at the right support. For simple beams with uniform load the maximum shear force is at the supports and the maximum bending moment at mid-span (x= L/2) are: Vmax = R = w L / 2 Mmax = (wL/2)L/2 – (wL/2)L/4 = 2wL2/8 - wL2/8, or Mmax = wL2 / 8 This formula is only for simple beams with uniform load. Verifying example: Mmax= wL2/8 = 100(20)2/8 Mmax= +5000 lbs-ft (same as above) Copyright G Schierle, 1990-2006
- 57. 6-10 FUNDAMENTALS: Bending Area Method The area method for beam design simplifies computation of shear forces and bending moments and is derived, referring to the following diagrams: 1 Load diagram on beam 2 Beam diagram 3 Shear diagram 4 Bending diagram The area method may be stated: • The shear at any point n is equal to the shear at point m plus the area of the load diagram between m and n. • The bending moment at any point n is equal to the moment at point m plus the area of the shear diagram between m and n. The shear force is derived using vertical equilibrium: ∑ V= 0; Vm - w x - Vn = 0; solving for Vn Vn = Vm-wx where w x is the load area between m and n (downward load w = negative). The bending moment is derived using moment equilibrium: ∑ M = 0; Mm + Vmx – w x x/2 - Mn = 0; solving for Mn Mn = Mm+Vmx-wx2/2 where Vmx – wx2/2 is the shear area between m and n, namely, the rectangle Vm x less the triangle w x2/2. This relationship may also be stated as Mn = Mm + Vx, where V is the average shear between m and n. By the area method moments are usually equal to the area of one or more rectangles and/or triangles. It is best to first compute and draw the shear diagram and then compute the moments as the area of the shear diagram. From the diagrams and derivation we may conclude: • Positive shear implies increasing bending moment. • Zero shear (change from + to -) implies peak bending moment (useful to locate maximum bending moment). • Negative shear implies decreasing bending moment. Even though the forgoing is for uniform load, it applies to concentrated load and non- uniform load as well. The derivation for such loads is similar. Copyright G Schierle, 1990-2006
- 58. 6-11 FUNDAMENTALS: Bending Examples The following wood beams demonstrate the area method for design and analysis. For design, a beam is sized for given loads; for analysis, stresses are checked against allowable limits, or how much load a beam can carry. Beam design V Shear diagram. M Bending diagram. ∆ Deflection diagram. I Inflection point (change from + to - bending). Reactions R= 400plf (24)/2 R = 4800 lbs Shear Va = 0 Va = 0 lbs Vbl = 0 -400(5) Vbl = -2000 lbs Vbr = -2000 + 4800 Vbr = +2800 lbs Vcl = +2800 - 400(14) Vc l= -2800 lbs Vcr = -2800 + 4800 Vcr = +2000 lbs Vd = +2000 - 400(5) Vd = 0 lbs, ok Moment Ma = 0 Mb = 0 -2000 (5)/2 Mb = -5000 lb-ft Mb-c = -5000+ 2800 (7)/2 Mb-c = +4800 lb-ft Mc = +4800 - 2800 (7)/2 Mc = -5000 lb-ft Md = - 5000+ 2000 (5)/2 Md = 0, ok Try 4x10 beam S= (3.5) 9.252/6 S = 50 in3 Bending stress fb = Mmax/S= 5000 (12)/50 f b = 1200 psi 1200 < 1450, ok Shear stress fv = 1.5V/bd=1.5(2800)/[3.5(9.25)] f v = 130 psi 130 > 95, not ok Try 6x10 beam fv = 1.5V/bd=1.5 (2800)/[5.5 (9.25)] f v= 83 psi 83 < 95, ok Note: increased beam width is most effective to reduce shear stress; but increased depth is most effective to reduce bending stress. Copyright G Schierle, 1990-2006
- 59. 6-12 FUNDAMENTALS: Bending Beam analysis Reactions Σ Mc = 0 = +16 Rb - 1000 (20) - 300 (4) 18 - 200 (16) 8 16 Rb = 1000(20) + 300 (4) 18 + 200 (16) 8 Rb = (20000 + 21600 + 25600)/16 Rb = +4200 lbs Σ Mb = 0 = -16 Rc -1000(4) - 300(4)2 + 200(16)8 16 Rc = -1000(4) - 300(4)2 + 200(16) 8 Rc = (-4000 -2400 + 25600)/16 = Rc = +1200 lbs Shear Var = 0 - 1000 Var= -1000 lbs Vbl = -1000 - 300 (4) Vbl = -2200 lbs Vbr = -2200 + 4200 Vbr= +2000 lbs Vcl = +2000 - 200(16) = -Rc Vcl= -1200 lbs Vcr = -1200 + 1200 Vcr= 0 lbs Find x, where shear = 0 and bending = maximum: Vbr-w2 x = 0; x = Vbr/w2 = 2000/200 x = 10 ft Moment Ma = 0 Mb = 0 + 4 (-1000 -2200)/2 Mb = -6400 lb-ft Mx = -6400 + 10 (2000)/2 Mx = +3600 lb-ft Mc = +3600 + (16-10)(-1200)/2 Mc = 0 Section modulus S = bd2/6 = (3.5)11.252/6 S = 74 in3 Bending stress fb = M/S= 6400(12)/74 fb = 1038 psi 1038 < 1450, ok Shear stress fv = 1.5V/(bd) = 1.5(2200)/[3.5(11.25)] f v = 84 psi 84 < 95 = ok Note: stress is figured, using absolute maximum bending and shear, regardless if positive or negative. Lumber sizes are nominal, yet actual sizes are used for computation. Actual sizes are ½ in. less for lumber up to 6 in. nominal and ¾ in. less for larger sizes: 4x8 nominal is 3½x7¼ in. actual. Note: in the above two beams shear stress is more critical (closer to the allowable stress) than bending stress, because negative cantilever moments partly reduces positive moments. Copyright G Schierle, 1990-2006
- 60. 6-13 FUNDAMENTALS: Bending Indeterminate beams Indeterminate beams include beams with fixed-end (moment resistant) supports and beams of more than two supports, referred to as continuous beams. The design of statically indeterminate beams cannot be done by static equations alone. However, bending coefficients, derived by mechanics, may be used for analysis of typical beams. The bending moment is computed, multiplying the bending coefficients by the total load W and span L between supports. For continuous beams, the method is limited to beams of equal spans for all bays. The coefficients here assume all bays are loaded. Coefficients for alternating live load on some bays and combined dead load plus live load on others, which may result in greater bending moments, are in Appendix A. Appendix A also has coefficients for other load conditions, such as various point loads. The equation for bending moments by bending coefficients is: M = C L W M = bending moment C = bending coefficient L = span between supports W = w L (total load per bay) w = uniform load in plf (pounds / linear foot 1 Simple beam 2 Fixed-end beam (combined positive plus negative moments equal the simple-beam moment) 3 Two-span beam 4 Three-span beam Copyright G Schierle, 1990-2006
- 61. 6-14 FUNDAMENTALS: Bending Flexure Formula The flexure formula gives the internal bending stress caused by an external moment on a beam or other bending member of homogeneous material. It is derived here for a rectangular beam but is valid for any shape. 1 Unloaded beam with hatched square 2 Beam subject to bending with hatched square deformed 3 Stress diagram of deformed beam subject to bending Referring to the diagram, a beam subject to positive bending assumes a concave curvature (circular under pure bending). As illustrated by the hatched square, the top shortens and the bottom elongates, causing compressive stress on the top and tensile stress on the bottom. Assuming stress varies linearly with strain, stress distribution over the beam depth is proportional to strain deformation. Thus stress varies linearly over the depth of the beam and is zero at the neutral axis (NA). The bending stress fy at any distance y from the neutral axis is found, considering similar triangles, namely fy relates to y as f relates to c; f is the maximum bending stress at top or bottom and c the distance from the Neutral Axis, namely fy / y = f / c. Solving for fy yields fy = y f / c To satisfy equilibrium, the beam requires an internal resisting moment that is equal and opposite to the external bending moment. The internal resisting moment is the sum of all partial forces F rotating around the neutral axis with a lever arm of length y to balance the external moment. Each partial force F is the product of stress fy and the partial area a on which it acts, F = a fy. Substituting fy = y f / c, defined above, yields F = a y f / c. Since the internal resisting moment M is the sum of all forces F times their lever arm y to the neutral axis, M = F y = (f/c) Σ y y a = (f/c) Σ y2a, or M = I f/c, where the term Σy2a is defined as moment of inertia (I = Σy2a) for convenience. In formal calculus the summation of area a is replaced by integration of the differential area da, an infinitely small area: I = ∫ y2da I = moment of inertia. The internal resisting moment equation M = I f/c solved for stress f yields f = M c / I the flexure formula, which gives the bending stress f at any distance c from the neutral axis. A simpler form is used to compute the maximum fiber stress as derived before. Assuming c as maximum fiber distance from the neutral axis yields: f = M / S S = I/c = section modulus Both the moment of inertia I and section modulus S define the strength of a cross-section regarding its geometric form. Copyright G Schierle, 1990-2006
- 62. 6-15 FUNDAMENTALS: Bending Section modulus Rectangular beams of homogeneous material, such as wood, are common in practice. The section modulus for such beams is derived here. 1 Stress block in rectangular beam under positive bending. 2 Large stress block and lever-arm of a joist in typical upright position. 3 Small, inefficient, stress block and lever-arm of a joist laid flat. Referring to 1, the section modulus for a rectangular beam of homogeneous material may be derived as follows. The force couple C and T rotate about the neutral axis to provide the internal resisting moment. C and T act at the center of mass of their respective triangular stress block at d/3 from the neutral axis. The magnitude of C and T is the volume of the upper and lower stress block, respectively. C = T = (f/2) (bd/2) = f b d/4. The internal resisting moment is the sum of C and T times their respective lever arm, d/3, to the neutral axis. Hence M = C d/3 + T d/3. Substituting C = T = f bd/4 yields M = 2 (f bd/4) d/3 = f bd2/6, or M = f S, where S = bd2/6, defined as the section modulus for rectangular beams of homogeneous material. S = bd2/6 Solving M = f S for f yields the maximum bending stress as defined before: f = M/S This formula is valid for homogeneous beams of any shape; but the formula S = bd2/6 is valid for rectangular beams only. For other shapes S can be computed as S = I /c as defined before for the flexure formula. The moment of inertia I for various common shapes is given in Appendix A. Comparing a joist of 2”x12” in upright and flat position as illustrated in 2 and 3 yields an interesting observation: S = 2x122/6 = 48 in3 for the upright joist S = 12x22/6 = 8 in3 for the flat joist. The upright joist is six times stronger than the flat joist of equal cross-section. This demonstrates the importance of correct orientation of bending members, such as beams or moment frames. Copyright G Schierle, 1990-2006
- 63. 6-16 FUNDAMENTALS: Bending Moment of inertia The formula for the moment of inertia I=∫y2da reveals that the resistance of any differential area da increases with its distance y from the neutral axis squared, forming a parabolic distribution. For a beam of rectangular cross-section, the resistance of top and bottom fibers with distance y = d/2 from the neutral axis is (d/2)2. Thus, the moment of inertia, as geometric resistance, is the volume of all fibers under a parabolic surface, which is 1/3 the volume of a cube of equal dimensions, or I= bd (d/2)2/3, or I = bd3 / 12 (for rectangular beams only) the moment of inertia of a rectangular beam of homogeneous material. A formal calculus derivation of this formula is given in Appendix A. The section modulus gives only the maximum bending stress, but the moment of inertia gives the stress at any distance c from the neutral axis as f= Mc/I. This is useful, for example, for bending elements of asymmetrical cross-section, such as T- and L-shapes. 1 Bending stress distribution over beam cross-section 2 Moment of inertia visualized as volume under parabolic surface 3 T-bar with asymmetrical stress: max. stress at c2 from the neutral axis 4 Angle bar with asymmetrical stress distribution about x, y, and z-axes: maximum resistance about x-axis and minimum resistance about z-axis Copyright G Schierle, 1990-2006
- 64. 6-18 FUNDAMENTALS: Bending Shear stress The distribution of shear stress over the cross-section of beams is derived, referring to a beam part of length x marked on diagrams. Even though horizontal and vertical shear are equal at any part of a beam, horizontal shear stress is derived here because it is much more critical in wood due to horizontal fiber direction. 1 Beam, shear and bending diagrams with marked part of length x 2 Beam part with bending stress pushing and pulling to cause shear 3 Beam part with bending stress above an arbitrary shear plane Let M be the differential bending moment between m and n. M is equal to the shear area between m and n (area method), thus M = V x. Substituting V x for M in the flexure formula f= M c /I yields bending stress f= V x c/I in terms of shear. The differential bending stress between m and n pushes top and bottom fibers in opposite directions, causing shear stress. At any shear plane y1 from the neutral axis of the beam the sum of shear stress above this plane yields a force F that equals average stress fy times the cross section area A above the shear plane, F = A fy. The average stress fy is found from similar triangles; fy relates to y as f relates to c, i.e., fy/y = f/c; thus fy = f y/c. Since f= V x c/I, substituting V x c/I for f yields fy = (V x c/I) y/c = V x y/I. Since F = A fy, it follows that F = A V x y/I. The horizontal shear stress v equals the force F divided by the area of the shear plane; V = F/(x b) = A V x y/(I x b) = V A y/(I b) The term A y is defined as Q, the first static moment of the area above the shear plane times the lever arm from its centroid to the neutral axis of the entire cross-section. Substituting Q for A y yields the working formula v = V Q / (I b) (shear stress) v = horizontal shear stress. Q = static moment (area above shear plane times distance from centroid of that area to the neutral axis of the entire cross-section I = moment of Inertia of entire cross section b = width of shear plane The formula for shear stress can also be stated as shear flow q, measured in force per unit length (pound per linear inch, kip per linear inch, or similar metric units); hence q = V Q / I (shear flow) q = force per unit length Copyright G Schierle, 1990-2006
- 65. 6-19 FUNDAMENTALS: Bending Shear stress in wood and steel beams Based on the forgoing general derivation of shear stress, the formulas for shear stress in rectangular wood beams and flanged steel beams is derived here. The maximum stress in those beams is customarily defined as fv instead of v in the general shear formula. 1 Shear at neutral axis of rectangular beam (maximum stress), Q = Ay = (bd/2) d/4, or Q = bd2/8 (Note: d2 implies parabolic distribution) I = bd3/12, hence v = V Q / I b = V (bd2/8) / [(bd3/12)b] = fv, or fv = 1.5 V / (bd) Note: this is the same formula derived for maximum shear stress before 2 Shear stress at the bottom of rectangular beam. Note that y= 0 since the centroid of the area above the shear plane (bottom) coincides with the neutral axis of the entire section. Thus Q= Ay = (bd/2) 0 = 0, hence v = V 0/(I b) = 0 = fv, thus fv = 0 Note: this confirms an intuitive interpretation that suggests zero stress since no fibers below the beam could resist shear 3 Shear stress at top of rectangular beam. Note A = 0b = 0 since the depth of the shear area above the top of the beam is zero. Thus Q = Ay = 0 d/2 = 0, hence v = V 0/(I b) = 0 = fv, thus fv = 0 Note: this, too, confirms an intuitive interpretation that suggests zero stress since no fibers above the beam top could resist shear. 4 Shear stress distribution over a rectangular section is parabolic as implied by the formula Q=bd2/8 derived above. 5 Shear stress in a steel beam is minimal in the flanges and parabolic over the web. The formula v = VQ/(I b) results in a small stress in the flanges since the width b of flanges is much greater than the web thickness. However, for convenience, shear stress in steel beams is computed as “average” by the simplified formula: fv = V / Av fv = shear stress in steel beam V = shear force at section investigated Av = shear area, defined as web thickness times beam depth Copyright G Schierle, 1990-2006
- 66. 6-20 FUNDAMENTALS: Bending Shear stress in wood I-beam Since this is not a rectangular beam, shear stress must be computed by the general shear formula. The maximum shear stress at the neutral axis as well as shear stress at the intersection between flange and web (shear plane As) will be computed. The latter gives the shear stress in the glued connection. To compare shear- and bending stress the latter is also computed. 1 Beam of L= 10 ft length, with uniform load w= 280plf (W = 2800 lbs) 2 Cross-section of wood I-beam Shear force V= W/2 = 2800/2 V = 1400 lbs Bending moment M=WL/8 = 2800(10)/8 M = 3500 lb’ For the formula v= VQ/(Ib) we must find the moment of inertia of the entire cross-section. We could use the parallel axis theorem of Appendix A. However, due to symmetry, a simplified formula is possible, finding the moment of inertia for the overall dimensions as rectangular beam minus that for two rectangles on both sides of the web. I = (BD3– bd3)/12 = [6(10)3– 2(2)63]/12 I = 428 in4 Bending stress fb= Mc/I = 3500(12)5/428 fb = 491 psi 491 < 1450, ok Note c= 10/2 = 5 (half the beam depth due to symmetry) Static moment Q of flange about the neutral axis: Q = Ay = 6(2)4 Q = 48 in3 Shear stress at flange/web intersection: v = VQ/(Ib) = 1400(48)/[428(2)] v = 79 psi Static moment Q of flange plus upper half of web about the neutral axis Q = ΣAy = 6(2)4 + 2(3)1.5 Q = 57 in3 Maximum shear stress at neutral axis: v = VQ/(Ib) = 1400(57)/[428(2)] v = 93 psi <95, ok Note: Maximum shear stress reaches almost the allowable stress limit, but bending stress is well below allowable bending stress because the beam is very short. We can try at what span the beam approaches allowable stress, assuming L= 30 ft, using the same total load W = 2800 lbs to keep shear stress constant: M= WL/8 = 2800(30)/8 M = 10500 lb-ft fb = Mc/I = 10500(12)5/428 fb = 1472 psi 1472 >1450, not ok At 30 ft span bending stress is just over the allowable stress of 1450 psi. This shows that in short beams shear governs, but in long beams bending or deflection governs. Copyright G Schierle, 1990-2006
- 67. 6-21 FUNDAMENTALS: Bending Shear stress in steel beam This beam, supporting a column point load of 96 k over a door, is a composite beam consisting of a wide-flange base beam with 8x½ in plates welded to top and bottom flanges. The beam is analyzed with and without plates. As shown before, for steel beams shear stress is assumed to be resisted by the web only, computed as fv = V/Av. The base beam is a W10x49 [10 in (254 mm) nominal depth, 49 lbs/ft (6.77 kg/m) DL] with a moment of inertia Ixx= 272 in4 (11322 cm4) (see Appendix). Shear in the welds connecting the plates to the beam is found using the shear flow formula q = VQ/(I). 1 Beam of L= 6 ft (1.83 m) span with P = 96 k point load 2 Composite wide-flange beam W10x49 with 8x½ inch stiffener plates Shear force V = P/2 = 96/2 V = 48 k Bending moment M = 48(3) M = 144 k’ Wide-flange beam Shear area of web Av = web thickness x beam depth Av = 0.34(10) Av = 3.4 in2 Shear stress fv = V/Av = 48/3.4 fv = 14 ksi 14 < 14.5, ok Bending stress fb = Mc/I = 144(12)5.5/272 fb = 35 ksi 35 >22, not ok Since the beam would fail in bending, a composite beam is used. Composite beam Moment of inertia I=Σ(Ioo+Ay2) (see parallel axis theorem in Appendix A) I= 272+2(8)0.53/12+2(8)0.5(5.25)2 I = 493 in4 Bending stress fb= Mc/I = 144(12)5/493 fb = 19 ksi 19 < 22, ok Since the shear force remains unchanged, the web shear stress is still ok. Shear flow q in welded plate connection Q= Ay = 8(.5)5.25 = 21 in3 qtot = VQ/I = 48(21)/493 qtot = 2 k/in Since there are two welds, each resists half the total shear flow q = qtot/2 q = 1k/in Assume ¼ in weld of 3.2 k/in * strength 1 < 3.2, ok * see AISC weld strength table Note: in this steel beam, bending is stress is more critical than shear stress; this is typical for steel beams, except very short ones. Copyright G Schierle, 1990-2006
- 68. 6-24 FUNDAMENTALS: Bending Deflection formulas Based on the moment-area method, the following formulas for slope and deflection are derived for beams of common load and support conditions. Additional formulas are provided in Appendix A. Although downward deflection would theoretically be negative, it is customary to ignore the sign convention and define up- or downward deflection by inspection. The angle θ is the slope of the tangent to the elastic curve at the free end for cantilever beams and at supports for simple beams; ∆ is the maximum deflection for all cases. As derived before, θ is the area of the bending moment diagram divided by EI, the elastic modulus and moment of inertia, respectively; ∆ equals θ times the lever-arm from the centroid of the bending moment diagram between zero and maximum deflection to the point where θ is maximum. 1 Cantilever beam with point load; θ = (PL)(L/2)/(EI), ∆= θ 2/3 L θ= 1/2 PL2/(EI) ∆= 1/3 PL3/(EI) 2 Cantilever beam with uniform load; θ = (WL/2)(L/3)/(EI), ∆= θ 3/4 L θ= 1/6 WL2/(EI) ∆= 1/8 WL3/(EI) 3 Simple beam with point load; θ = (PL/4)(L/4)/(EI), ∆= θ 1/3 L θ= 1/16 PL2/(EI) ∆= 1/48 PL3/(EI) 4 Simple beam with uniform load; θ = (WL/8)(2/3 L/2)/(EI), ∆= θ 5/16 L θ= 1/24 WL2/(EI) ∆= 5/384 WL3/(EI) Copyright G Schierle, 1990-2006
- 69. 6-27 FUNDAMENTALS: Bending Typical beam diagrams Deflection, shear, and bending diagrams are shown here for typical beams. The beam with deflection and load diagrams are drawn on top with shear and bending diagrams shown below. With experience, these diagrams may be drawn by visual inspection prior to computing. This is useful to verify computations and develop an intuitive sense and visualization regarding shear and bending on beams. The deflection diagram is drawn, visualizing the deflection of a thin board, flexible ruler, or similar device. It is drawn grossly exaggerated to be visible. The shear diagram is drawn at a convenient force scale left to right, starting with zero shear to the left of the beam. Downward uniform load yields downward sloping shear. Downward point loads are drawn as downward offset, and upward reactions yield upward offset. Bending diagrams are drawn, considering the area method; namely, bending at any point is equal to the area of the shear diagram up to that point. Both, shear and bending must be zero to the right of the right beam end. To satisfy this, requires a certain amount of forward thinking and, in complex cases, even working backward from right to left as well as left to right. 1 Cantilever beam with point load 2 Cantilever beam with uniform load 3 Cantilever beam with mixed load 4 Simple beam with point loads 5 Simple beam with uniform load 6 Simple beam with mixed load 7 Beam with one overhang and point load 8 Beam with one overhang and uniform load 9 Beam with one overhang and mixed load 10 Beam with two overhangs and point loads 11 Beam with two overhangs and uniform load 12 Beam with two overhangs and mixed load Copyright G Schierle, 1990-2006
- 70. 9-1 DESIGN METHODS Lateral Force Design 9 Lateral Force Design Lateral loads, acting primarily horizontally, include: • Wind load • Seismic load • Earth pressure on retaining walls (not included in this book) Wind and earthquakes are the most devastating forces of nature: Hurricane Andrew 1992, with gusts of 170 mph, devastated 300 square miles, left 300,000 homeless, caused about $ 25 billion damage, and damaged 100,000 homes The 1976 Tangshan Earthquake (magnitude 7.8), obliterating the city in northeast China and killing over 240,000 people, was the most devastating earthquake of the 20th century. Swiss Re reported 2003 world wide losses: • 60,000 people killed • Over two thirds earthquake victims • $70 billion economic losses IBC table 1604.5. Importance Classification excerpt Category Seismic UseGroup Nature of Occupancy Seismic importance factor Snow importance factor Wind importance factor I I Low hazard structures: Agriculture, temporary, minor storage 1 0.8 0.87 II I Structures not in categories I, III, IV 1 1 1 III II Structures such as: Occupancy >300 people per area Elementary schools >250 students Colleges >500 students Occupancy >5000 1.25 1.1 1.15 IV III Essential facilities, such as: Hospitals, polices and fire stations 1.5 1.2 1.15 Copyright G Schierle, 1990-2006