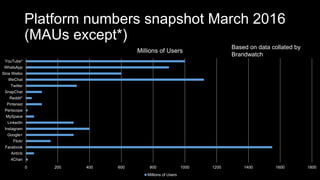
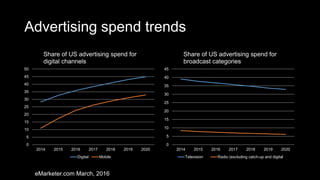
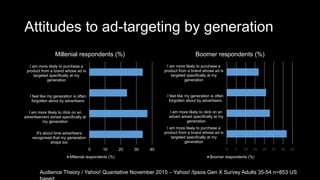
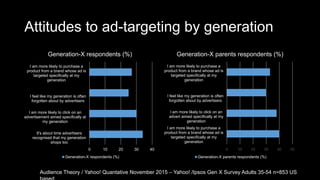
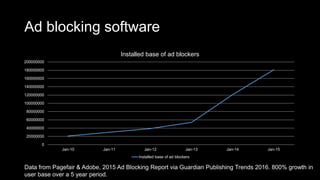
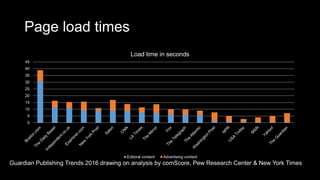
Online marketing &
technology data points April
2016
Ged Carroll
renaissancechambara.jp
About presentation
Over time, I have had to compile data and visualise it based on
desk and primary research. I thought that these slides may be of
use to other people so have compiled them here. As I have time I
will update them with data. Each diagram has an accompanying
slide with an explanation where appropriate.
Platforms
DEC-97
APR-98
AUG-98
DEC-98
APR-99
AUG-99
DEC-99
APR-00
AUG-00
DEC-00
APR-01
AUG-01
DEC-01
APR-02
AUG-02
DEC-02
APR-03
AUG-03
DEC-03
APR-04
AUG-04
DEC-04
APR-05
AUG-05
DEC-05
APR-06
AUG-06
DEC-06
APR-07
AUG-07
DEC-07
APR-08
AUG-08
DEC-08
APR-09
AUG-09
DEC-09
APR-10
AUG-10
DEC-10
APR-11
AUG-11
DEC-11
APR-12
AUG-12
DEC-12
APR-13
AUG-13
DEC-13
APR-14
AUG-14
DEC-14
APR-15
AUG-15
DEC-15
Communications services adoption (active users)
Gmail active Users Hotmail / Live Yahoo! Mail Whatsapp WeChat QQ IM KakaoTalk LINE
Communications services adoption
Going through publicly declared data, I pulled together adoption
data across email providers and OTT messaging platforms.
Key watch outs on the data is that it’s largely self-declared and
active users is broad church. Usage data is also very important -
what does active really mean?
Regardless one can see that mobile devices became an
accelerant of adoption for newer services.
Platform numbers snapshot March 2016
(MAUs except*)
0 200 400 600 800 1000 1200 1400 1600 1800
4Chan
Airbnb
Facebook
Flickr
Google+
Instagram
LinkedIn
MySpace
Periscope
Pinterest
Reddit*
SnapChat
Twitter
WeChat
Sina Weibo
WhatsApp
YouTube*
Millions of Users
Millions of Users
Based on data collated by
Brandwatch
Advertising
Optimium number of advertising channels
• Careful channel selection
• Datapoint is contrary to the
trend towards complex
programmatic based
advertising mixes
0
10
20
30
40
50
60
70
80
1 channel 2 channels 3 channels 4 channels 5 channels
Average effectiveness success rate
(IPA 2012)
Average effectiveness success rate
Audience time spent v. advertising spend
share
0
5
10
15
20
25
30
35
40
45
50
Television Out of Home (OOH) Radio Internet National newspaper Regional newspaper Magazines
% media time share % advertising spend share
Guardian Publishing Trends 2016 drawing on: AA, Barb, Rajar, ComScore, NRS,
Advertising spend trends
0
5
10
15
20
25
30
35
40
45
50
2014 2015 2016 2017 2018 2019 2020
Share of US advertising spend
TV Digital Print
Radio Out-of-home Directories
0
2
4
6
8
10
12
14
16
18
20
2014 2015 2016 2017 2018 2019 2020
Share of US advertising spend for
print categories
Pinrt (overall)
Newspapers (print only)
Magazines (print editions only)
Directories (print only)
eMarketer.com March, 2016
Advertising spend trends
0
5
10
15
20
25
30
35
40
45
50
2014 2015 2016 2017 2018 2019 2020
Share of US advertising spend for
digital channels
Digital Mobile
0
5
10
15
20
25
30
35
40
45
2014 2015 2016 2017 2018 2019 2020
Share of US advertising spend for
broadcast categories
Television Radio (excluding catch-up and digital
eMarketer.com March, 2016
YouTube subcribers don’t often make for
regular viewers
0 10 20 30 40 50 60 70 80 90
GoPro
Home Depot
Chevrolet
Toyota USA
Adidas Football
Nike Football
Dove
Chanel
Burberry
Delta Airlines
Virgin America
Oreo
Chipotle
Xbox
Budweiser
Starbucks
Kentucky Fried Chicken (KFC)
Mastercard
Visa
Lego
Average views / Subcribers x 100(%)
Forrester Research
Social media engagement and
how television advertising
affects it
Social media engagement and television
Social engagement drivers (%)
TV advertising
Social platform advertising
Combined TV and social platform advertising
All other advertising
Social engagement drivers (%) minus
other advertising
Social platform advertising
TV advertising
Combined TV and social platform advertising
Turner & 4C: Television Advertising is a Key Driver of Social Media Engagement for Brands
Social media engagement and television
TV advertising impressions (%)
Premium content (sports, live and original) Non-premium content
% TV advertising impact on social
brand engagement
Premium content Non-premium content
Turner & 4C: Television Advertising is a Key Driver of Social Media Engagement for Brands
Engagement to impressions index
0 50 100 150 200 250
Premium content
Non-premium content
Engagement to impressions index
0 100 200 300 400
Original content
Sports
Live
Expressions to Impressions Index for
premium TV content types
Expressions to Impressions Index for premium TV content types
Turner & 4C: Television Advertising is a Key Driver of Social Media Engagement for Brands
Engagement to cost index
0 50 100 150 200
Premium content
Non-premium content
Engagement to cost index
0 50 100 150 200 250 300
Original content
Sports
Live
Reaility
Expressions to Impressions Index for
premium content types
Expressions to Impressions Index
Turner & 4C: Television Advertising is a Key Driver of Social Media Engagement for Brands
Ad targeting and ad blocking
Attitudes to ad-targeting by generation
0 10 20 30 40
It's about time advertisers
recognised that my generation
shops too
I am more likely to click on an
advertisement aimed specifically at
my generation
I feel like my generation is often
forgotten about by advertisers
I am more likely to purchase a
product from a brand whose ad is
targeted specifically at my
generation
Millenial respondents (%)
0 5 10 15 20 25 30 35
I am more likely to purchase a
product from a brand whose ad is
targeted specifically at my
generation
I am more likely to click on an
advert aimed specifically at my
generation
I feel like my generation is often
forgotten about by advertisers
I am more likely to purchase a
product from a brand whose ad is
targeted specifically at my
generation
Boomer respondents (%)
Audience Theory / Yahoo! Quantative November 2015 – Yahoo! /Ipsos Gen X Survey Adults 35-54 n=853 US
Attitudes to ad-targeting by generation
0 10 20 30 40
It's about time advertisers
recognised that my generation
shops too
I am more likely to click on an
advertisement aimed specifically at
my generation
I feel like my generation is often
forgotten about by advertisers
I am more likely to purchase a
product from a brand whose ad is
targeted specifically at my
generation
Generation-X respondents (%)
0 10 20 30 40 50
I am more likely to purchase a
product from a brand whose ad is
targeted specifically at my
generation
I am more likely to click on an
advert aimed specifically at my
generation
I feel like my generation is often
forgotten about by advertisers
I am more likely to purchase a
product from a brand whose ad is
targeted specifically at my
generation
Generation-X parents respondents (%)
Audience Theory / Yahoo! Quantative November 2015 – Yahoo! /Ipsos Gen X Survey Adults 35-54 n=853 US
Ad blocking software
0
20000000
40000000
60000000
80000000
100000000
120000000
140000000
160000000
180000000
200000000
Jan-10 Jan-11 Jan-12 Jan-13 Jan-14 Jan-15
Installed base of ad blockers
Data from Pagefair & Adobe, 2015 Ad Blocking Report via Guardian Publishing Trends 2016. 800% growth in
user base over a 5 year period.
Page load times
0
5
10
15
20
25
30
35
40
45
Load time in seconds
Editoral content Advertising content
Guardian Publishing Trends 2016 drawing on analysis by comScore, Pew Research Center & New York Times
Internet users worldwide who have
blocked an advert
0
5
10
15
20
25
30
35
40
Q1 2015 Q2 2015 Q3 2015 Q4 2015
Respondents aged 16-64, in the past month on their main computer
(GlobalWebIndex Blog January 22 2016)
% respondents
Share of time spent viewing video
content in selected countries using ad
blockers
0 10 20 30 40 50 60 70
Germany
Canada
UK
France
US
Russia
% of total time spent viewing desktop video content via JW Player (Q2, 2015)
% of total time spent viewing desktop video content
Secret Media & JW Player “Adblock & the Global Video Market September 14, 2015
Consumer behaviour
Share of content category time spent by
platform
0%
10%
20%
30%
40%
50%
60%
70%
80%
90%
100%
comScore Media Metrix Multi-Platform US December, 2015
Desktop Mobile
Growth in Digital Media Time Spent in
Minutes (MM)
0
200000
400000
600000
800000
1000000
1200000
1400000
1600000
Dec 2013 Dec 2014 Dec 2015
comScore Media Metrix Multi-Platform & Mobile Metrix US Dec 2015 vs. Dec 2014 vs. Dec 2013
Desktop Smartphone Tablet
Generation X mobile engagement
0
20
40
60
80
100
120
140
160
7am-10am
11am-2pm
3pm-6pm7pm-10pm
11pm-6am
Generation X time of day usage by category indexed vs. general population
News & Magazines Health & Fitness Lifestyle & Shopping Music, media & entertainment Games Messaging & Social Sports Utilities & Productivity
Flurry by Yahoo! Analytics
(mapped devices only. May
2015
Global smartphone ownership
0
10
20
30
40
50
60
70
80
90
100
Data from Pew Research Spring 2015 Global Attitudes survey Q71 & Q72
% of survey respondents who claim to own a smartphone
China penetration of social media
platforms
0 10 20 30 40 50 60
2014
2015
% of Chinese internet users
0
10
20
30
40
50
60
70
80
16-25 26-35 36-45 46-55 >55
% of Chinese internet users by age
2014 2015
Source: China Internet Watch
Wearables
Wearables by category (millions of units)
0
20
40
60
80
100
120
140
160
180
200
2015 2016 2017
Fitness wearables Head mounted display Body worn camera Bluetooth headset
Fitness wearables (millions of units)
0
10
20
30
40
50
60
70
80
2015 2016 2017
Data by Gartner
Smartwatch Wristband Chest strap Sports watch Other fitness monitor
Economic data
Economic data
-2
-1
0
1
2
3
4
5
6
7
8
9
2012 2013 2014 2015 2016 2017
GDP Forecast (World Bank)
Global
China
U.S .
Eurozone
Developing World excluding BRICs
-3
-2
-1
0
1
2
3
4
5
6
2012 2013 2014 2015 2016 2017
Retail sales (various sources)
Global U.K. U.S. Eurozone
Consumer sectors CPG (as bellwether),
consumer technology as (former?) shooting
star
-5
-4
-3
-2
-1
0
1
2
2010 2011 2012 2013 2014
CPG % growth (Euromonitor data)
Packaged Foods Home Care Personal Care | Beauty
-20
0
20
40
60
80
100
2010 2011 2012 2013 2014 2015 2016 2017 2018 2019
Consumer Technology % growth
(Various)
Smartphones Tablets Smart TVs
About me
Amazon author page: amzn.to/1SeO5Il
LinkedIn page: linkedin.com/in/gedcarroll
About: renaissancechambara.jp/about
Blog: renaissancechambara.jp
Email address found here: scr.im/renaissance
Twitter account: @r_c
Sina Weibo: renaissancechambara
WeChat
thank you | 谢谢 | míle buíochas! |
감사합니다 | danke | ありがとう |
merci | спасибо | cám ơn |
whakawhetai | takk | ขอขอบคุณคุณ |
terima kasih | σας ευχαριστώ |
grazie | ‫|شكرا‬ þakka þér | დიდი
მადლობა | kiitos | நன்றி | gracias

April 2016 - marketing stats

  • 1.
    Online marketing & technologydata points April 2016 Ged Carroll renaissancechambara.jp
  • 2.
    About presentation Over time,I have had to compile data and visualise it based on desk and primary research. I thought that these slides may be of use to other people so have compiled them here. As I have time I will update them with data. Each diagram has an accompanying slide with an explanation where appropriate.
  • 3.
  • 4.
  • 5.
    Communications services adoption Goingthrough publicly declared data, I pulled together adoption data across email providers and OTT messaging platforms. Key watch outs on the data is that it’s largely self-declared and active users is broad church. Usage data is also very important - what does active really mean? Regardless one can see that mobile devices became an accelerant of adoption for newer services.
  • 6.
    Platform numbers snapshotMarch 2016 (MAUs except*) 0 200 400 600 800 1000 1200 1400 1600 1800 4Chan Airbnb Facebook Flickr Google+ Instagram LinkedIn MySpace Periscope Pinterest Reddit* SnapChat Twitter WeChat Sina Weibo WhatsApp YouTube* Millions of Users Millions of Users Based on data collated by Brandwatch
  • 7.
  • 8.
    Optimium number ofadvertising channels • Careful channel selection • Datapoint is contrary to the trend towards complex programmatic based advertising mixes 0 10 20 30 40 50 60 70 80 1 channel 2 channels 3 channels 4 channels 5 channels Average effectiveness success rate (IPA 2012) Average effectiveness success rate
  • 9.
    Audience time spentv. advertising spend share 0 5 10 15 20 25 30 35 40 45 50 Television Out of Home (OOH) Radio Internet National newspaper Regional newspaper Magazines % media time share % advertising spend share Guardian Publishing Trends 2016 drawing on: AA, Barb, Rajar, ComScore, NRS,
  • 10.
    Advertising spend trends 0 5 10 15 20 25 30 35 40 45 50 20142015 2016 2017 2018 2019 2020 Share of US advertising spend TV Digital Print Radio Out-of-home Directories 0 2 4 6 8 10 12 14 16 18 20 2014 2015 2016 2017 2018 2019 2020 Share of US advertising spend for print categories Pinrt (overall) Newspapers (print only) Magazines (print editions only) Directories (print only) eMarketer.com March, 2016
  • 11.
    Advertising spend trends 0 5 10 15 20 25 30 35 40 45 50 20142015 2016 2017 2018 2019 2020 Share of US advertising spend for digital channels Digital Mobile 0 5 10 15 20 25 30 35 40 45 2014 2015 2016 2017 2018 2019 2020 Share of US advertising spend for broadcast categories Television Radio (excluding catch-up and digital eMarketer.com March, 2016
  • 12.
    YouTube subcribers don’toften make for regular viewers 0 10 20 30 40 50 60 70 80 90 GoPro Home Depot Chevrolet Toyota USA Adidas Football Nike Football Dove Chanel Burberry Delta Airlines Virgin America Oreo Chipotle Xbox Budweiser Starbucks Kentucky Fried Chicken (KFC) Mastercard Visa Lego Average views / Subcribers x 100(%) Forrester Research
  • 13.
    Social media engagementand how television advertising affects it
  • 14.
    Social media engagementand television Social engagement drivers (%) TV advertising Social platform advertising Combined TV and social platform advertising All other advertising Social engagement drivers (%) minus other advertising Social platform advertising TV advertising Combined TV and social platform advertising Turner & 4C: Television Advertising is a Key Driver of Social Media Engagement for Brands
  • 15.
    Social media engagementand television TV advertising impressions (%) Premium content (sports, live and original) Non-premium content % TV advertising impact on social brand engagement Premium content Non-premium content Turner & 4C: Television Advertising is a Key Driver of Social Media Engagement for Brands
  • 16.
    Engagement to impressionsindex 0 50 100 150 200 250 Premium content Non-premium content Engagement to impressions index Engagement to impressions index 0 100 200 300 400 Original content Sports Live Expressions to Impressions Index for premium TV content types Expressions to Impressions Index for premium TV content types Turner & 4C: Television Advertising is a Key Driver of Social Media Engagement for Brands
  • 17.
    Engagement to costindex 0 50 100 150 200 Premium content Non-premium content Engagement to cost index Engagement to cost index 0 50 100 150 200 250 300 Original content Sports Live Reaility Expressions to Impressions Index for premium content types Expressions to Impressions Index Turner & 4C: Television Advertising is a Key Driver of Social Media Engagement for Brands
  • 18.
    Ad targeting andad blocking
  • 19.
    Attitudes to ad-targetingby generation 0 10 20 30 40 It's about time advertisers recognised that my generation shops too I am more likely to click on an advertisement aimed specifically at my generation I feel like my generation is often forgotten about by advertisers I am more likely to purchase a product from a brand whose ad is targeted specifically at my generation Millenial respondents (%) Millenial respondents (%) 0 5 10 15 20 25 30 35 I am more likely to purchase a product from a brand whose ad is targeted specifically at my generation I am more likely to click on an advert aimed specifically at my generation I feel like my generation is often forgotten about by advertisers I am more likely to purchase a product from a brand whose ad is targeted specifically at my generation Boomer respondents (%) Boomer respondents (%) Audience Theory / Yahoo! Quantative November 2015 – Yahoo! /Ipsos Gen X Survey Adults 35-54 n=853 US
  • 20.
    Attitudes to ad-targetingby generation 0 10 20 30 40 It's about time advertisers recognised that my generation shops too I am more likely to click on an advertisement aimed specifically at my generation I feel like my generation is often forgotten about by advertisers I am more likely to purchase a product from a brand whose ad is targeted specifically at my generation Generation-X respondents (%) Generation-X respondents (%) 0 10 20 30 40 50 I am more likely to purchase a product from a brand whose ad is targeted specifically at my generation I am more likely to click on an advert aimed specifically at my generation I feel like my generation is often forgotten about by advertisers I am more likely to purchase a product from a brand whose ad is targeted specifically at my generation Generation-X parents respondents (%) Generation-X parents respondents (%) Audience Theory / Yahoo! Quantative November 2015 – Yahoo! /Ipsos Gen X Survey Adults 35-54 n=853 US
  • 21.
    Ad blocking software 0 20000000 40000000 60000000 80000000 100000000 120000000 140000000 160000000 180000000 200000000 Jan-10Jan-11 Jan-12 Jan-13 Jan-14 Jan-15 Installed base of ad blockers Installed base of ad blockers Data from Pagefair & Adobe, 2015 Ad Blocking Report via Guardian Publishing Trends 2016. 800% growth in user base over a 5 year period.
  • 22.
    Page load times 0 5 10 15 20 25 30 35 40 45 Loadtime in seconds Editoral content Advertising content Guardian Publishing Trends 2016 drawing on analysis by comScore, Pew Research Center & New York Times
  • 23.
    Internet users worldwidewho have blocked an advert 0 5 10 15 20 25 30 35 40 Q1 2015 Q2 2015 Q3 2015 Q4 2015 Respondents aged 16-64, in the past month on their main computer (GlobalWebIndex Blog January 22 2016) % respondents
  • 24.
    Share of timespent viewing video content in selected countries using ad blockers 0 10 20 30 40 50 60 70 Germany Canada UK France US Russia % of total time spent viewing desktop video content via JW Player (Q2, 2015) % of total time spent viewing desktop video content Secret Media & JW Player “Adblock & the Global Video Market September 14, 2015
  • 25.
  • 26.
    Share of contentcategory time spent by platform 0% 10% 20% 30% 40% 50% 60% 70% 80% 90% 100% comScore Media Metrix Multi-Platform US December, 2015 Desktop Mobile
  • 27.
    Growth in DigitalMedia Time Spent in Minutes (MM) 0 200000 400000 600000 800000 1000000 1200000 1400000 1600000 Dec 2013 Dec 2014 Dec 2015 comScore Media Metrix Multi-Platform & Mobile Metrix US Dec 2015 vs. Dec 2014 vs. Dec 2013 Desktop Smartphone Tablet
  • 28.
    Generation X mobileengagement 0 20 40 60 80 100 120 140 160 7am-10am 11am-2pm 3pm-6pm7pm-10pm 11pm-6am Generation X time of day usage by category indexed vs. general population News & Magazines Health & Fitness Lifestyle & Shopping Music, media & entertainment Games Messaging & Social Sports Utilities & Productivity Flurry by Yahoo! Analytics (mapped devices only. May 2015
  • 29.
    Global smartphone ownership 0 10 20 30 40 50 60 70 80 90 100 Datafrom Pew Research Spring 2015 Global Attitudes survey Q71 & Q72 % of survey respondents who claim to own a smartphone
  • 30.
    China penetration ofsocial media platforms 0 10 20 30 40 50 60 2014 2015 % of Chinese internet users % of Chinese internet users 0 10 20 30 40 50 60 70 80 16-25 26-35 36-45 46-55 >55 % of Chinese internet users by age 2014 2015 Source: China Internet Watch
  • 31.
  • 32.
    Wearables by category(millions of units) 0 20 40 60 80 100 120 140 160 180 200 2015 2016 2017 Fitness wearables Head mounted display Body worn camera Bluetooth headset
  • 33.
    Fitness wearables (millionsof units) 0 10 20 30 40 50 60 70 80 2015 2016 2017 Data by Gartner Smartwatch Wristband Chest strap Sports watch Other fitness monitor
  • 34.
  • 35.
    Economic data -2 -1 0 1 2 3 4 5 6 7 8 9 2012 20132014 2015 2016 2017 GDP Forecast (World Bank) Global China U.S . Eurozone Developing World excluding BRICs -3 -2 -1 0 1 2 3 4 5 6 2012 2013 2014 2015 2016 2017 Retail sales (various sources) Global U.K. U.S. Eurozone
  • 36.
    Consumer sectors CPG(as bellwether), consumer technology as (former?) shooting star -5 -4 -3 -2 -1 0 1 2 2010 2011 2012 2013 2014 CPG % growth (Euromonitor data) Packaged Foods Home Care Personal Care | Beauty -20 0 20 40 60 80 100 2010 2011 2012 2013 2014 2015 2016 2017 2018 2019 Consumer Technology % growth (Various) Smartphones Tablets Smart TVs
  • 37.
    About me Amazon authorpage: amzn.to/1SeO5Il LinkedIn page: linkedin.com/in/gedcarroll About: renaissancechambara.jp/about Blog: renaissancechambara.jp Email address found here: scr.im/renaissance Twitter account: @r_c Sina Weibo: renaissancechambara WeChat
  • 38.
    thank you |谢谢 | míle buíochas! | 감사합니다 | danke | ありがとう | merci | спасибо | cám ơn | whakawhetai | takk | ขอขอบคุณคุณ | terima kasih | σας ευχαριστώ | grazie | ‫|شكرا‬ þakka þér | დიდი მადლობა | kiitos | நன்றி | gracias

Editor's Notes

  • #7 https://www.brandwatch.com/2016/03/96-amazing-social-media-statistics-and-facts-for-2016/
  • #13 http://blogs.forrester.com/ryan_skinner/16-03-21-dont_bet_on_your_video_subscribers
  • #15 US orientated data by Turner Broadcasting and 4C
  • #16 US orientated data by Turner Broadcasting and 4C
  • #22 http://www.slideshare.net/JessMorton/guardian-publishing-trends-2016-58097540
  • #23 http://www.slideshare.net/JessMorton/guardian-publishing-trends-2016-58097540
  • #28 http://venturebeat.com/2016/03/30/mobile-now-captures-2-out-of-every-3-digital-media-minutes-in-u-s/?utm_source=feedburner&utm_medium=feed&utm_campaign=Feed%3A+Venturebeat+%28VentureBeat%29
  • #33 Data from Gartner http://electroiq.com/blog/2016/02/gartner-says-worldwide-wearable-devices-sales-to-grow-18-4-percent-in-2016/
  • #36 http://www.worldbank.org/en/publication/global-economic-prospects/summary-table Retail sales data, where possible I have tried to exclude petrol station sales and remove fuel price volatility – which is a measure of external circumstances rather than economic health.