Downloaded 45 times
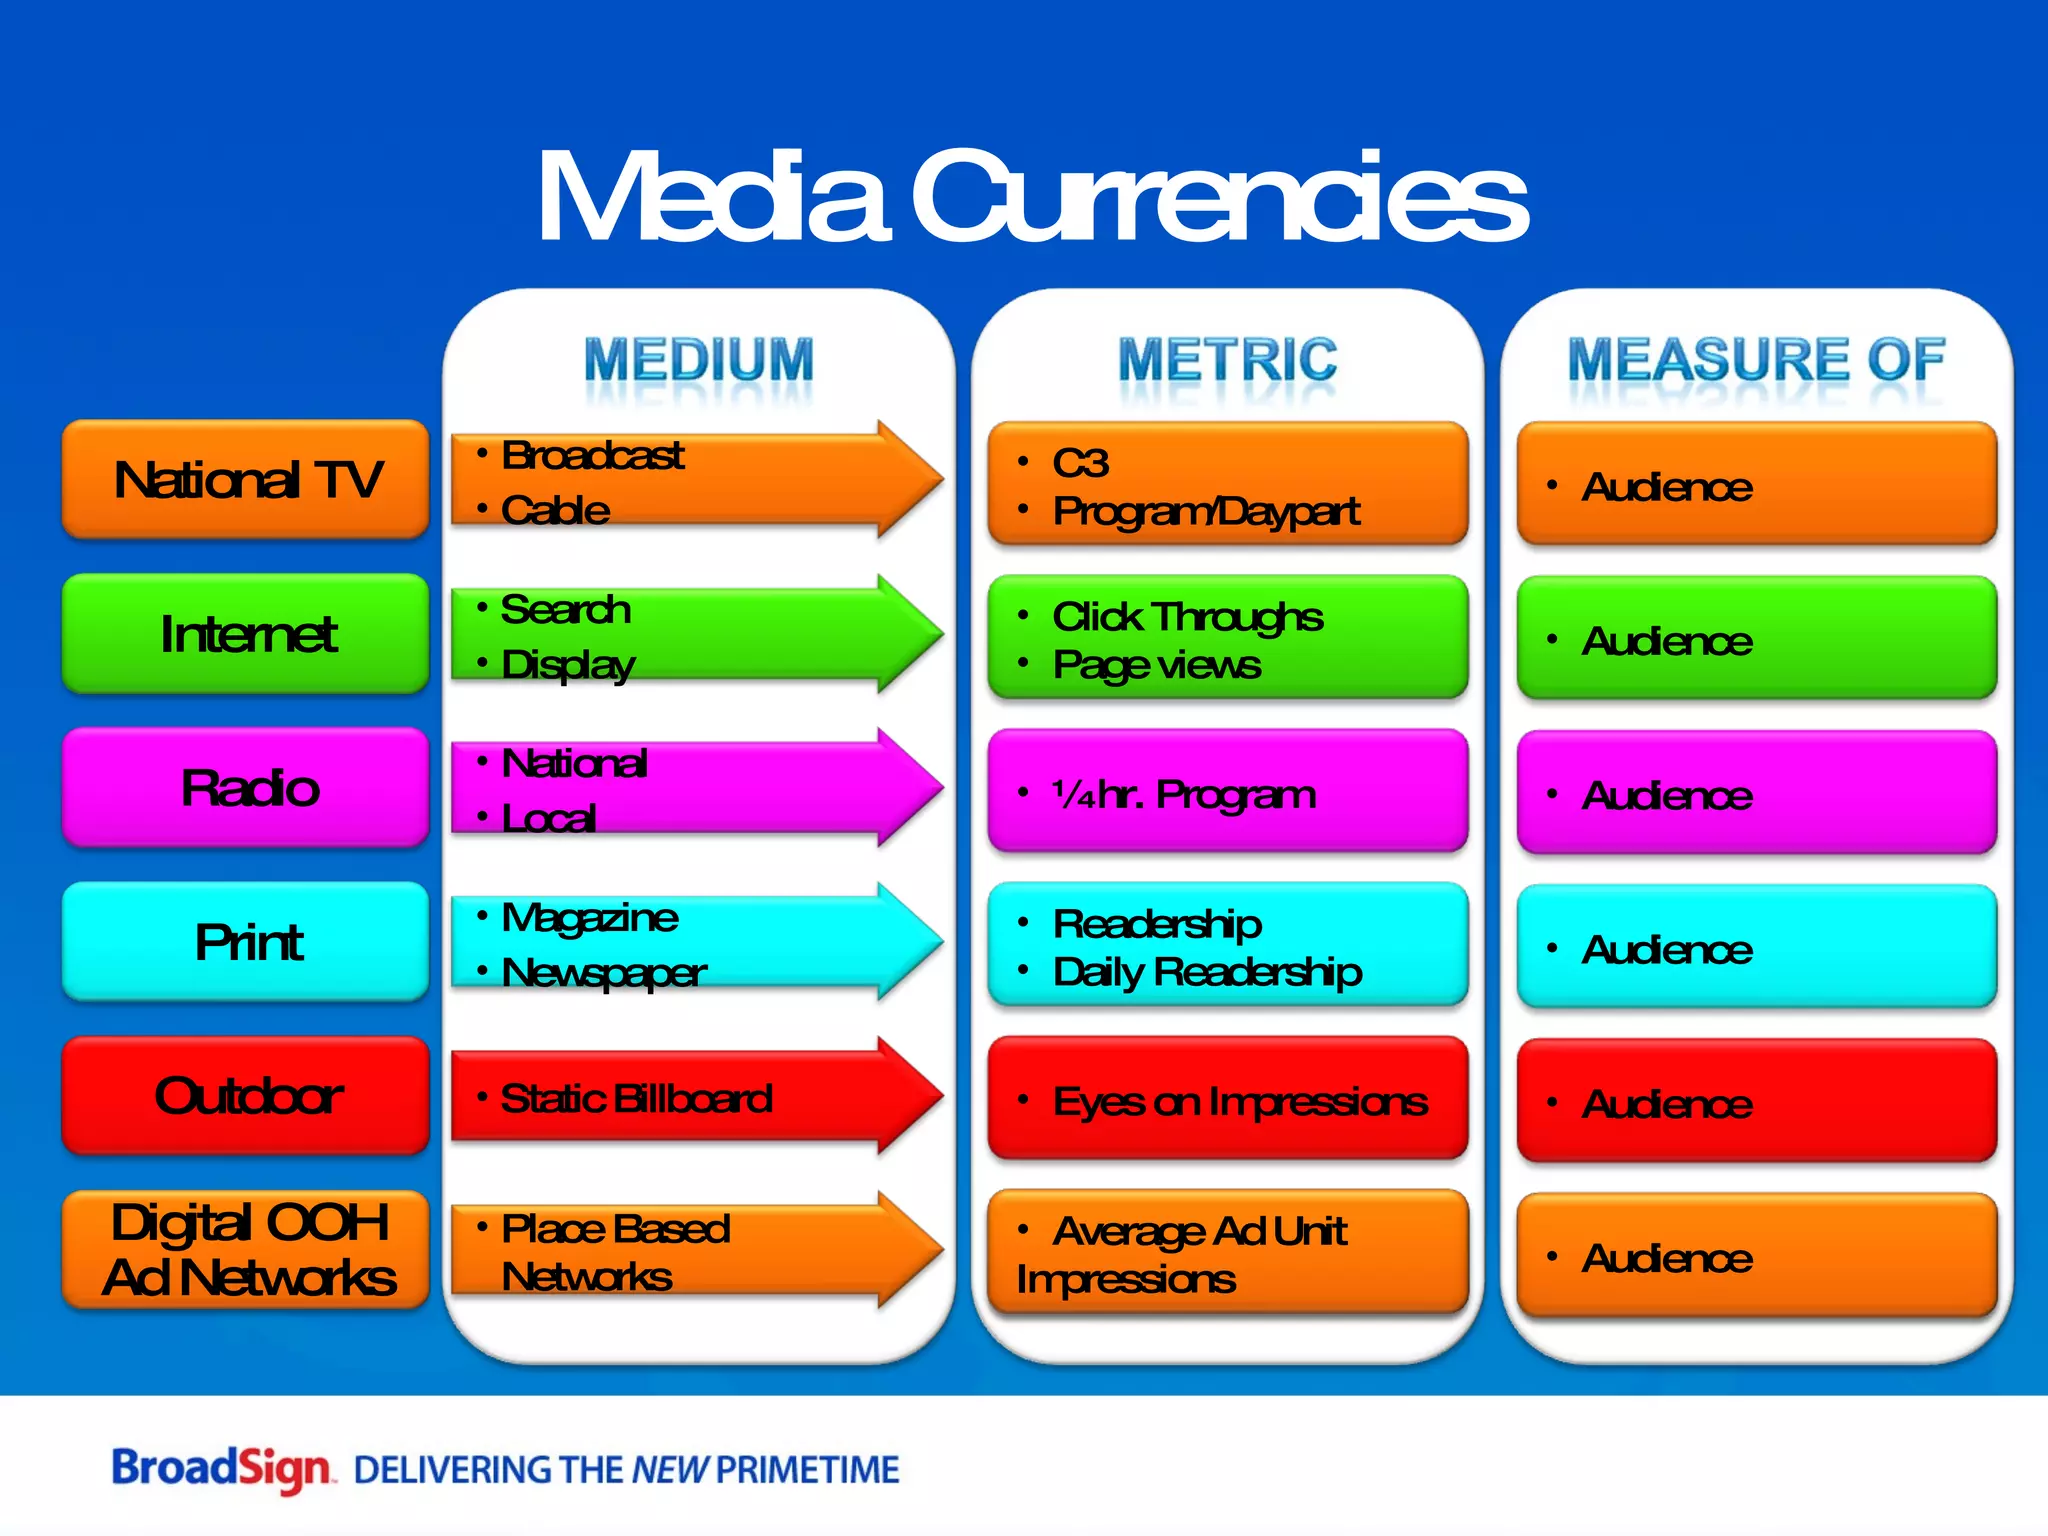

![The campaign seemed to motivate people to talk positively about “Team Fox”. We found an increased number of people report having heard others talking positively about “Team Fox”. Buzzworthy– People are Talking High Impression Markets Pre-Wave Post-Wave [BUZZ] Which of the following grassroots volunteer efforts that benefit medical research have you recently heard people talk about, including friends, family, blogs, or news articles? BUZZTONE Please indicate whether what you heard was primarily positive, primarily negative, both positive and negative Difference is statistically significant at the 80% confidence level. Have heard positive things about Team Fox recently](https://image.slidesharecdn.com/abdohpresentationoktosend-090605165743-phpapp02/75/The-Power-of-Proximity-30-2048.jpg)
![Thank You Brian Dusho BroadSign International, Inc. [email_address] www.broadsign.com](https://image.slidesharecdn.com/abdohpresentationoktosend-090605165743-phpapp02/75/The-Power-of-Proximity-46-2048.jpg)

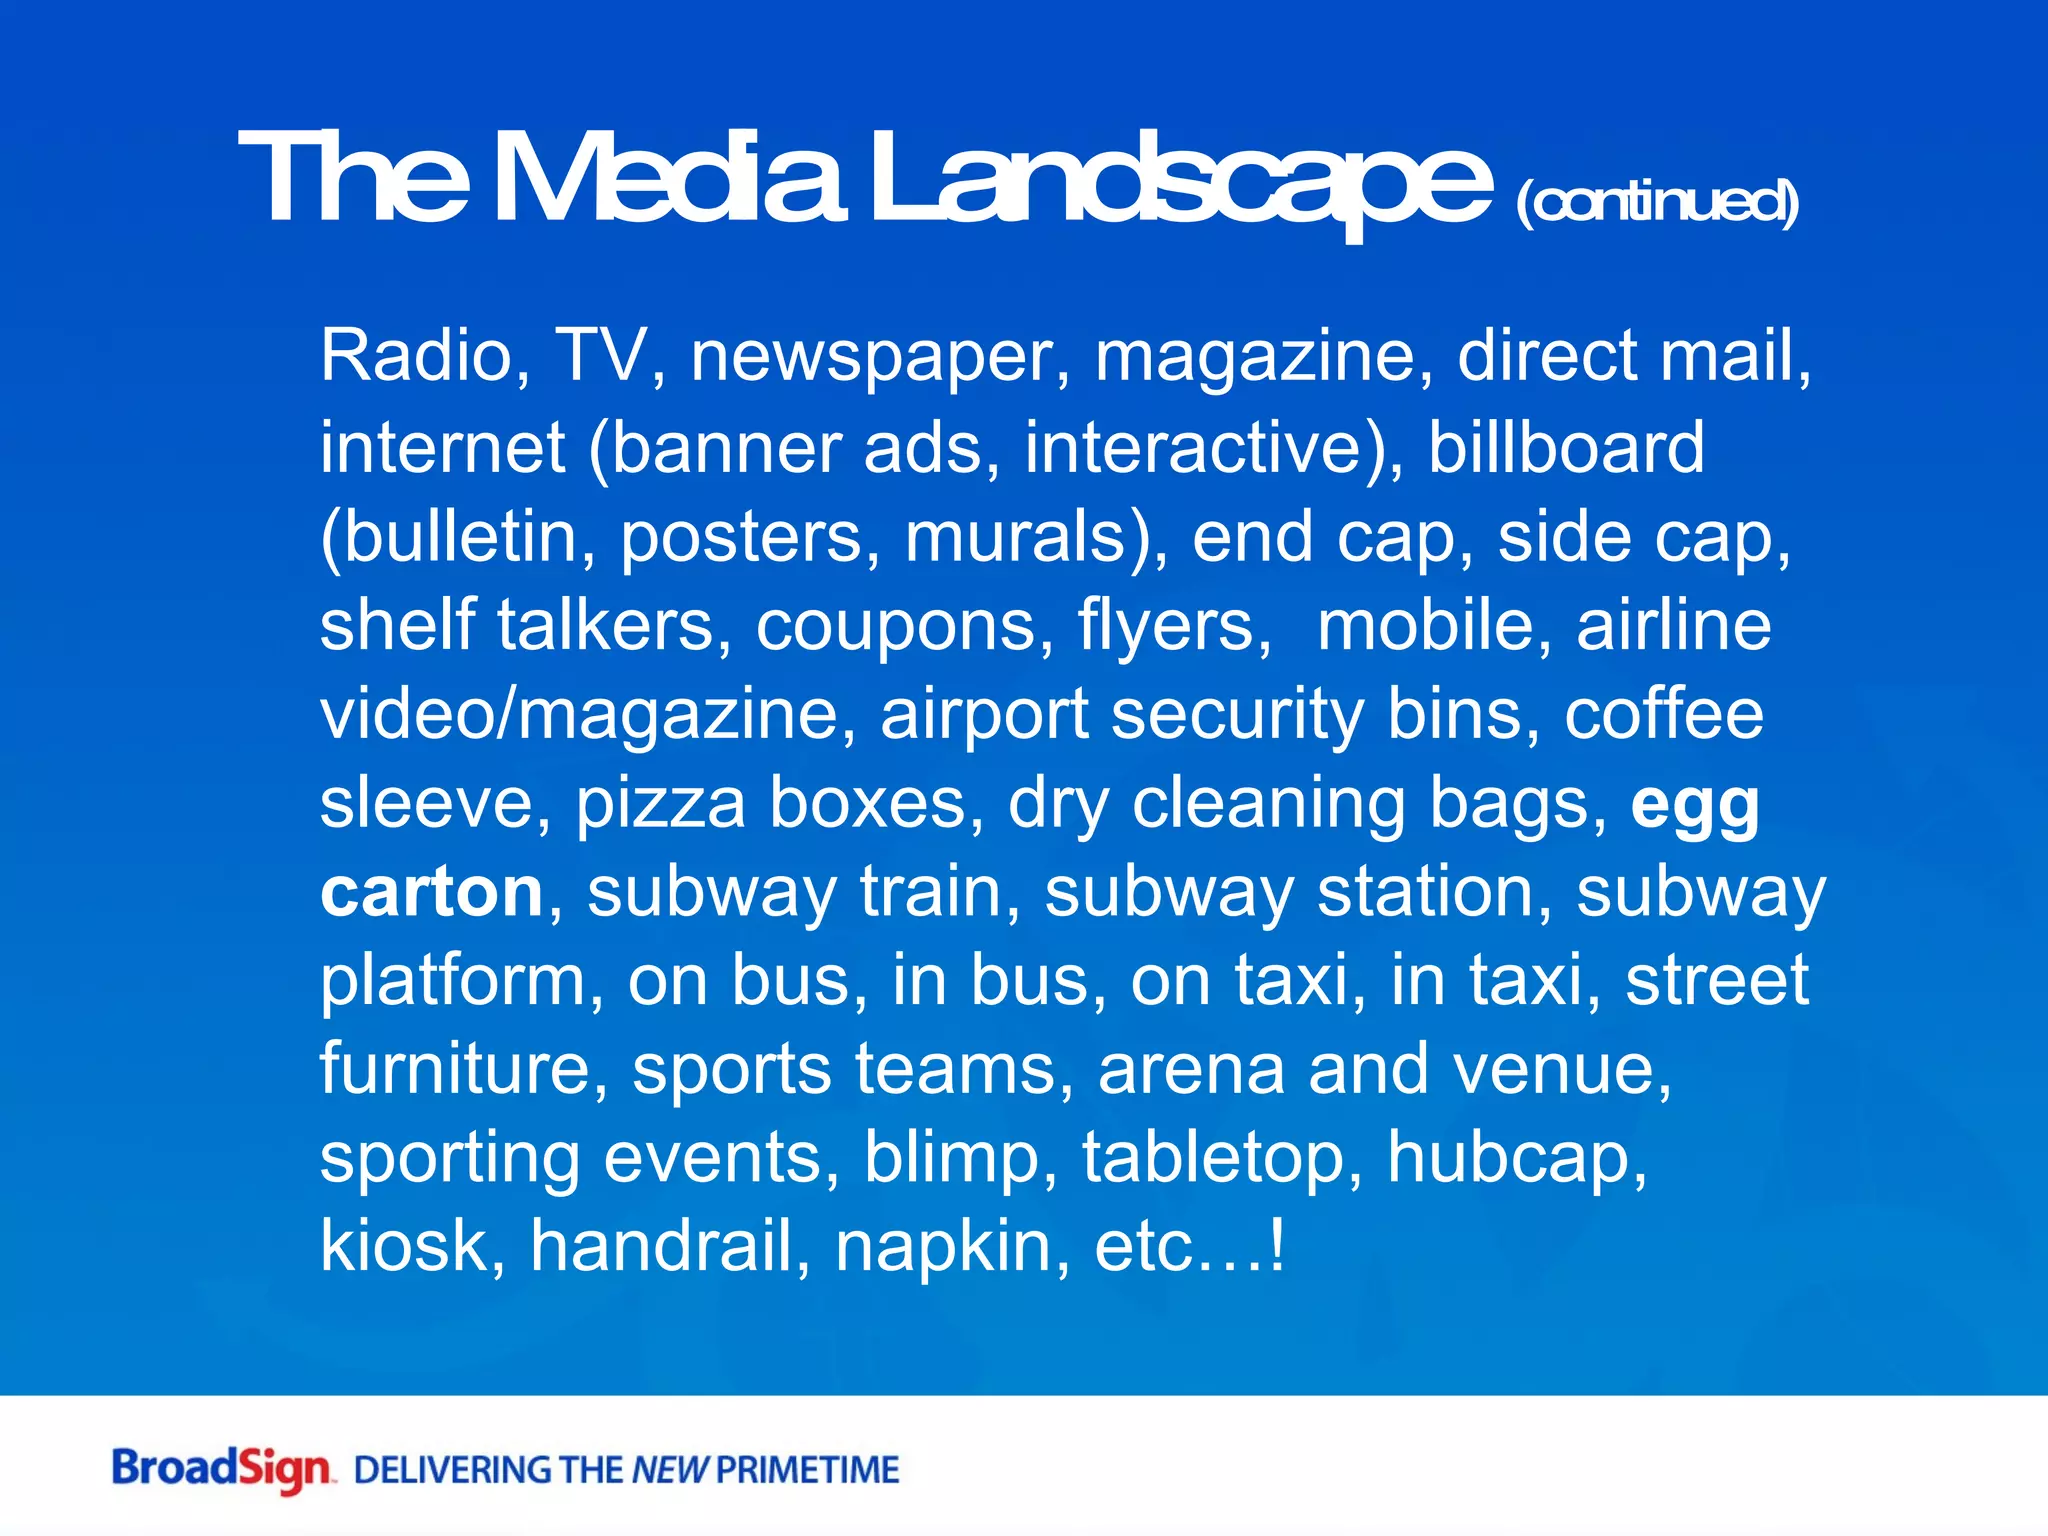
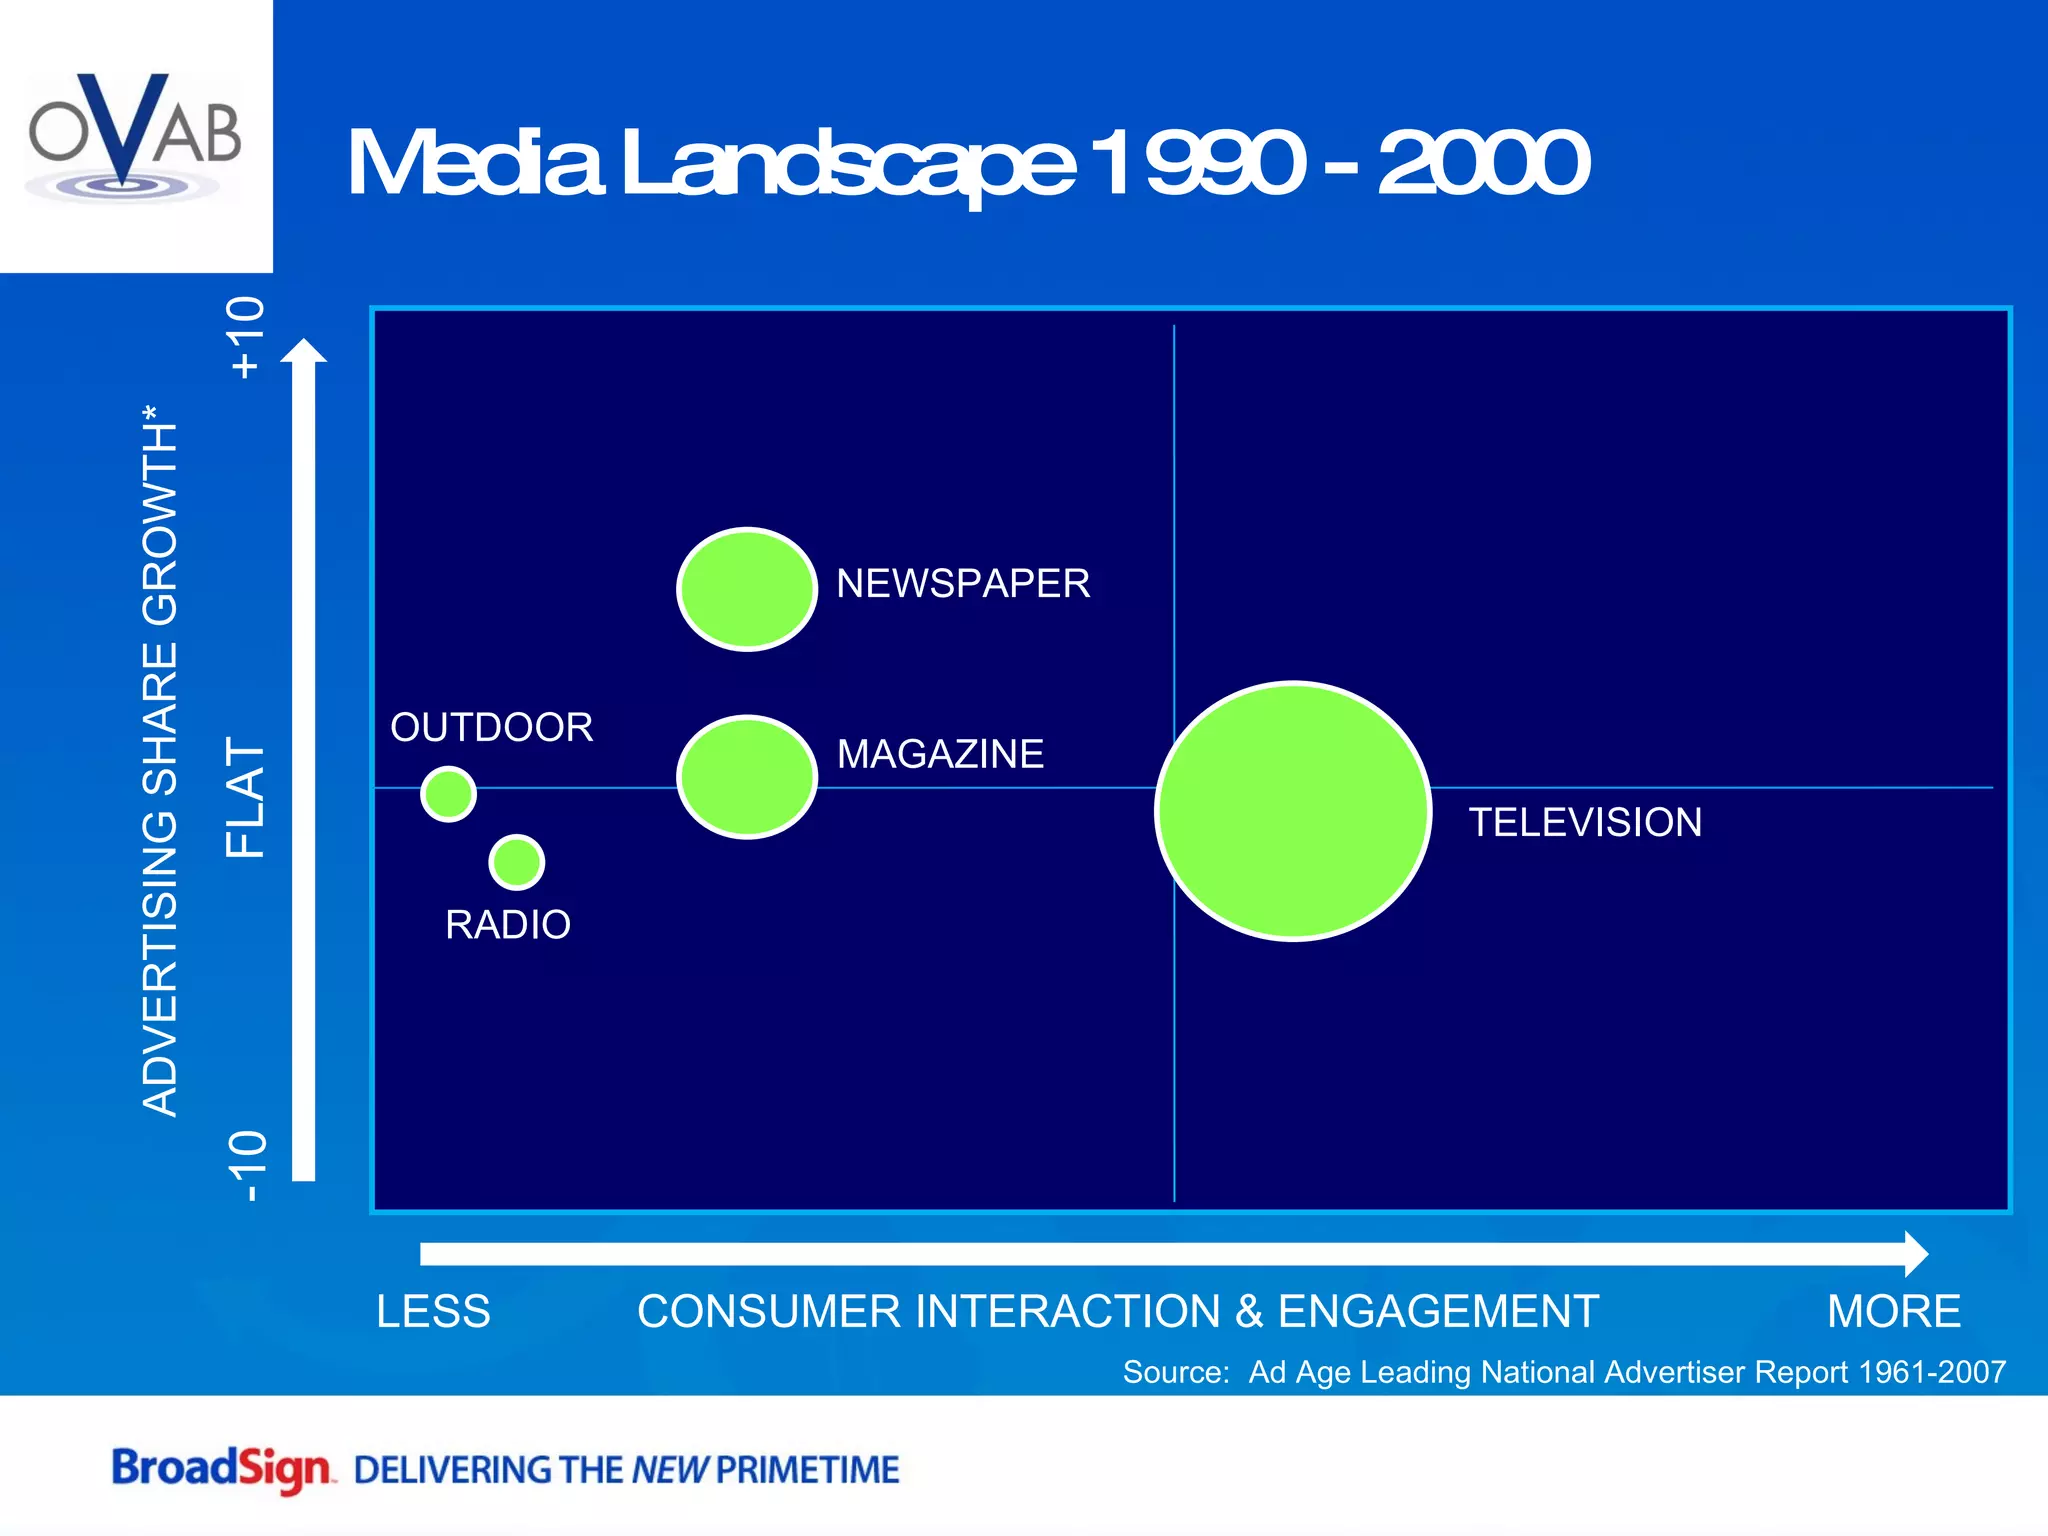
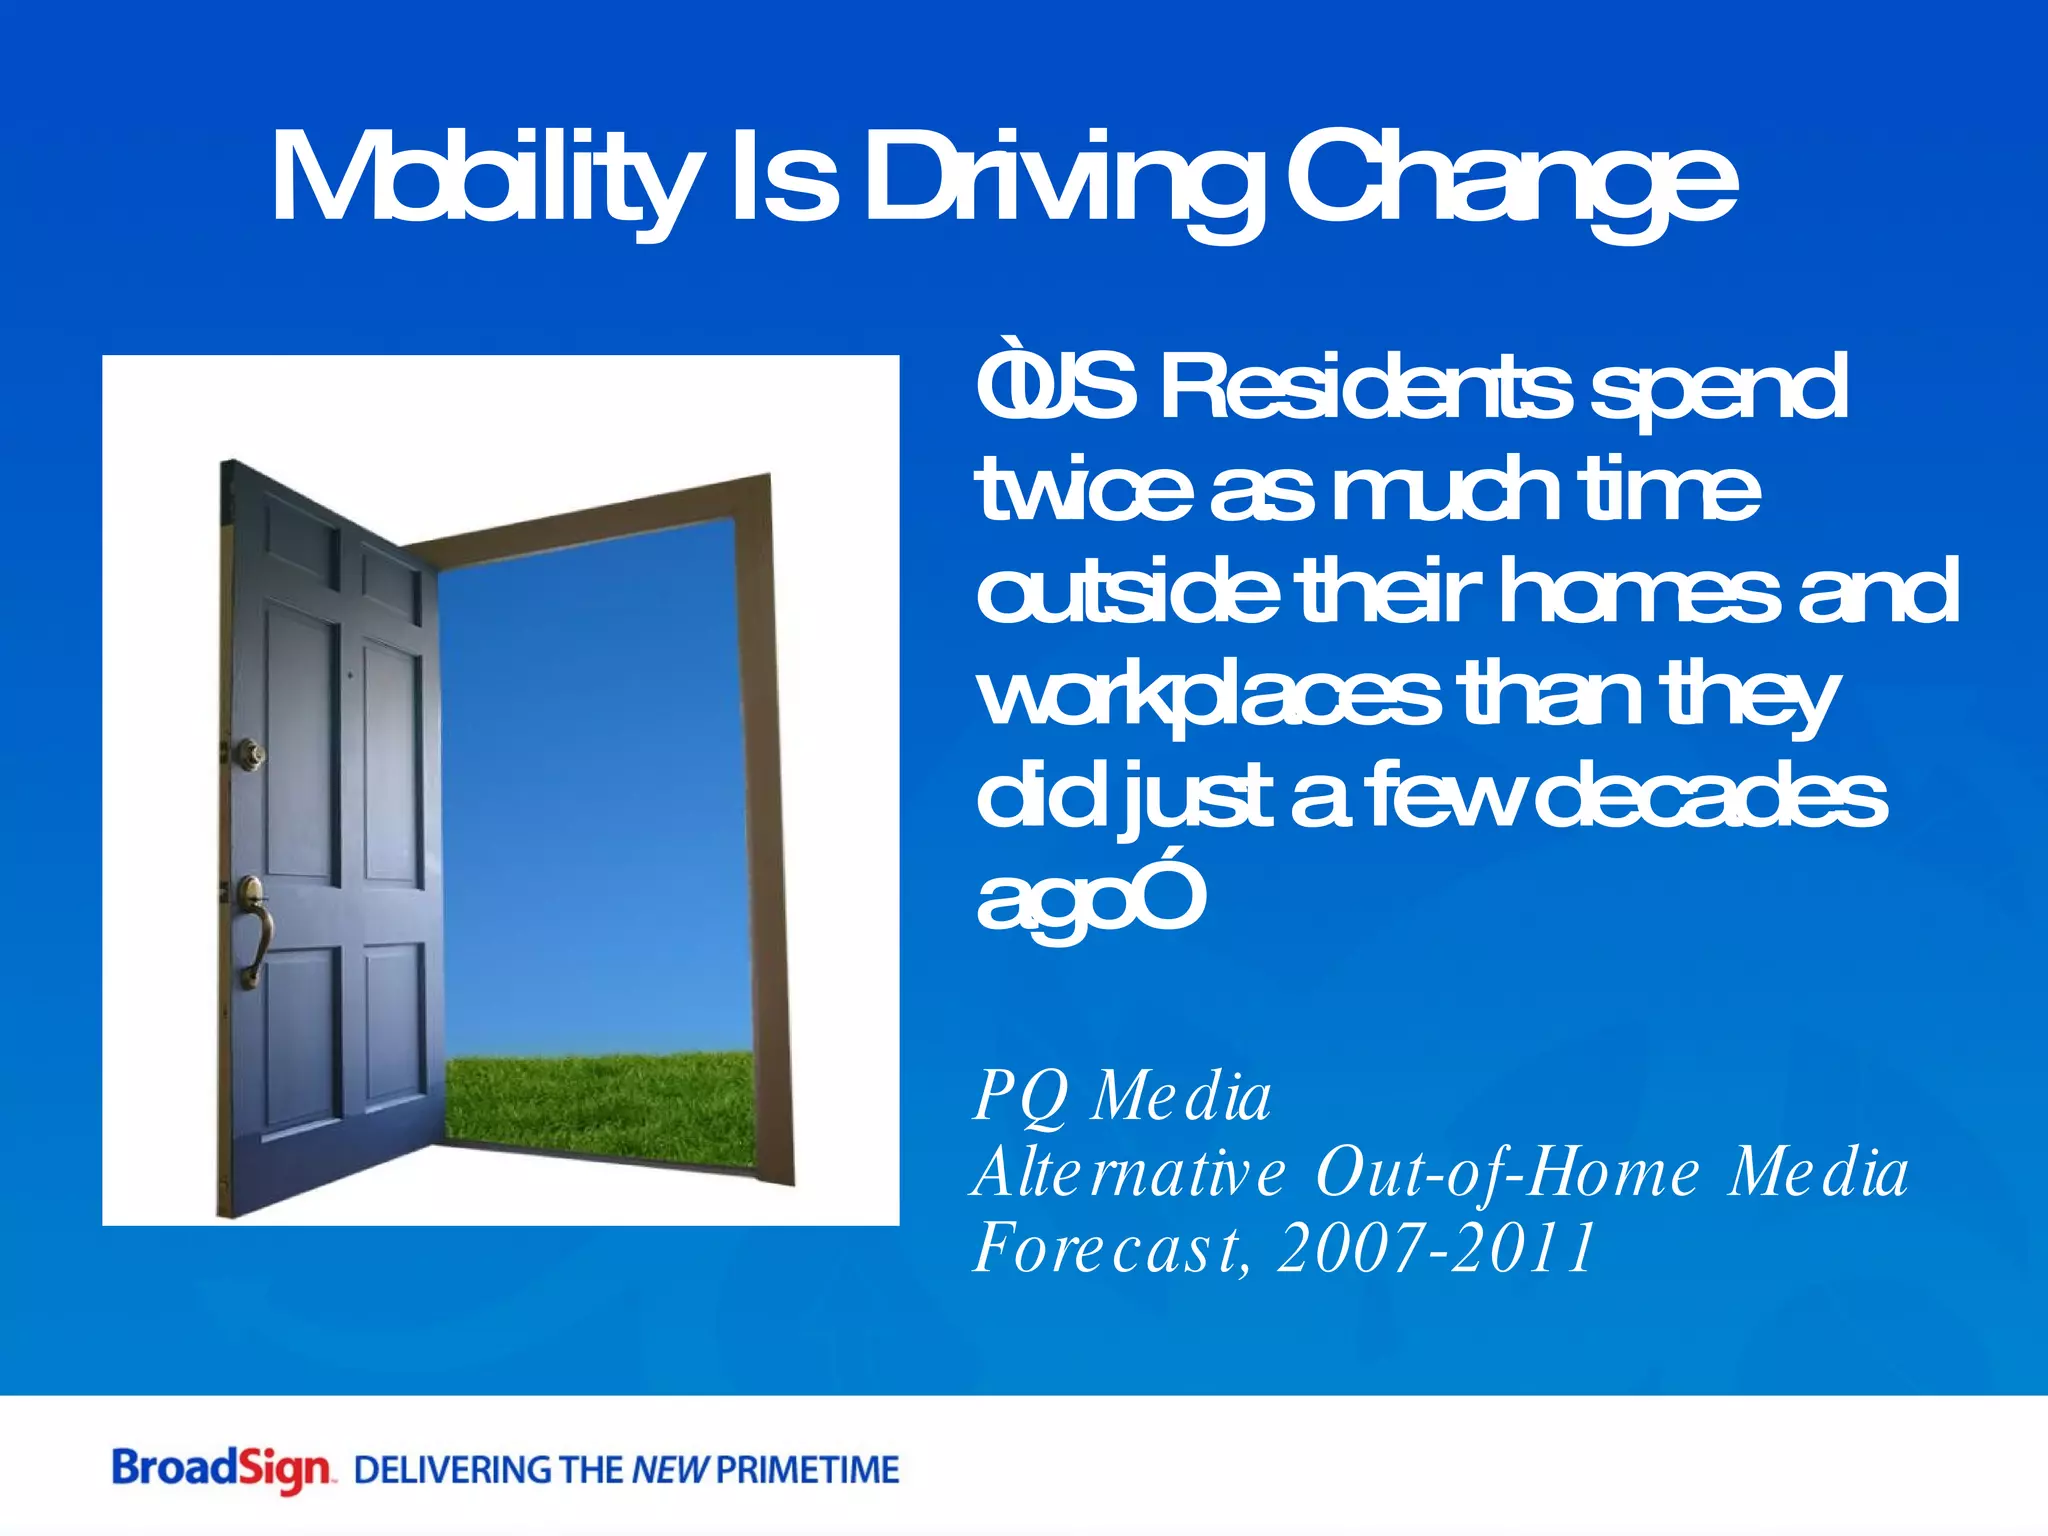
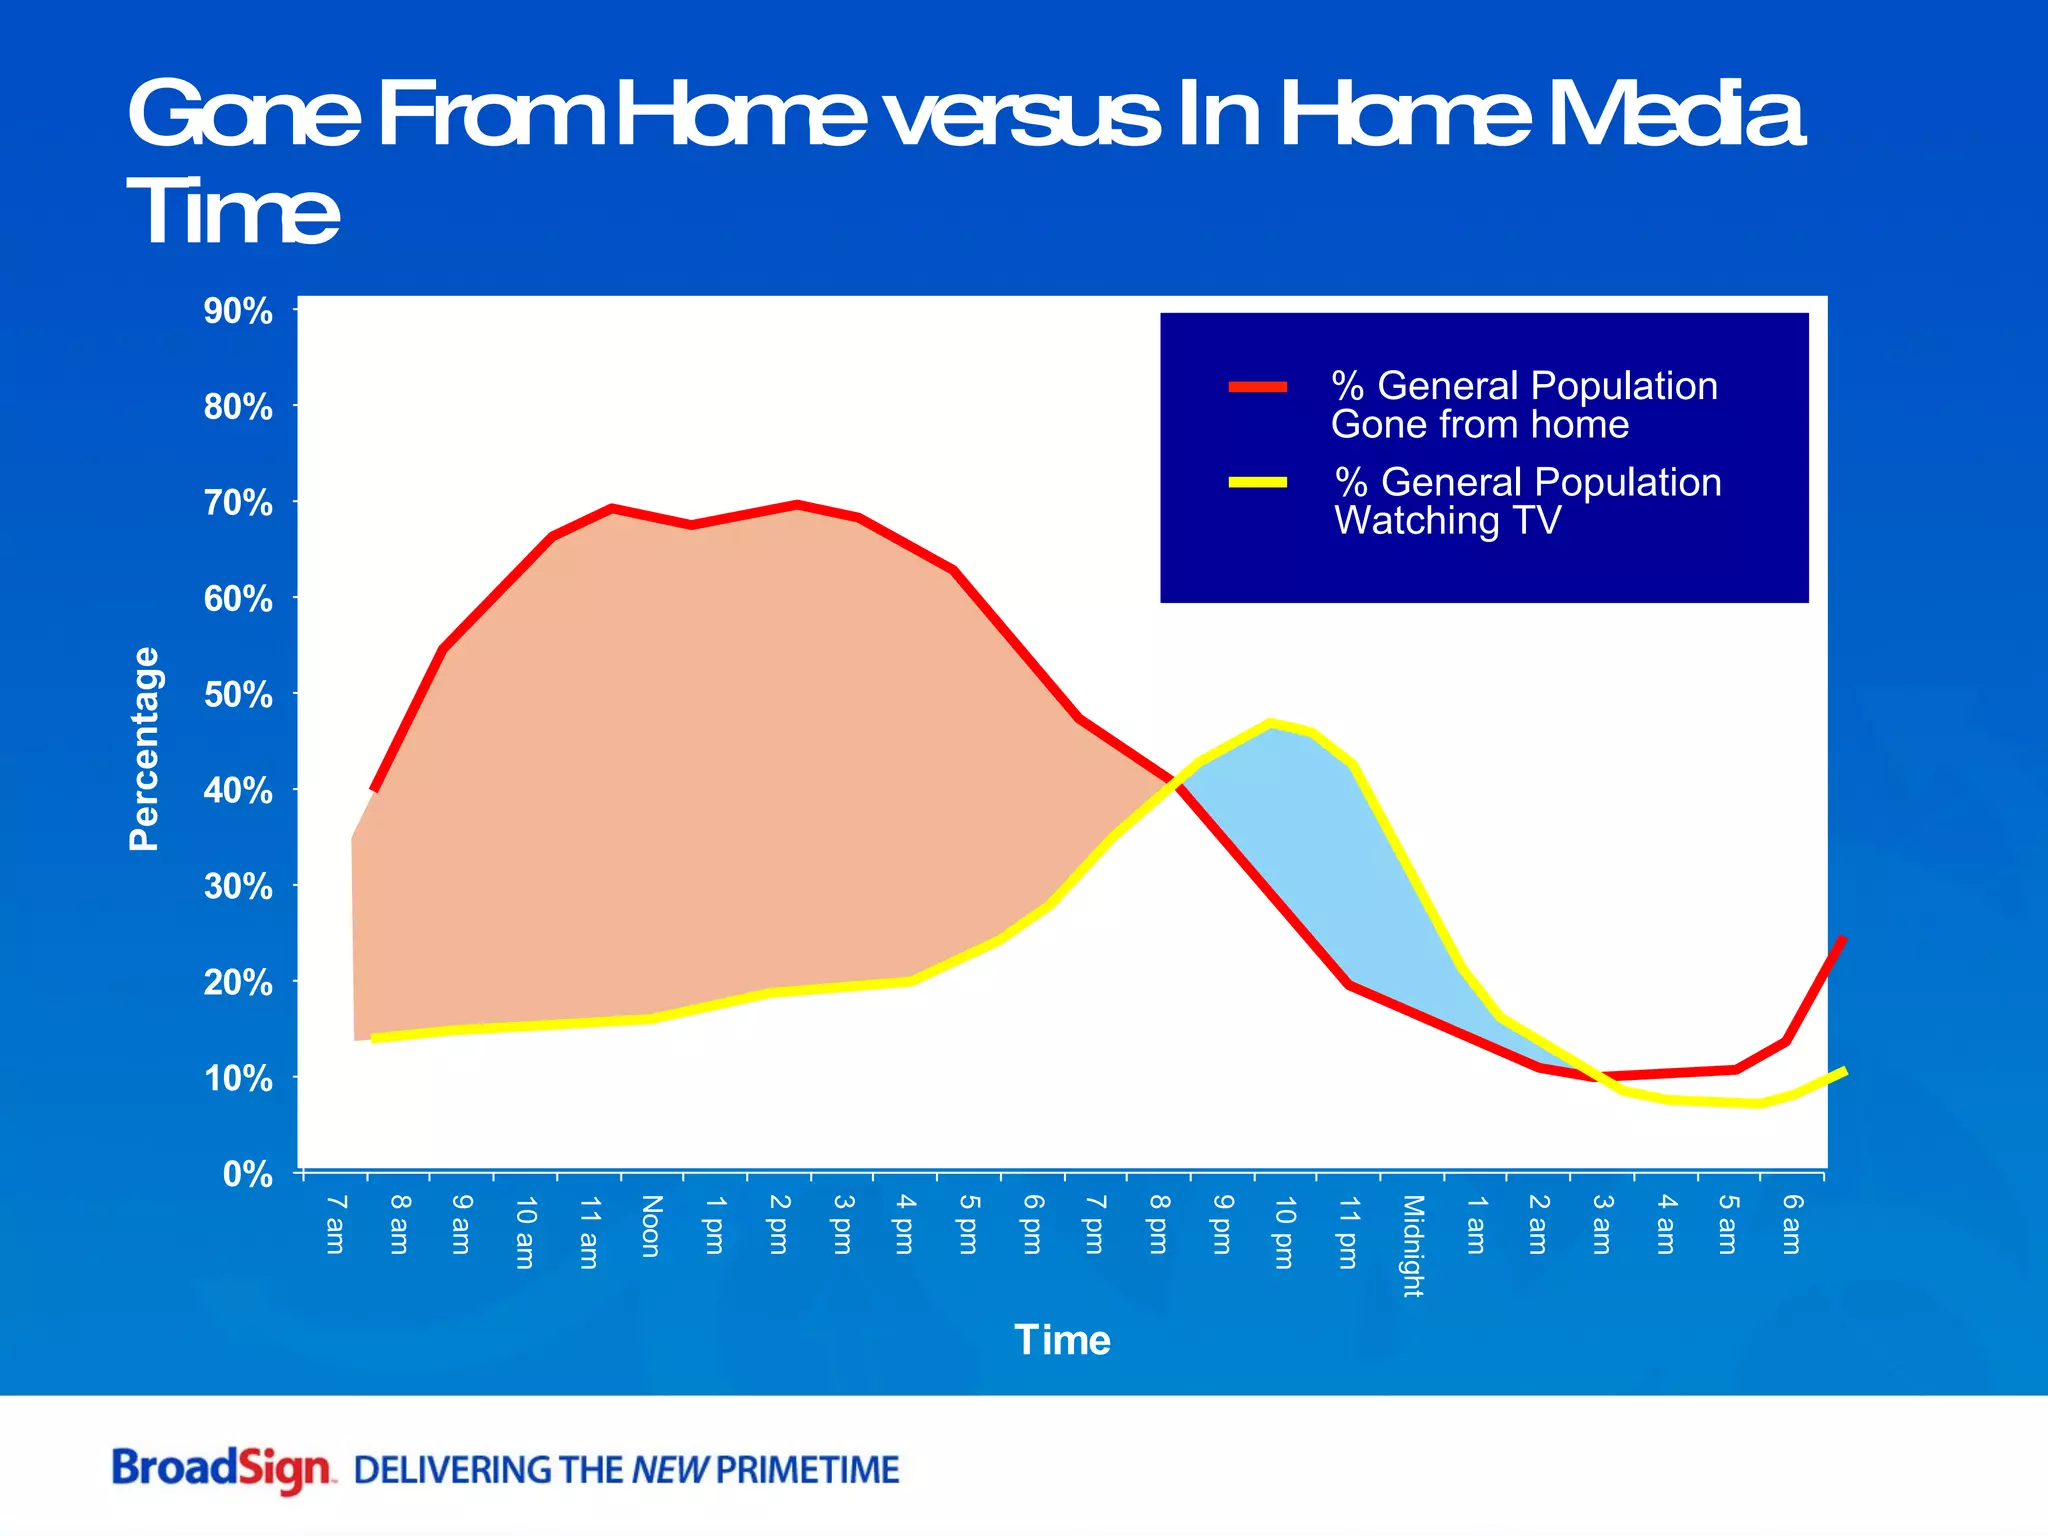
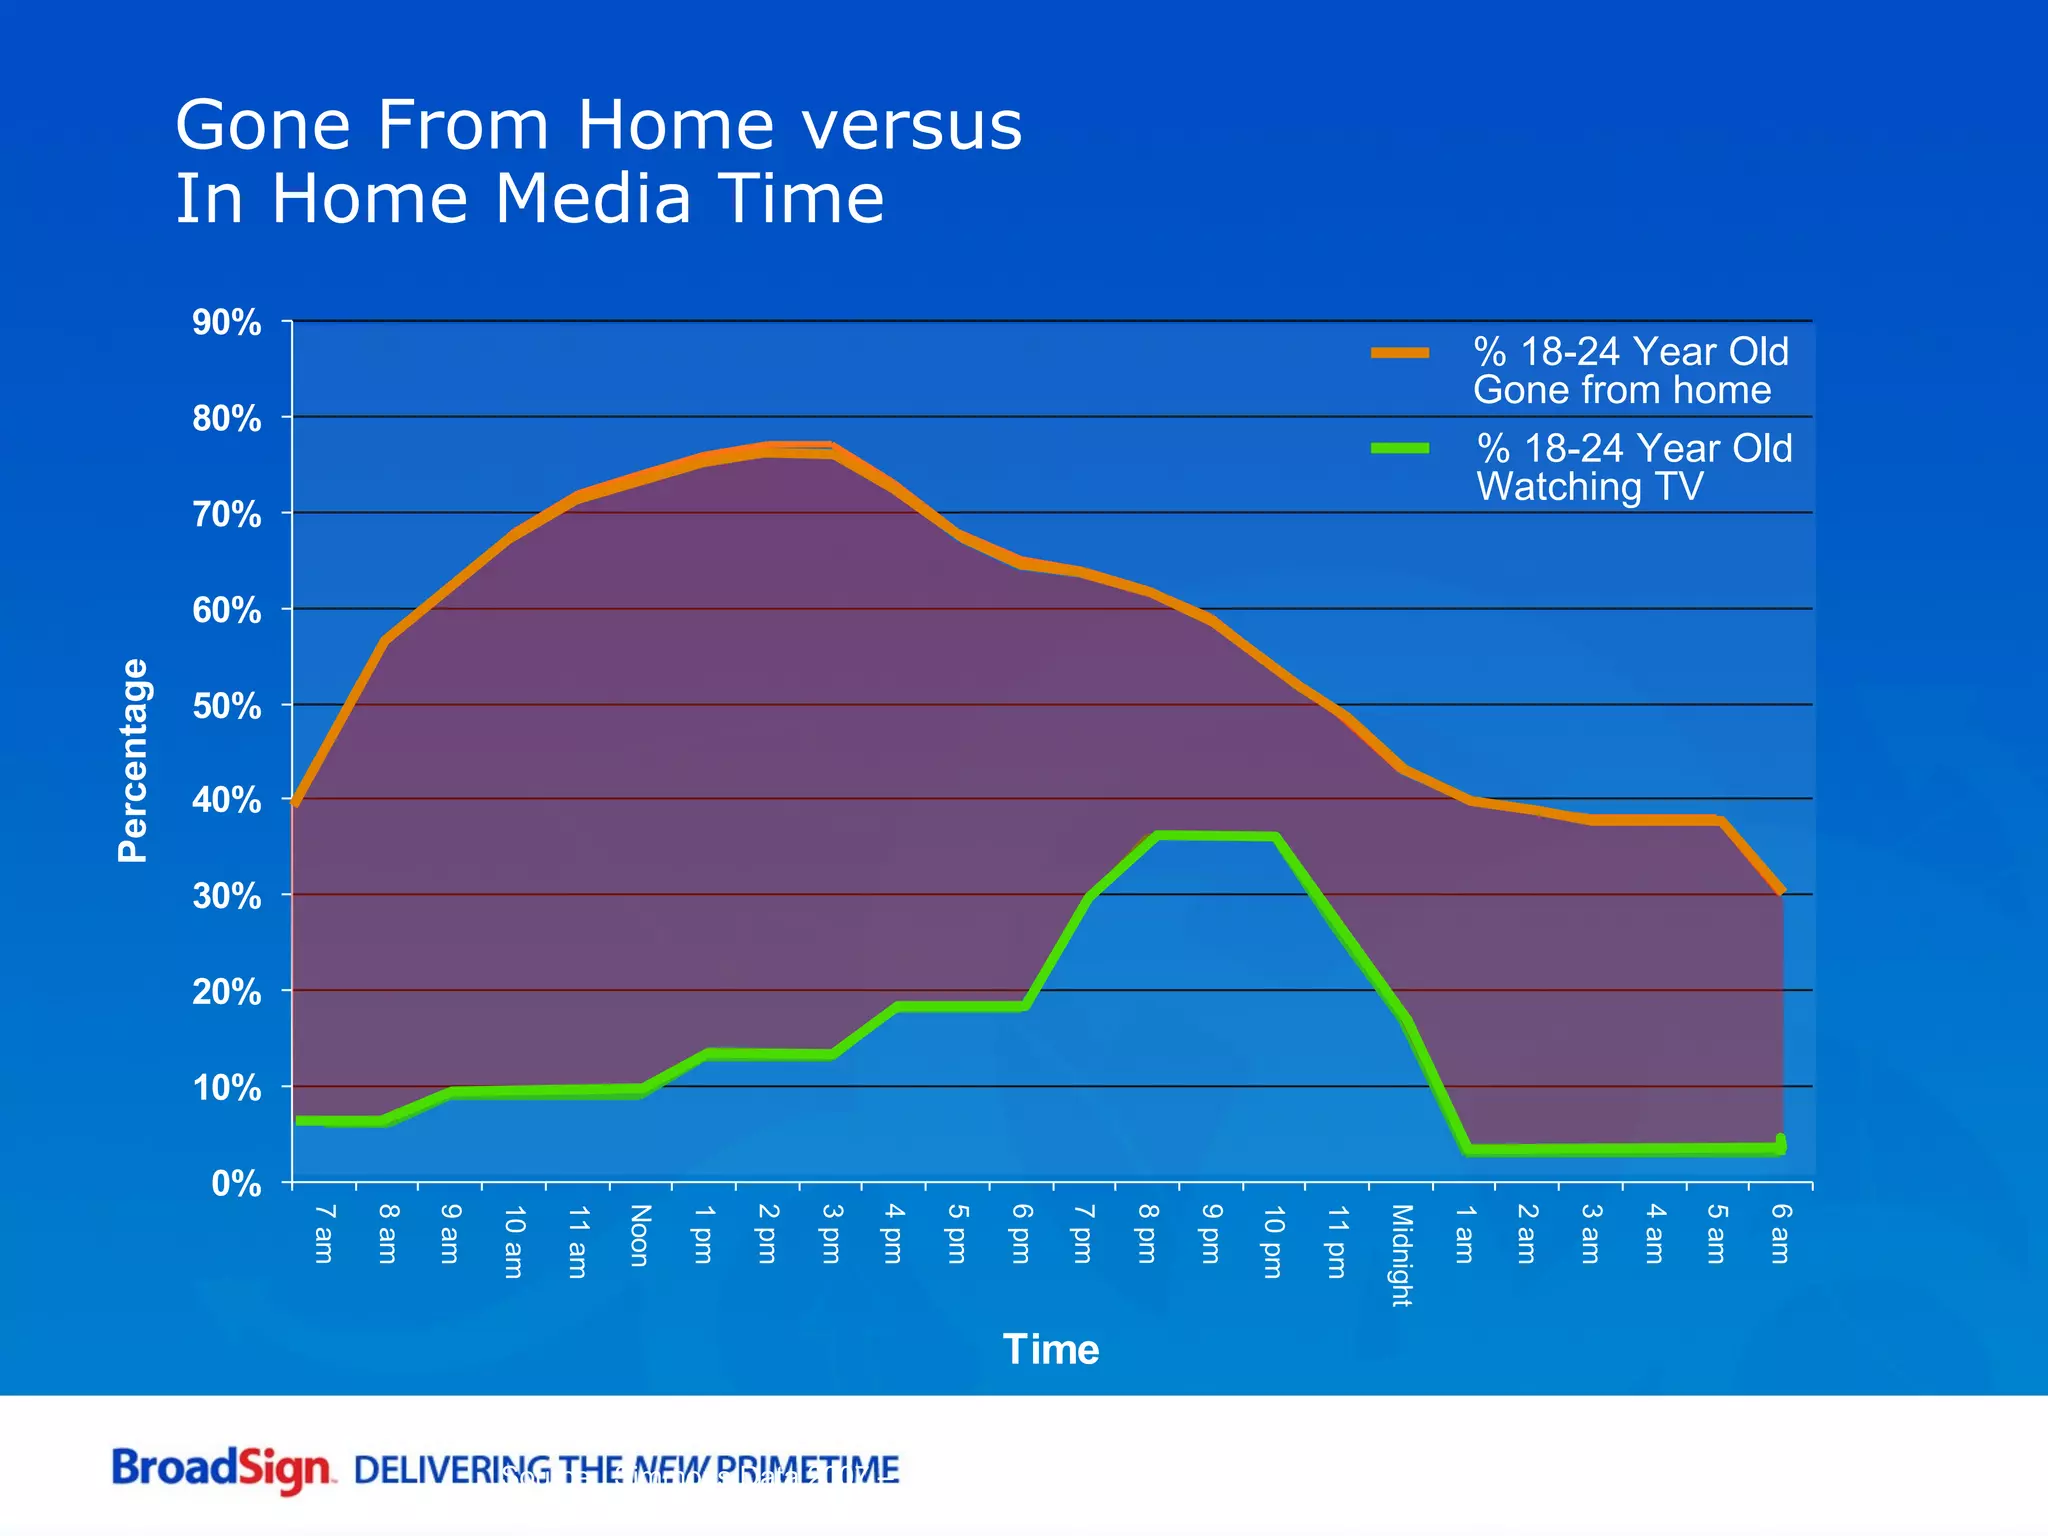
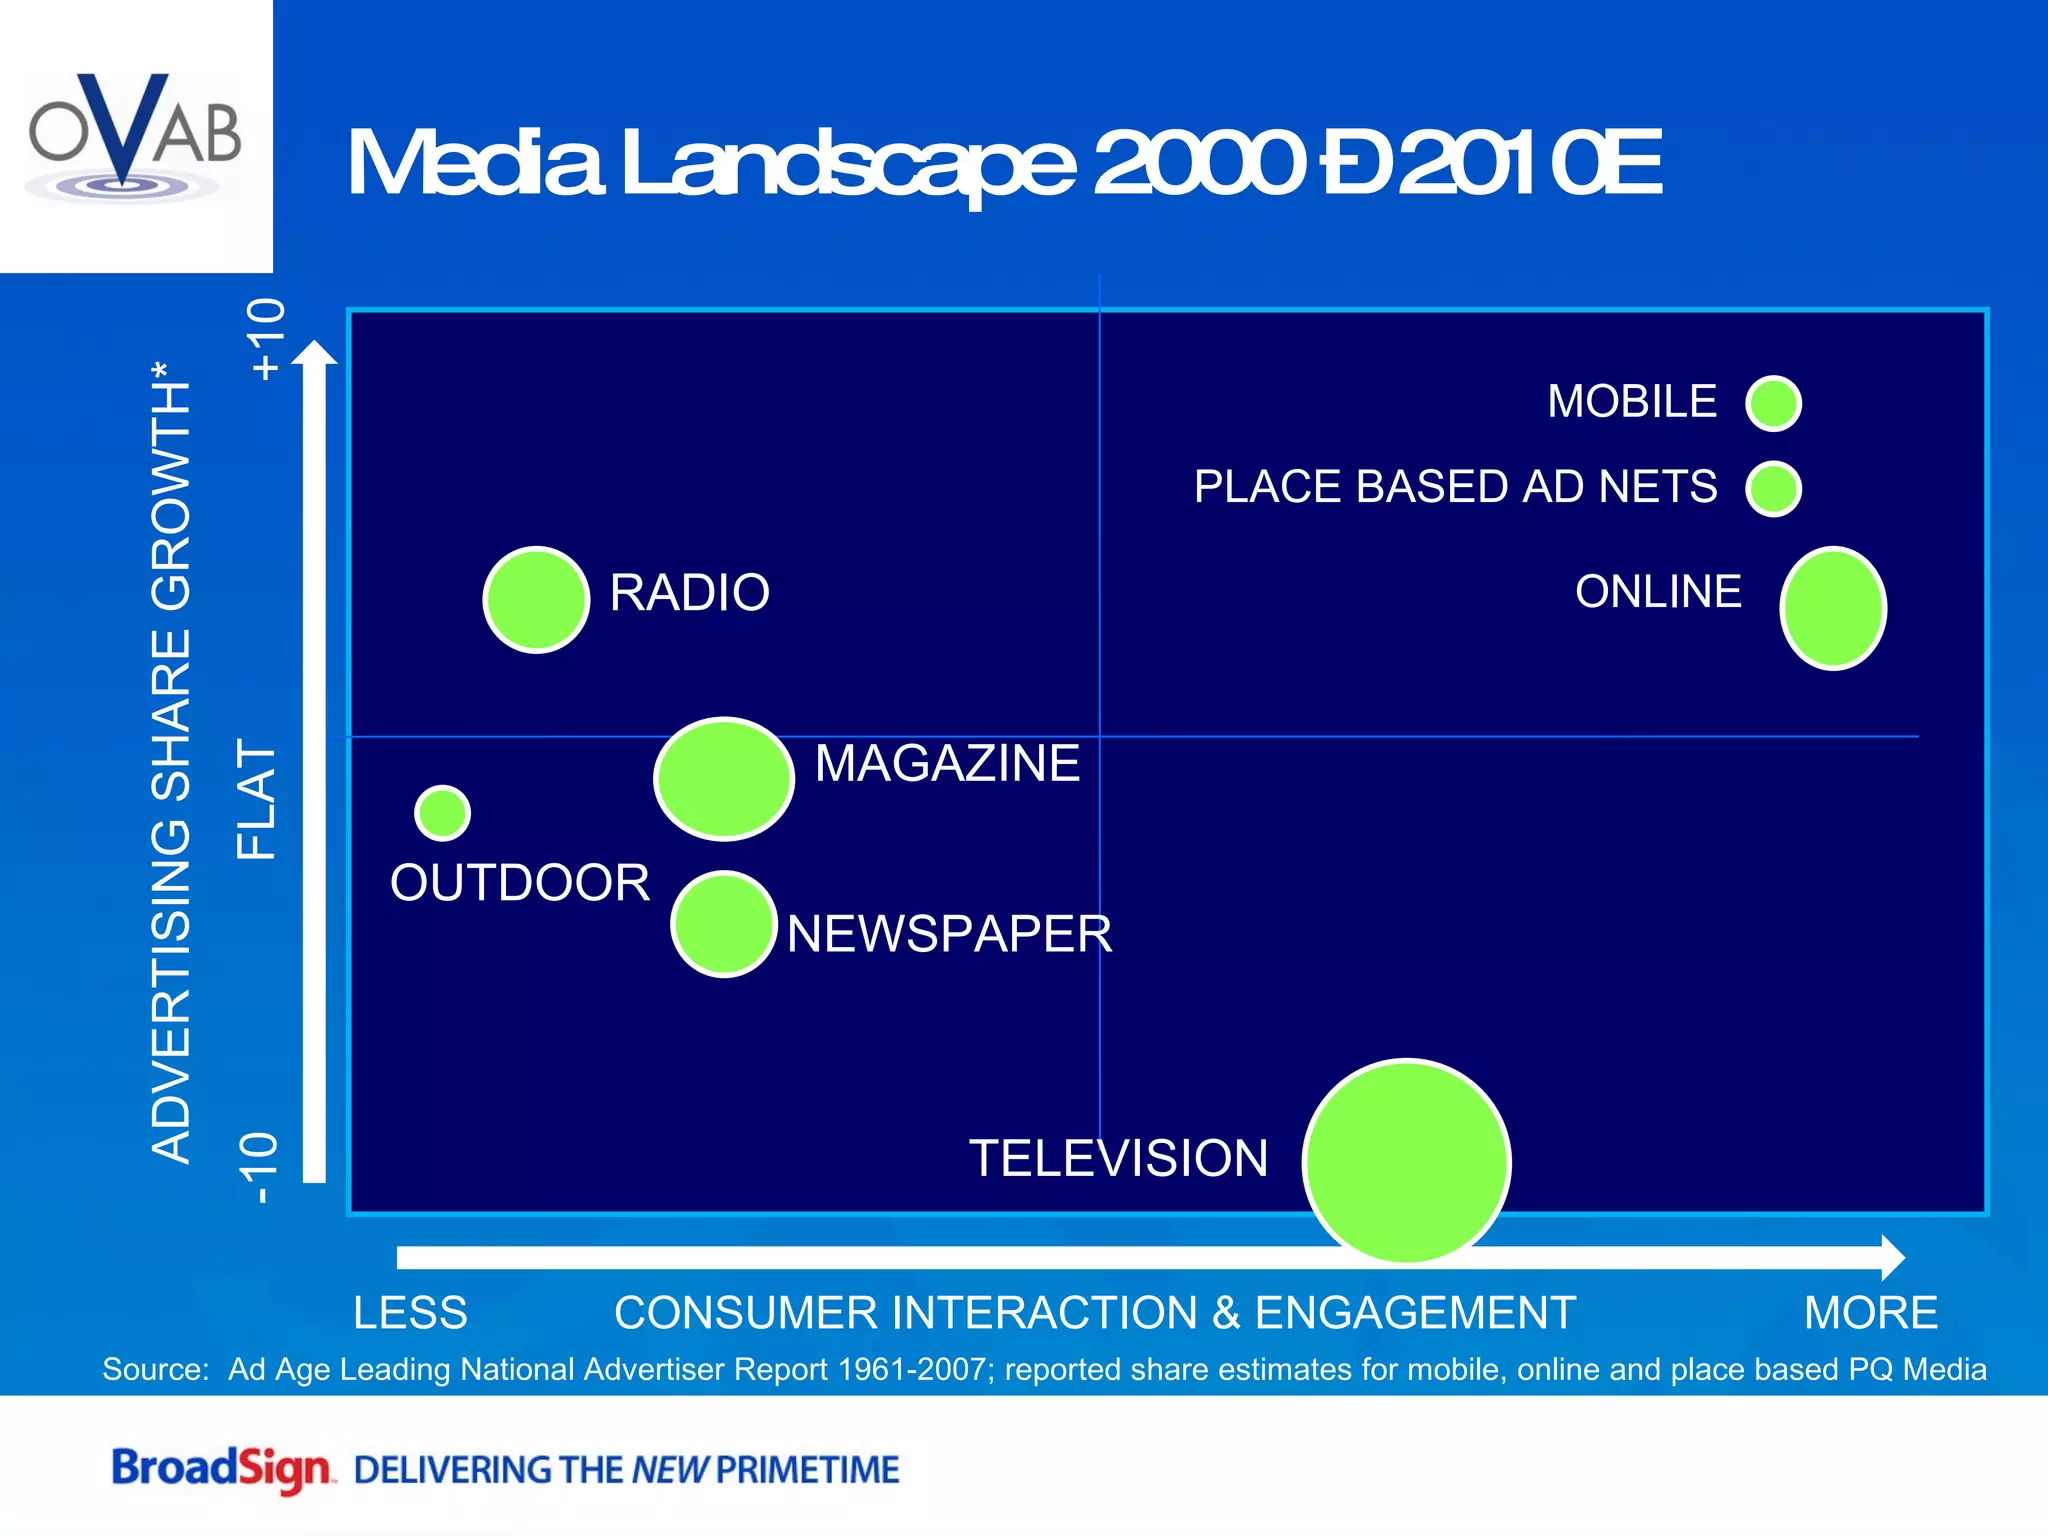
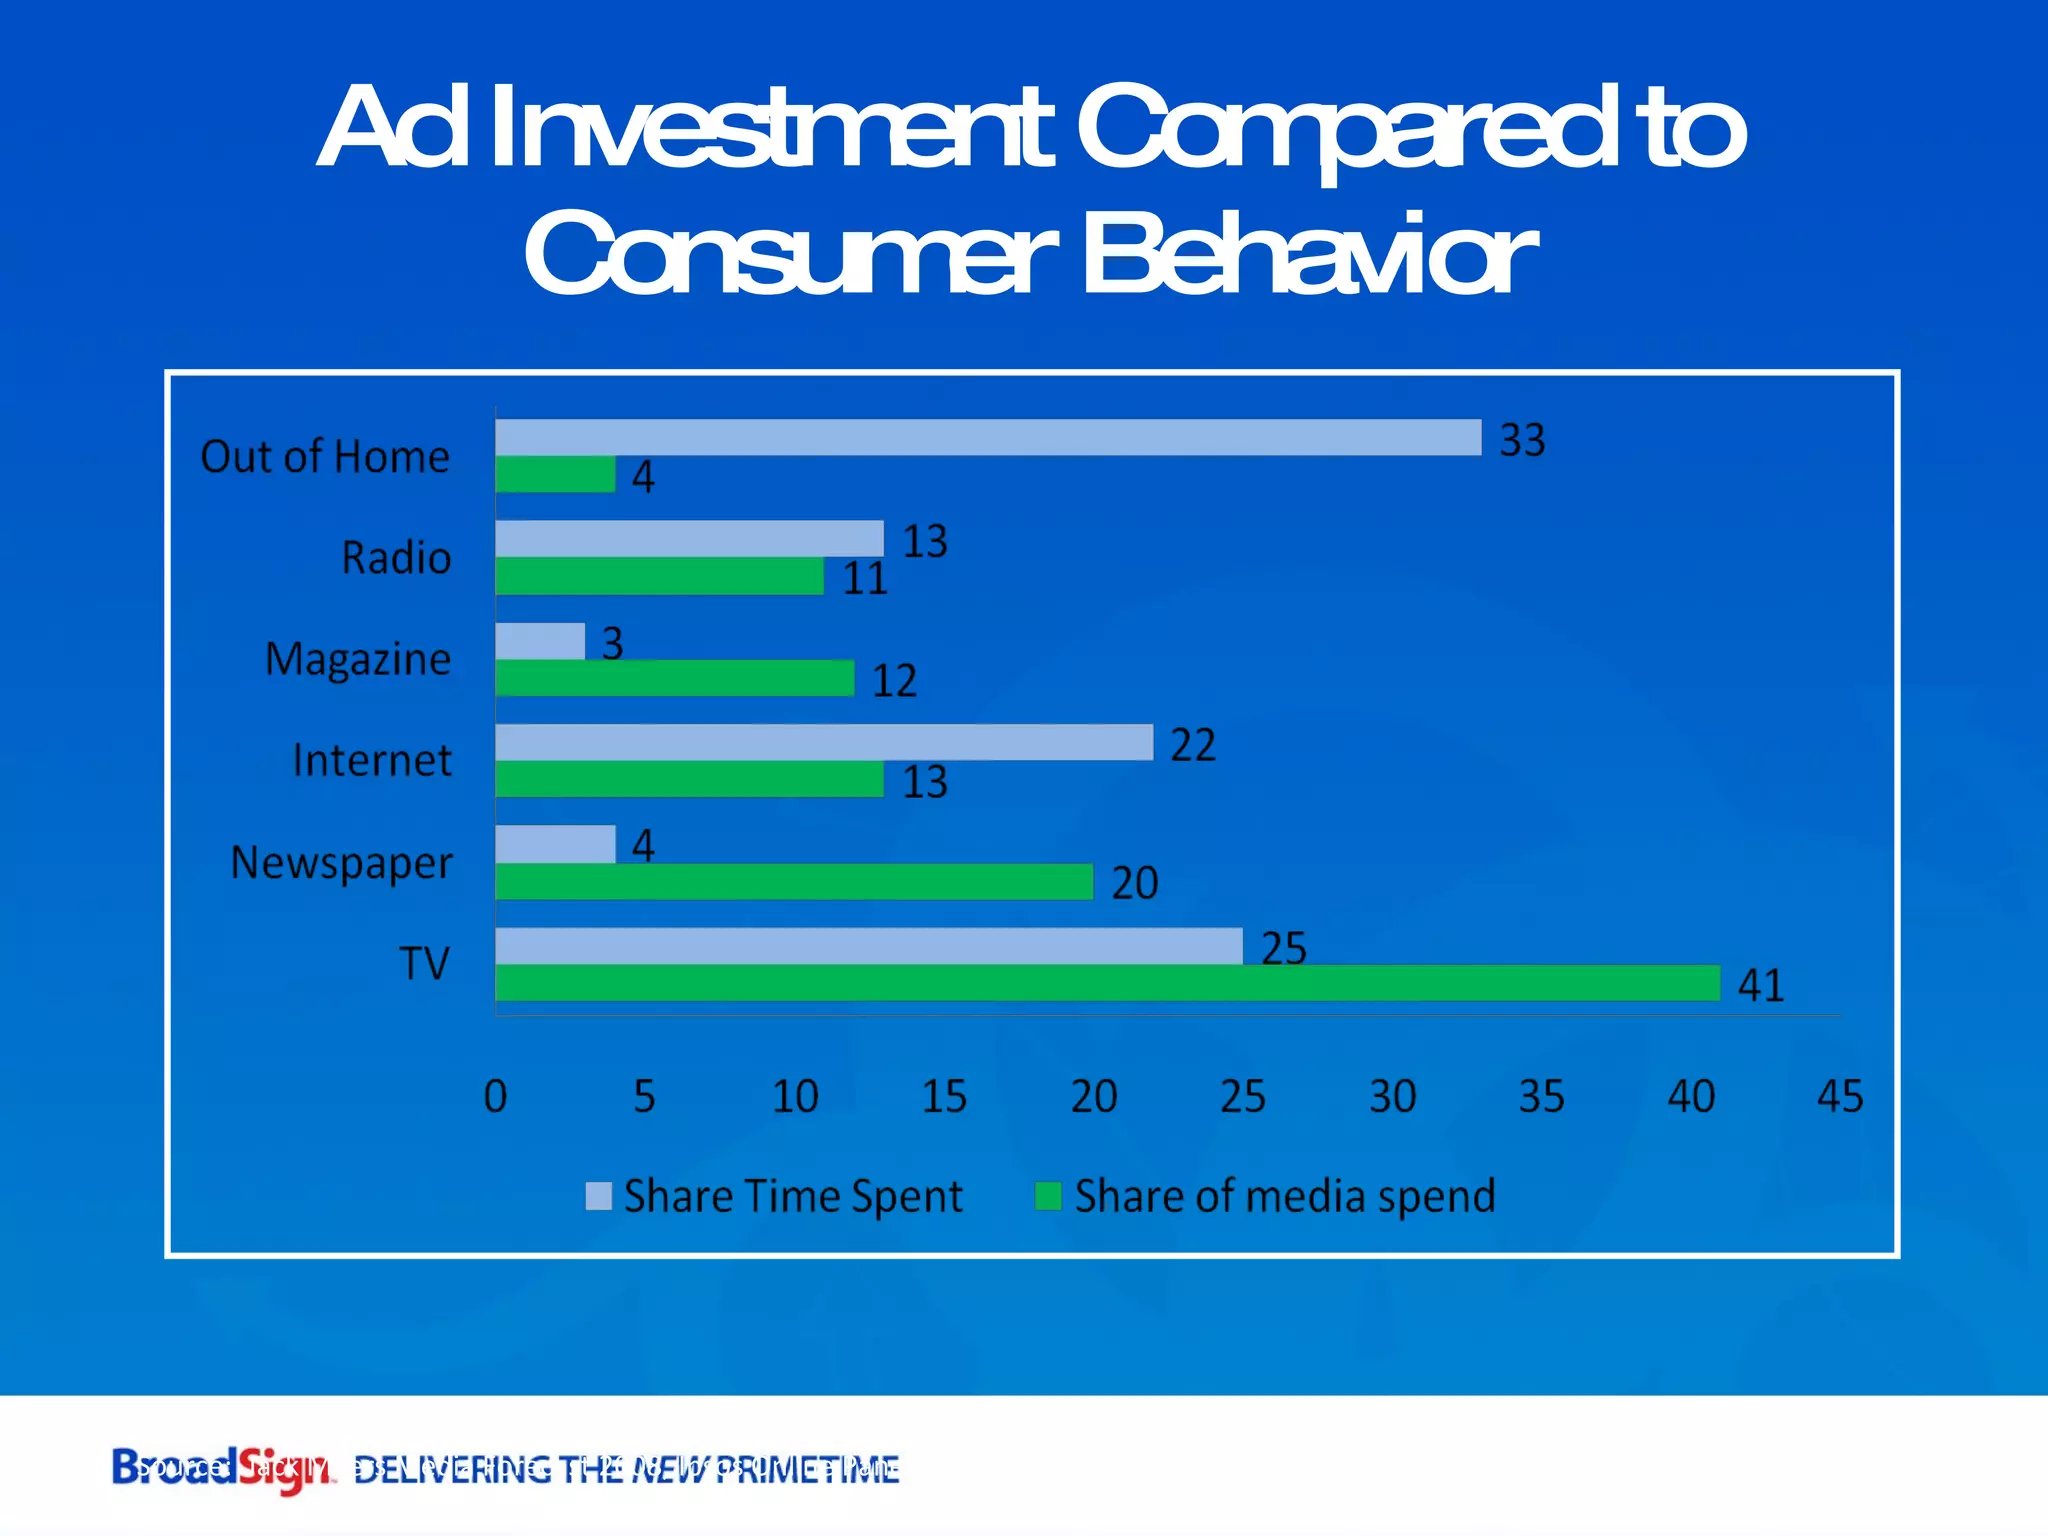
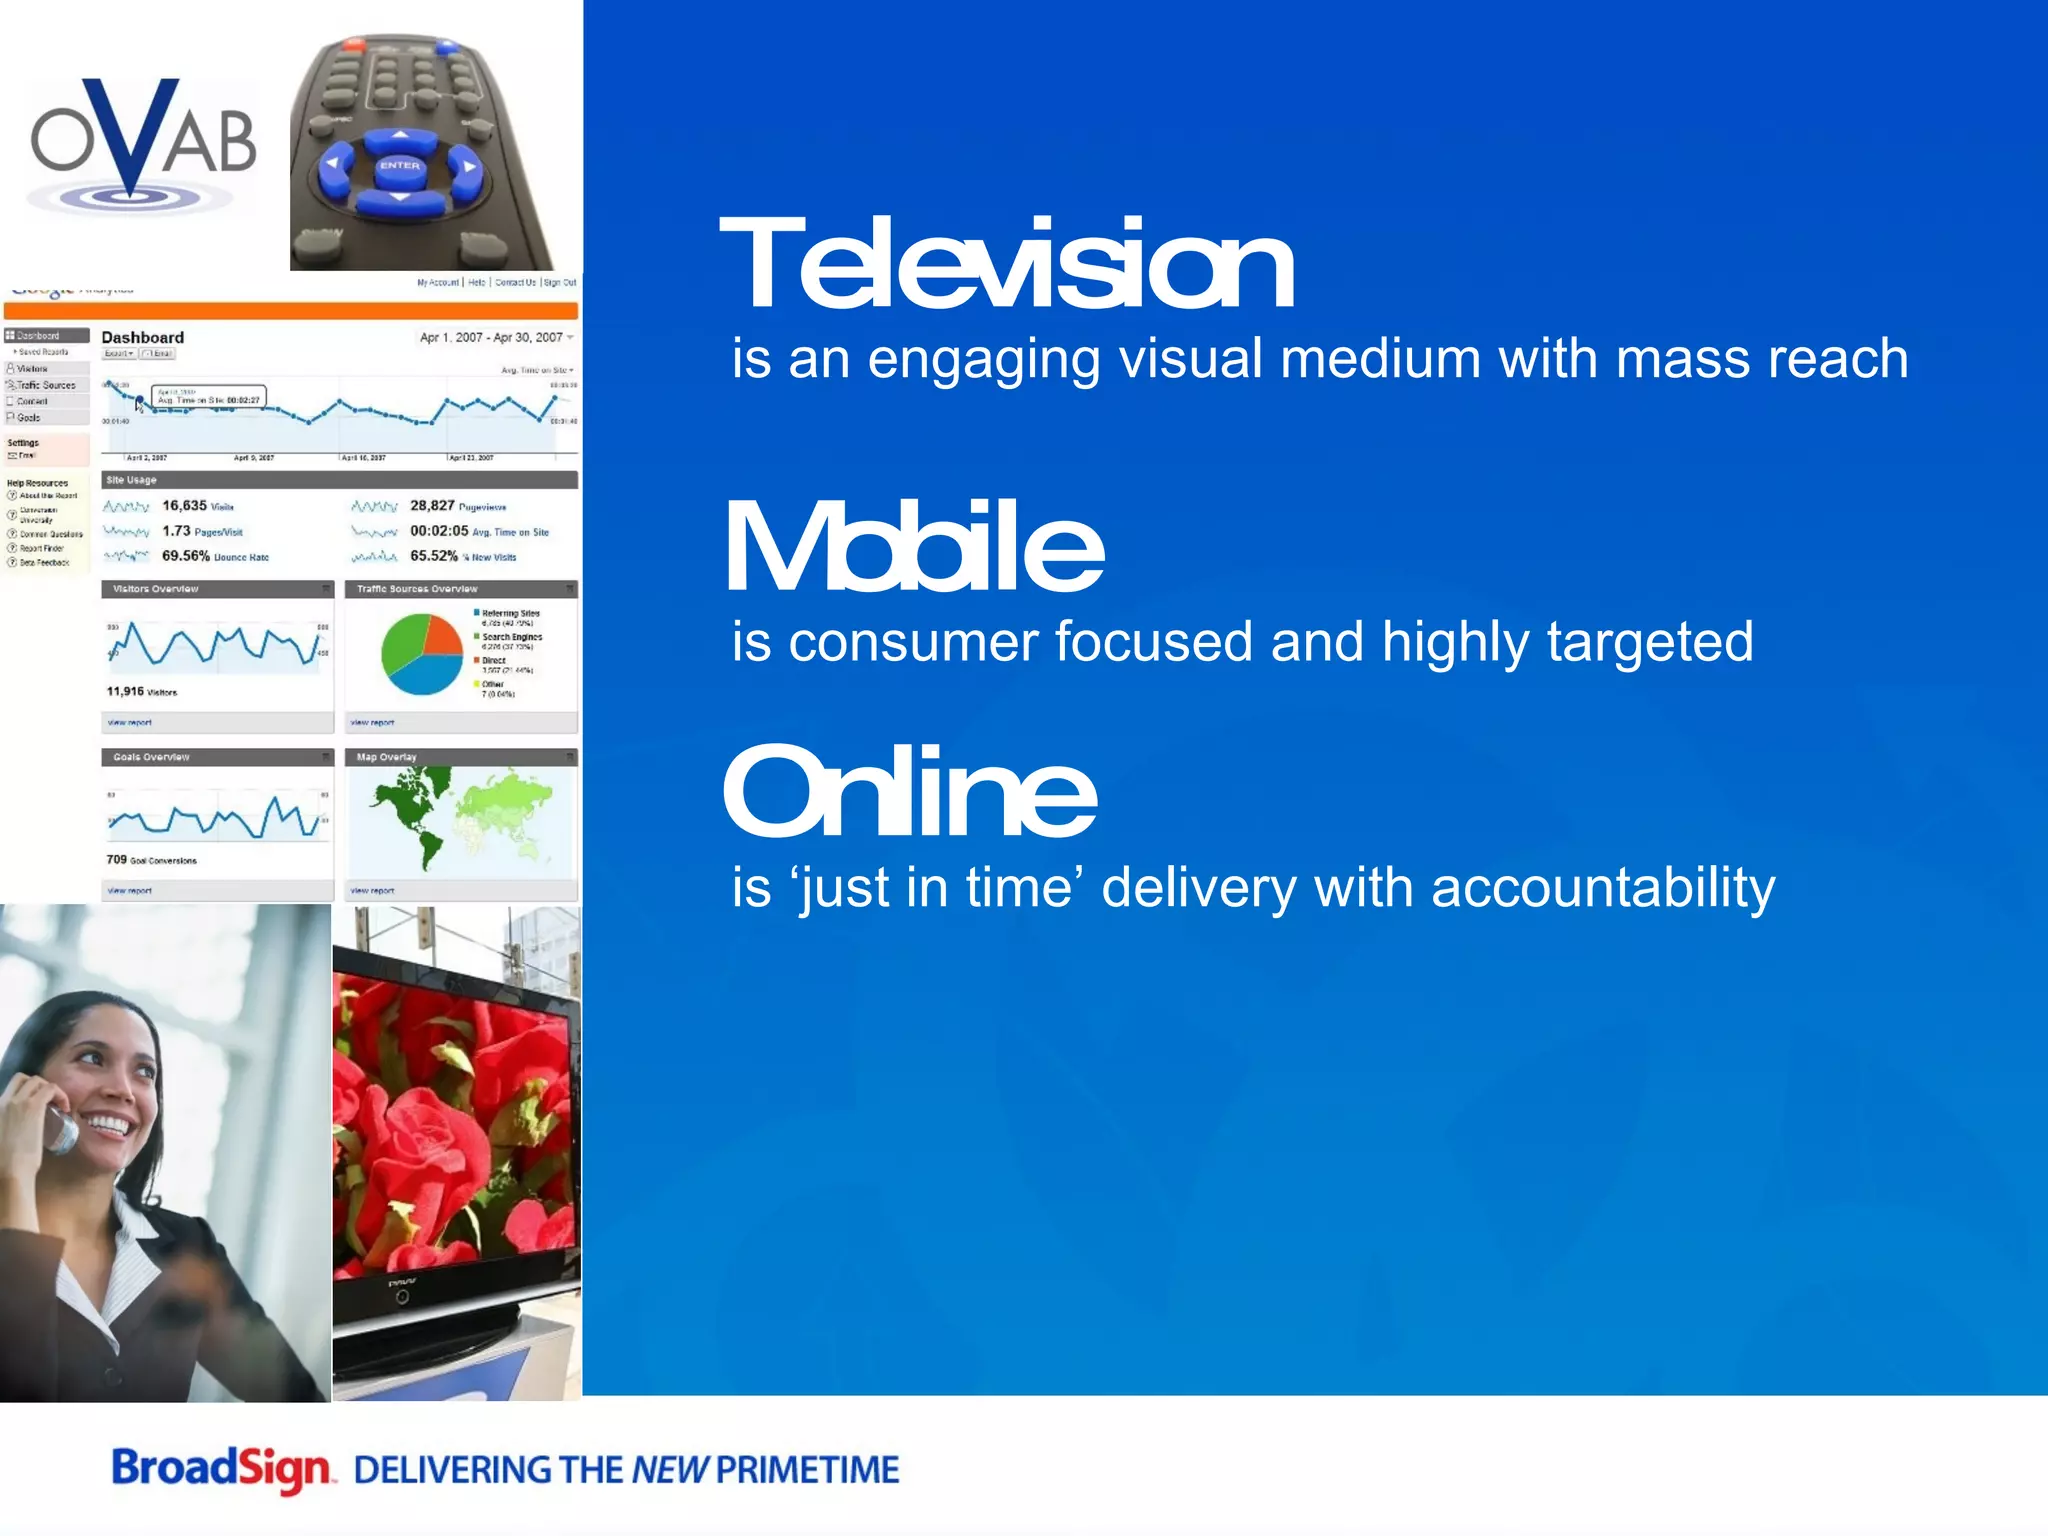
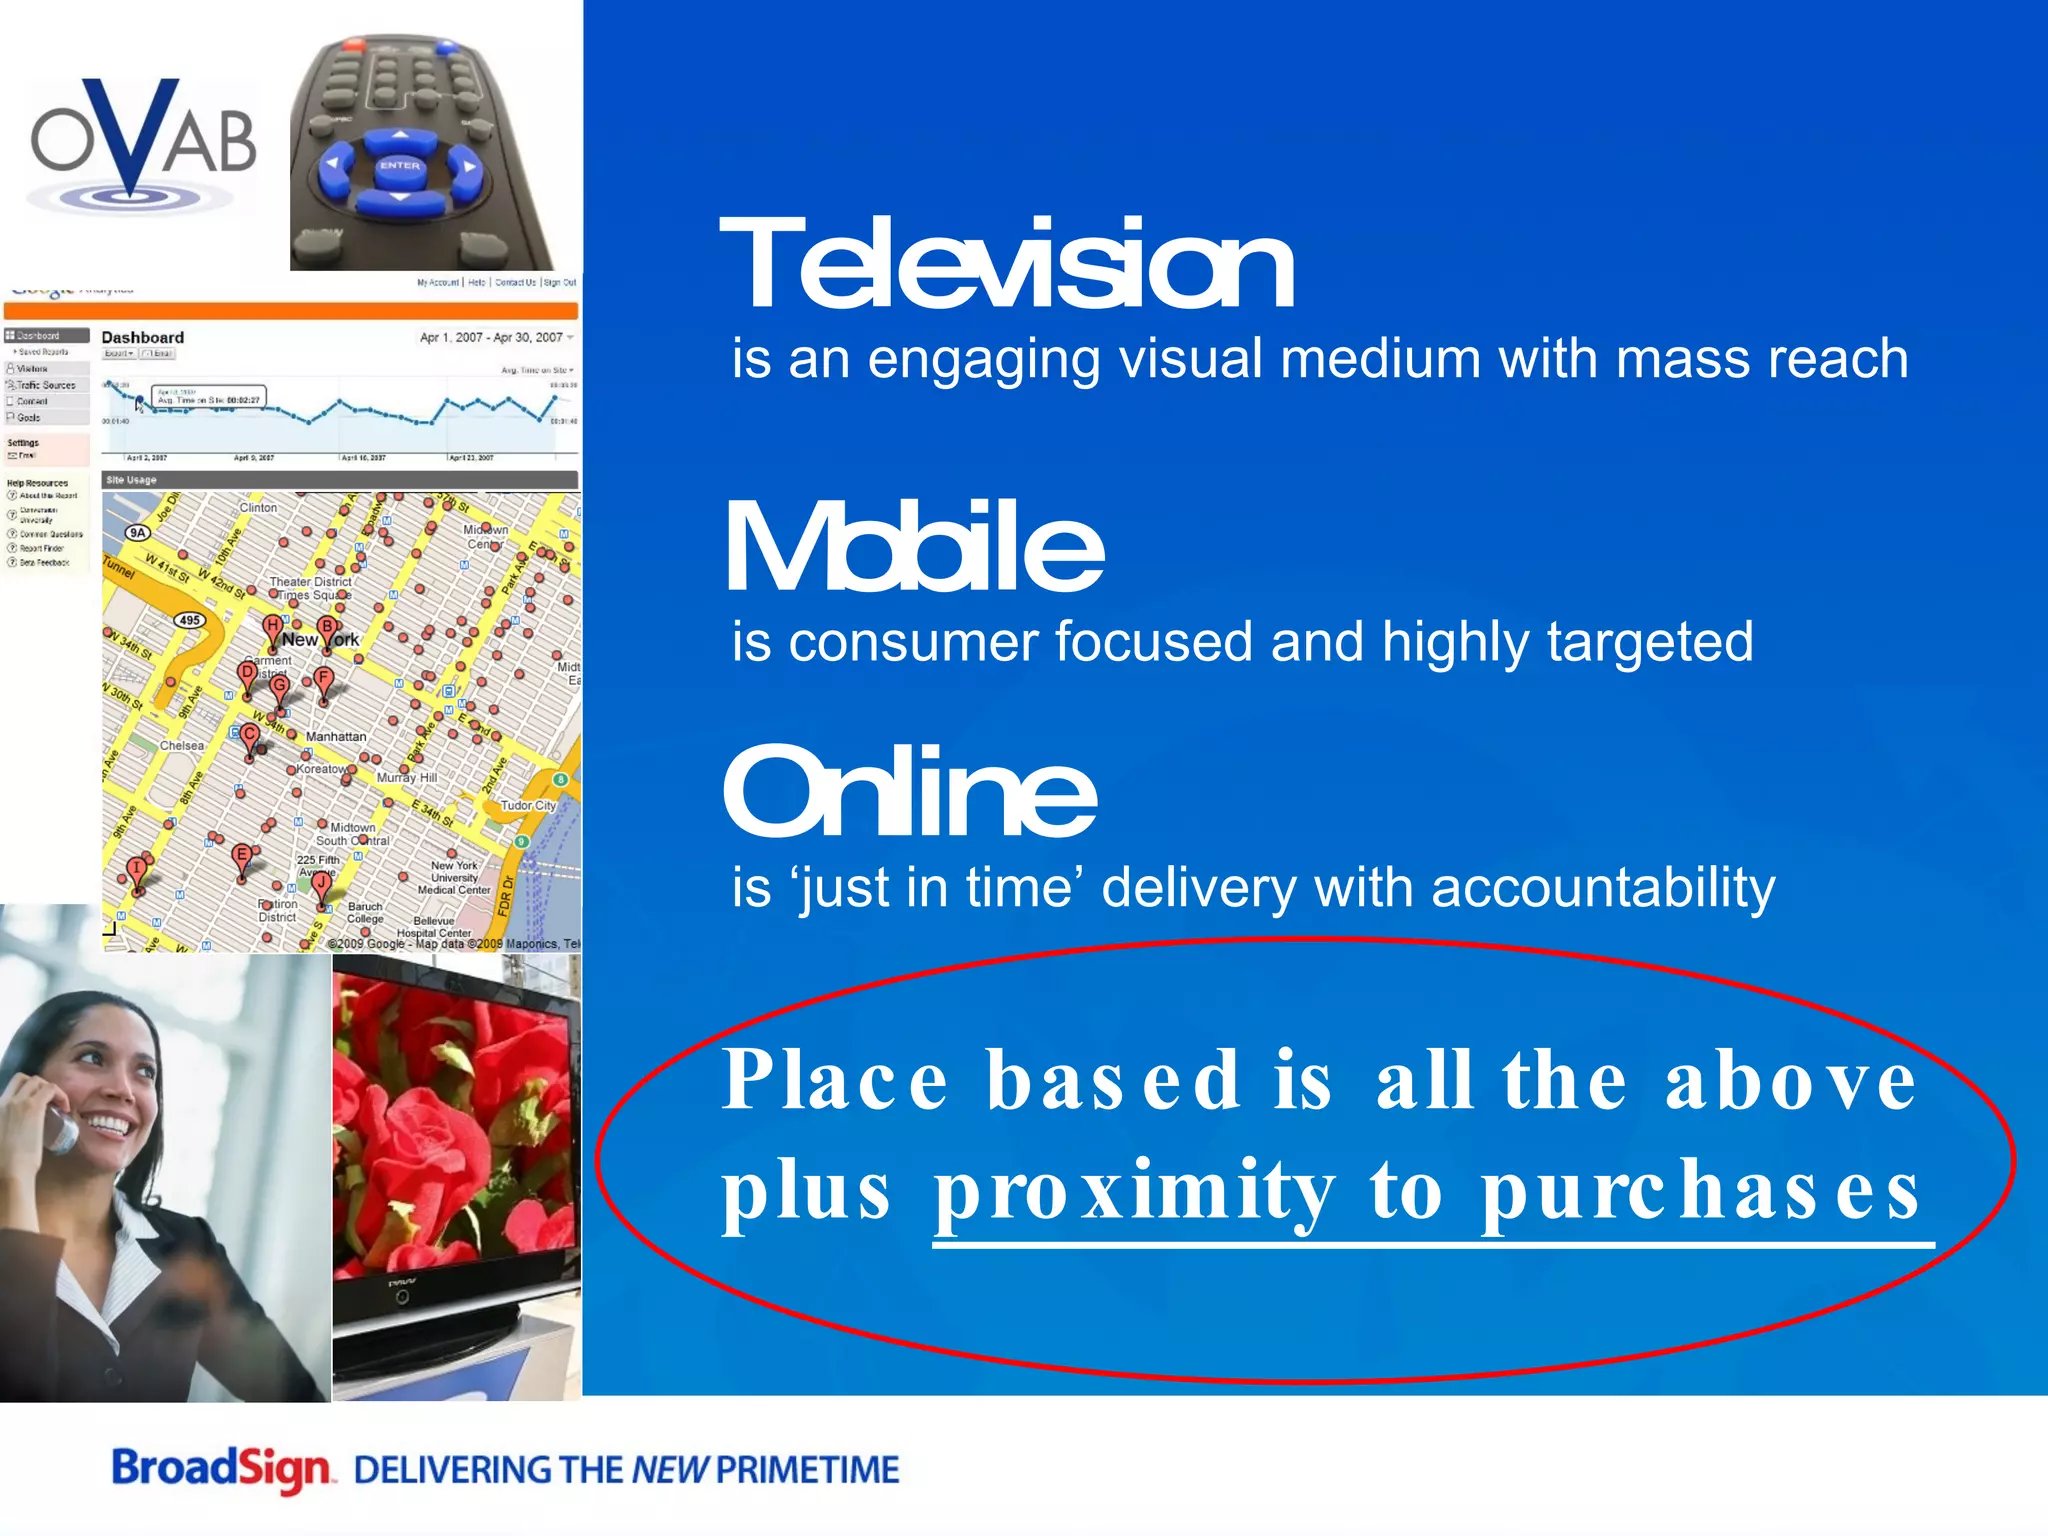
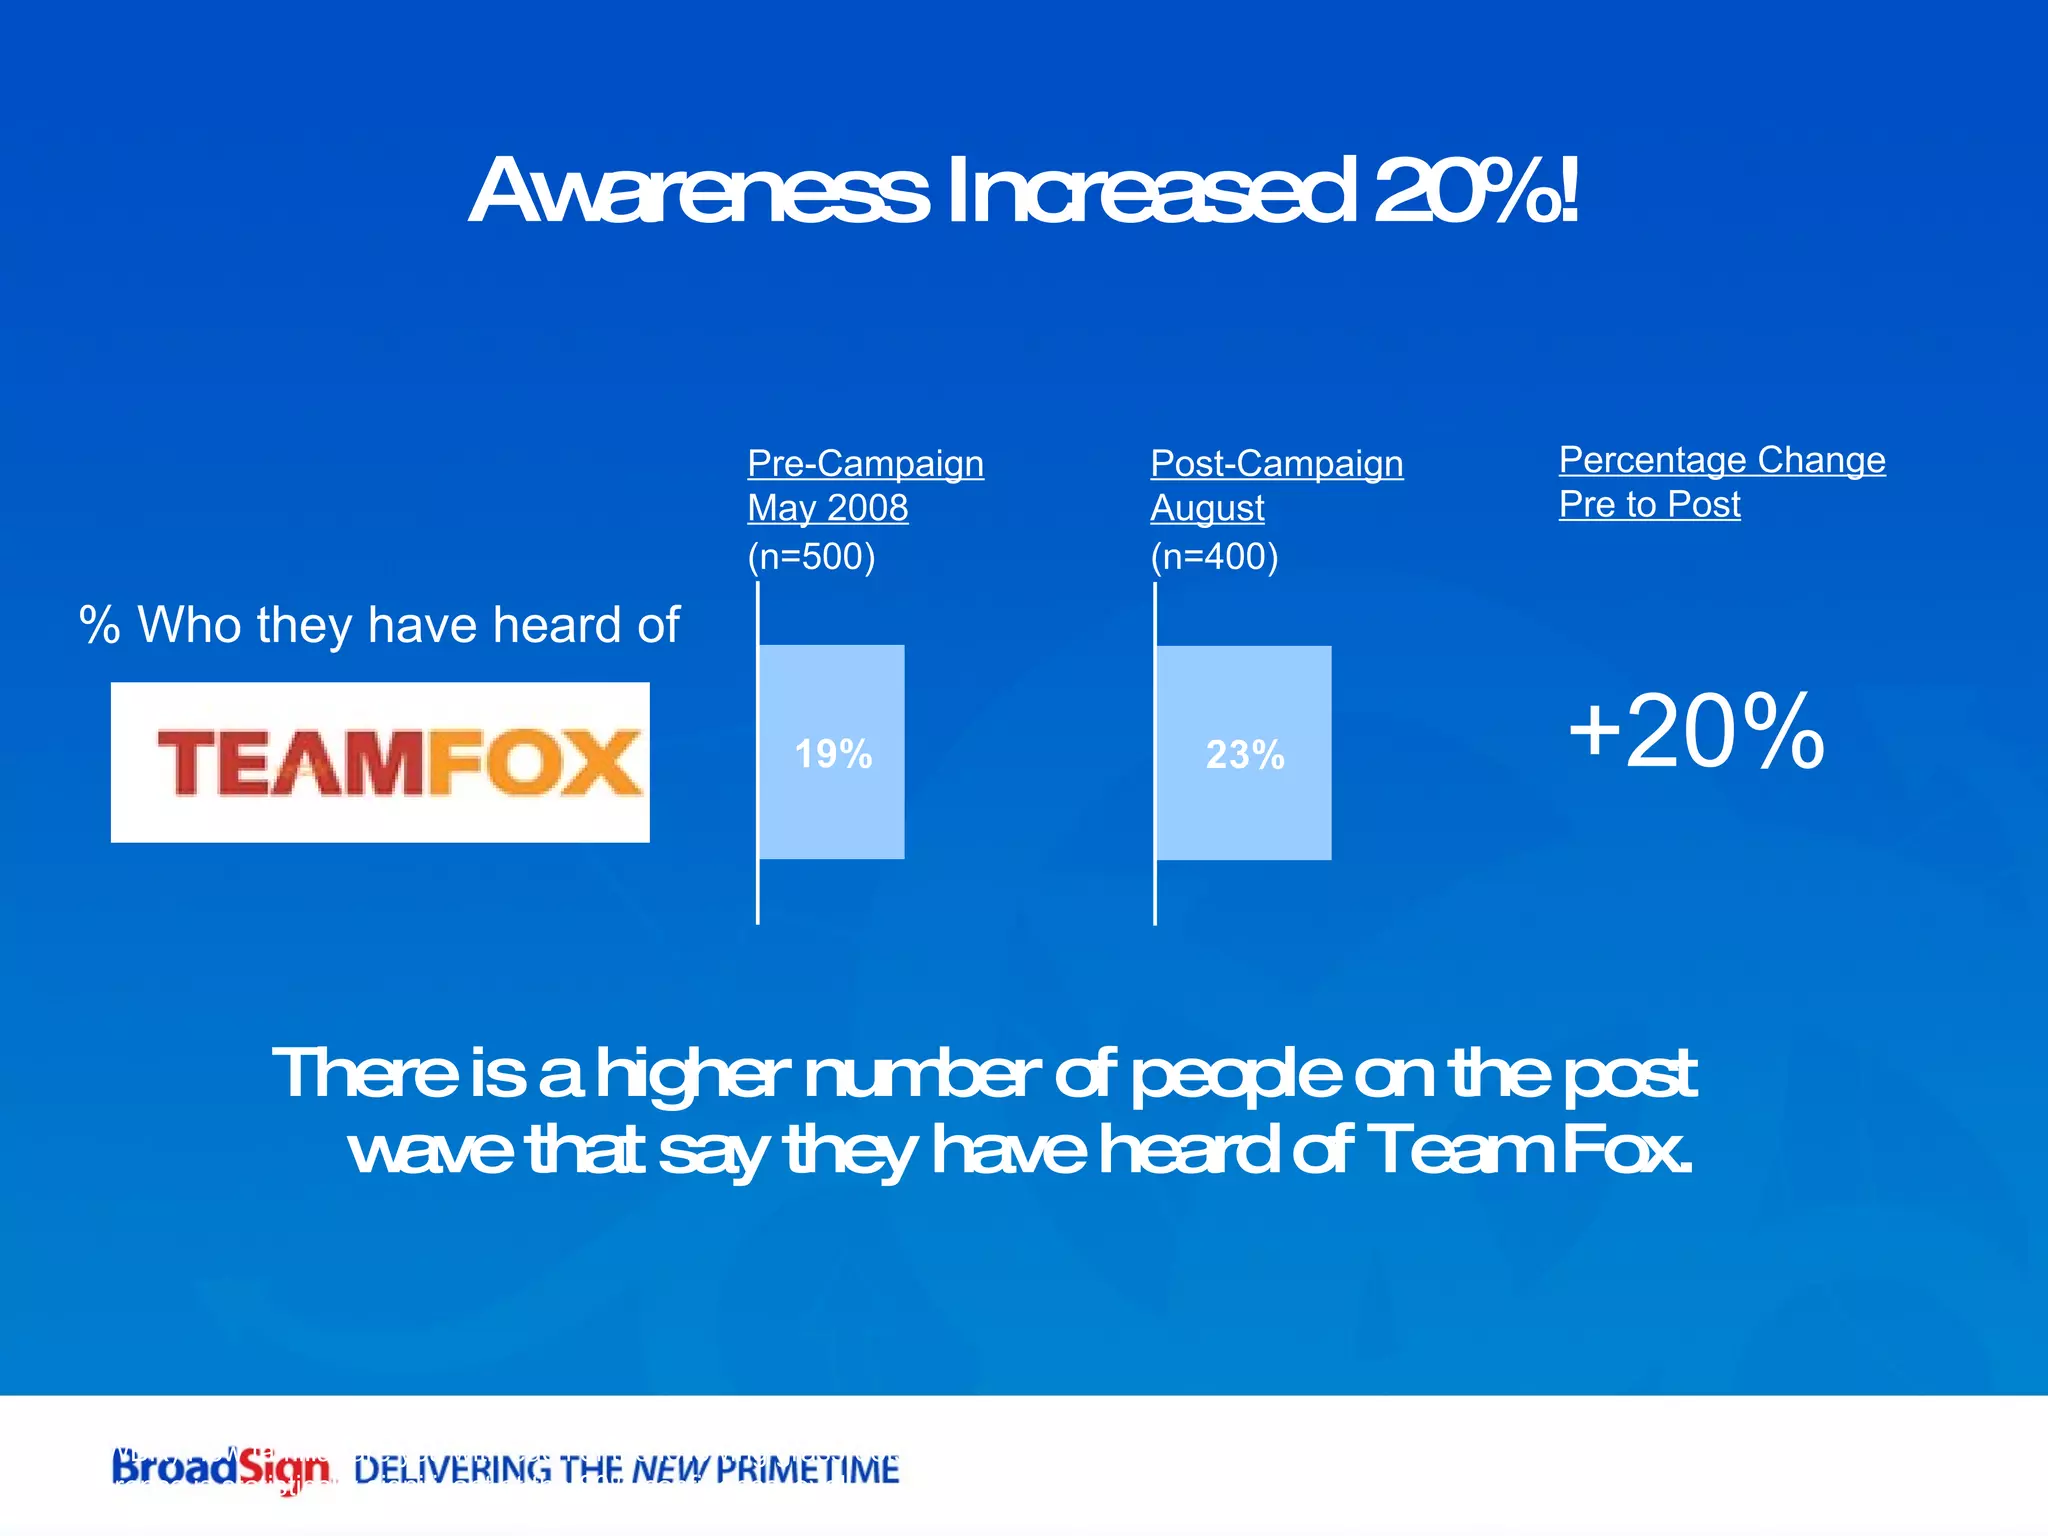
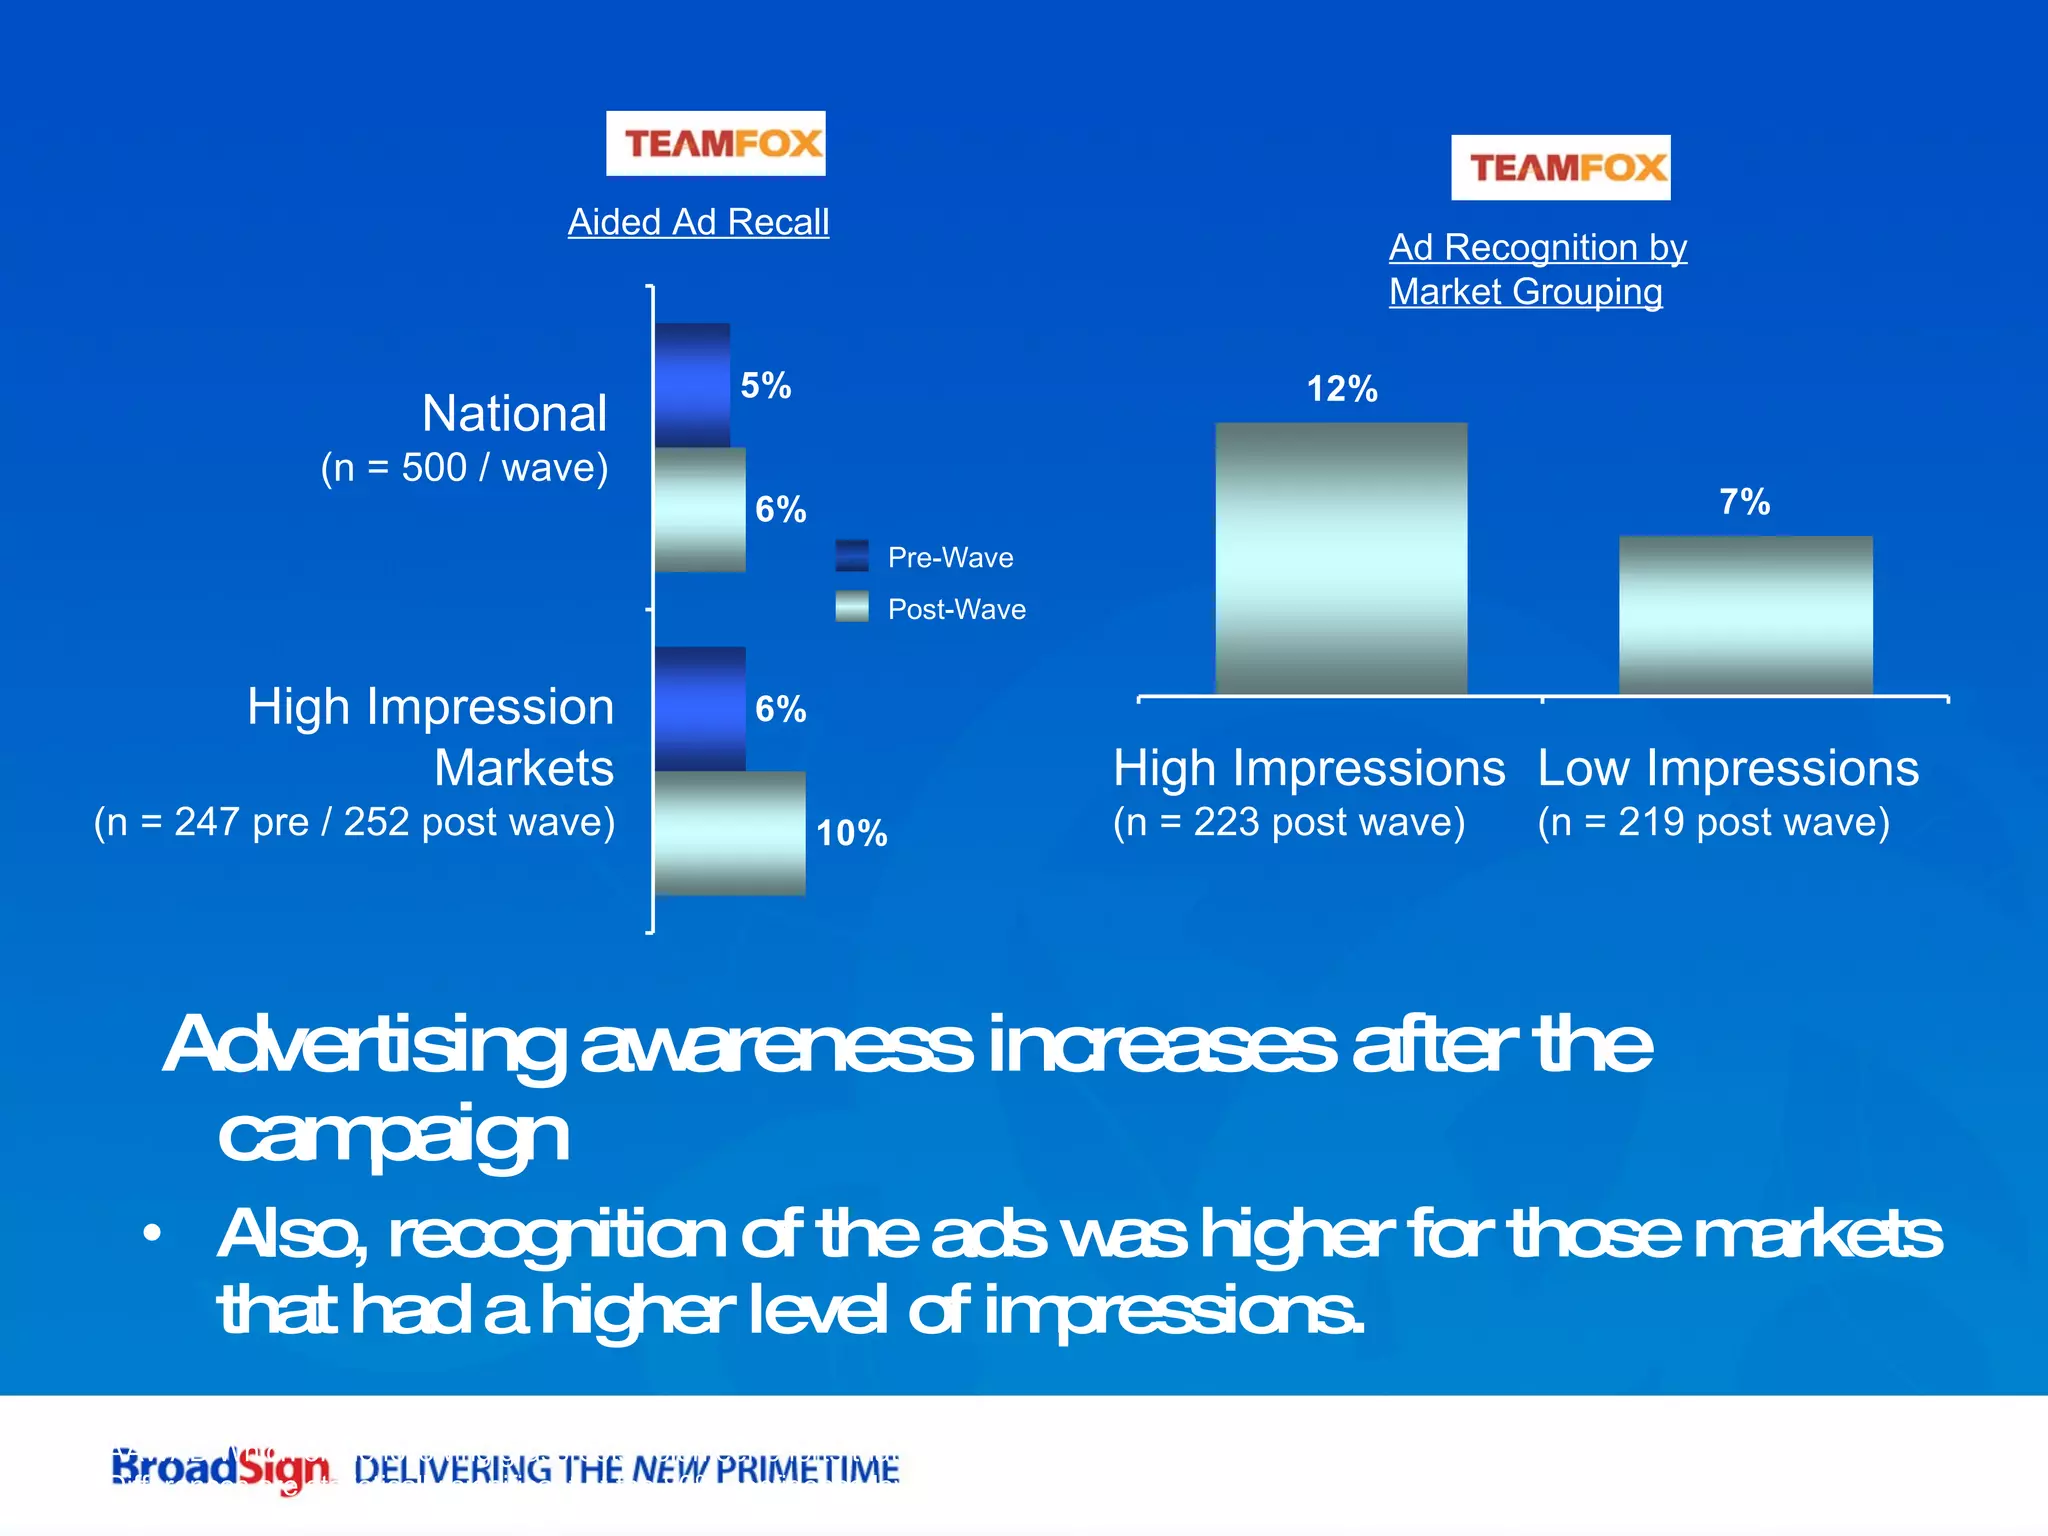
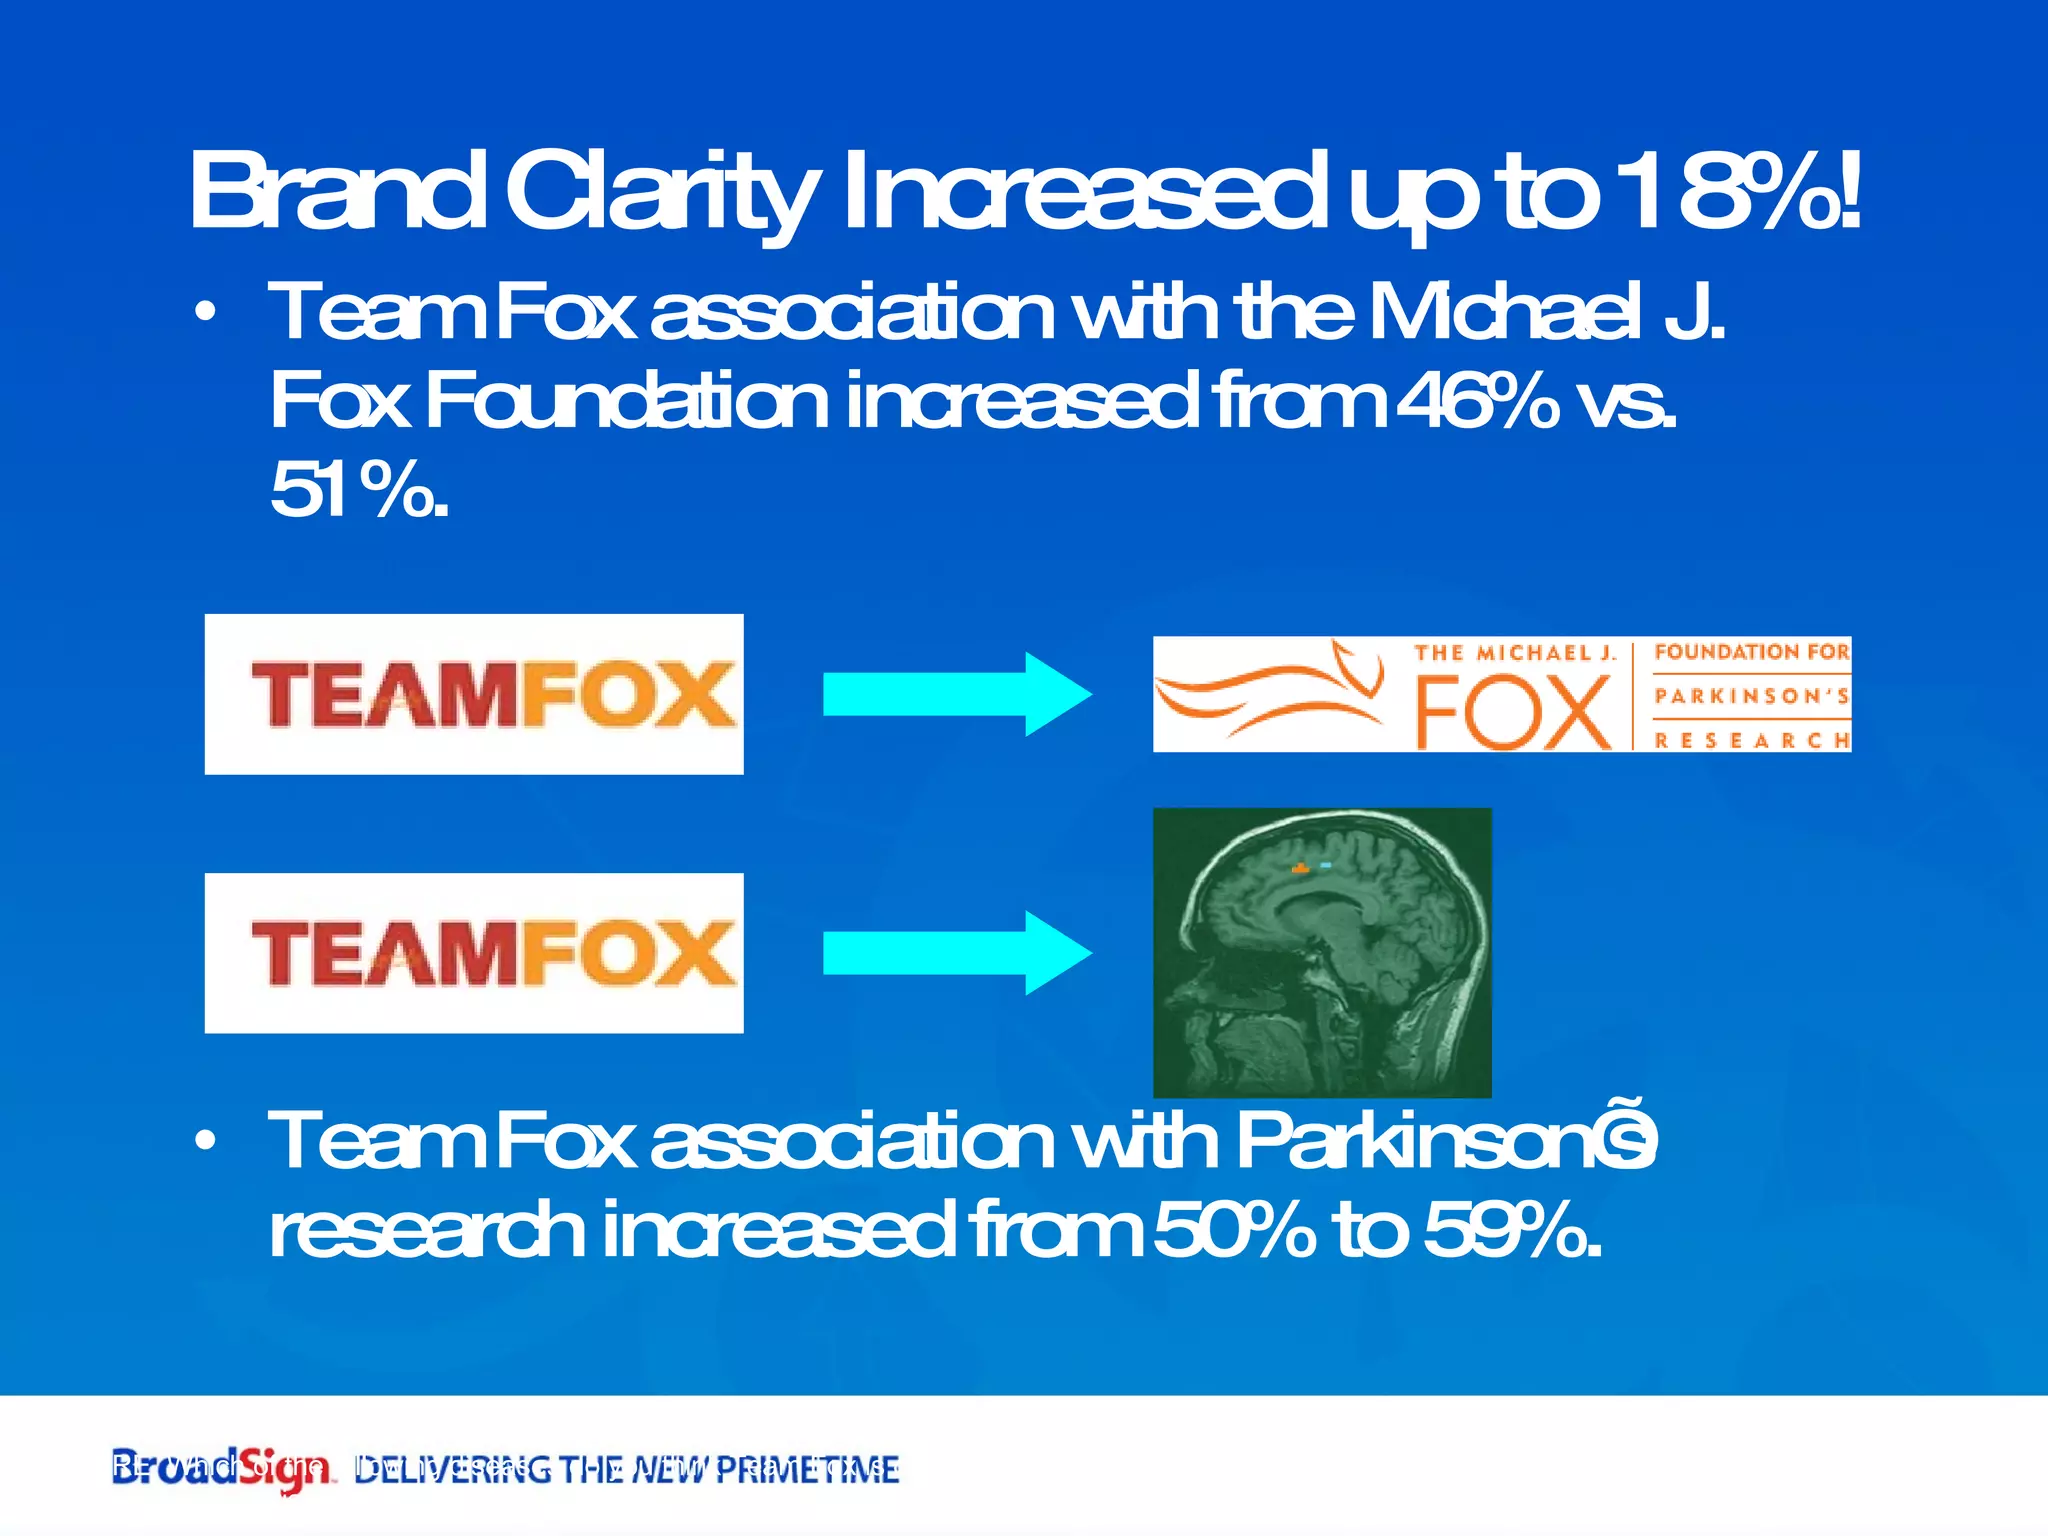
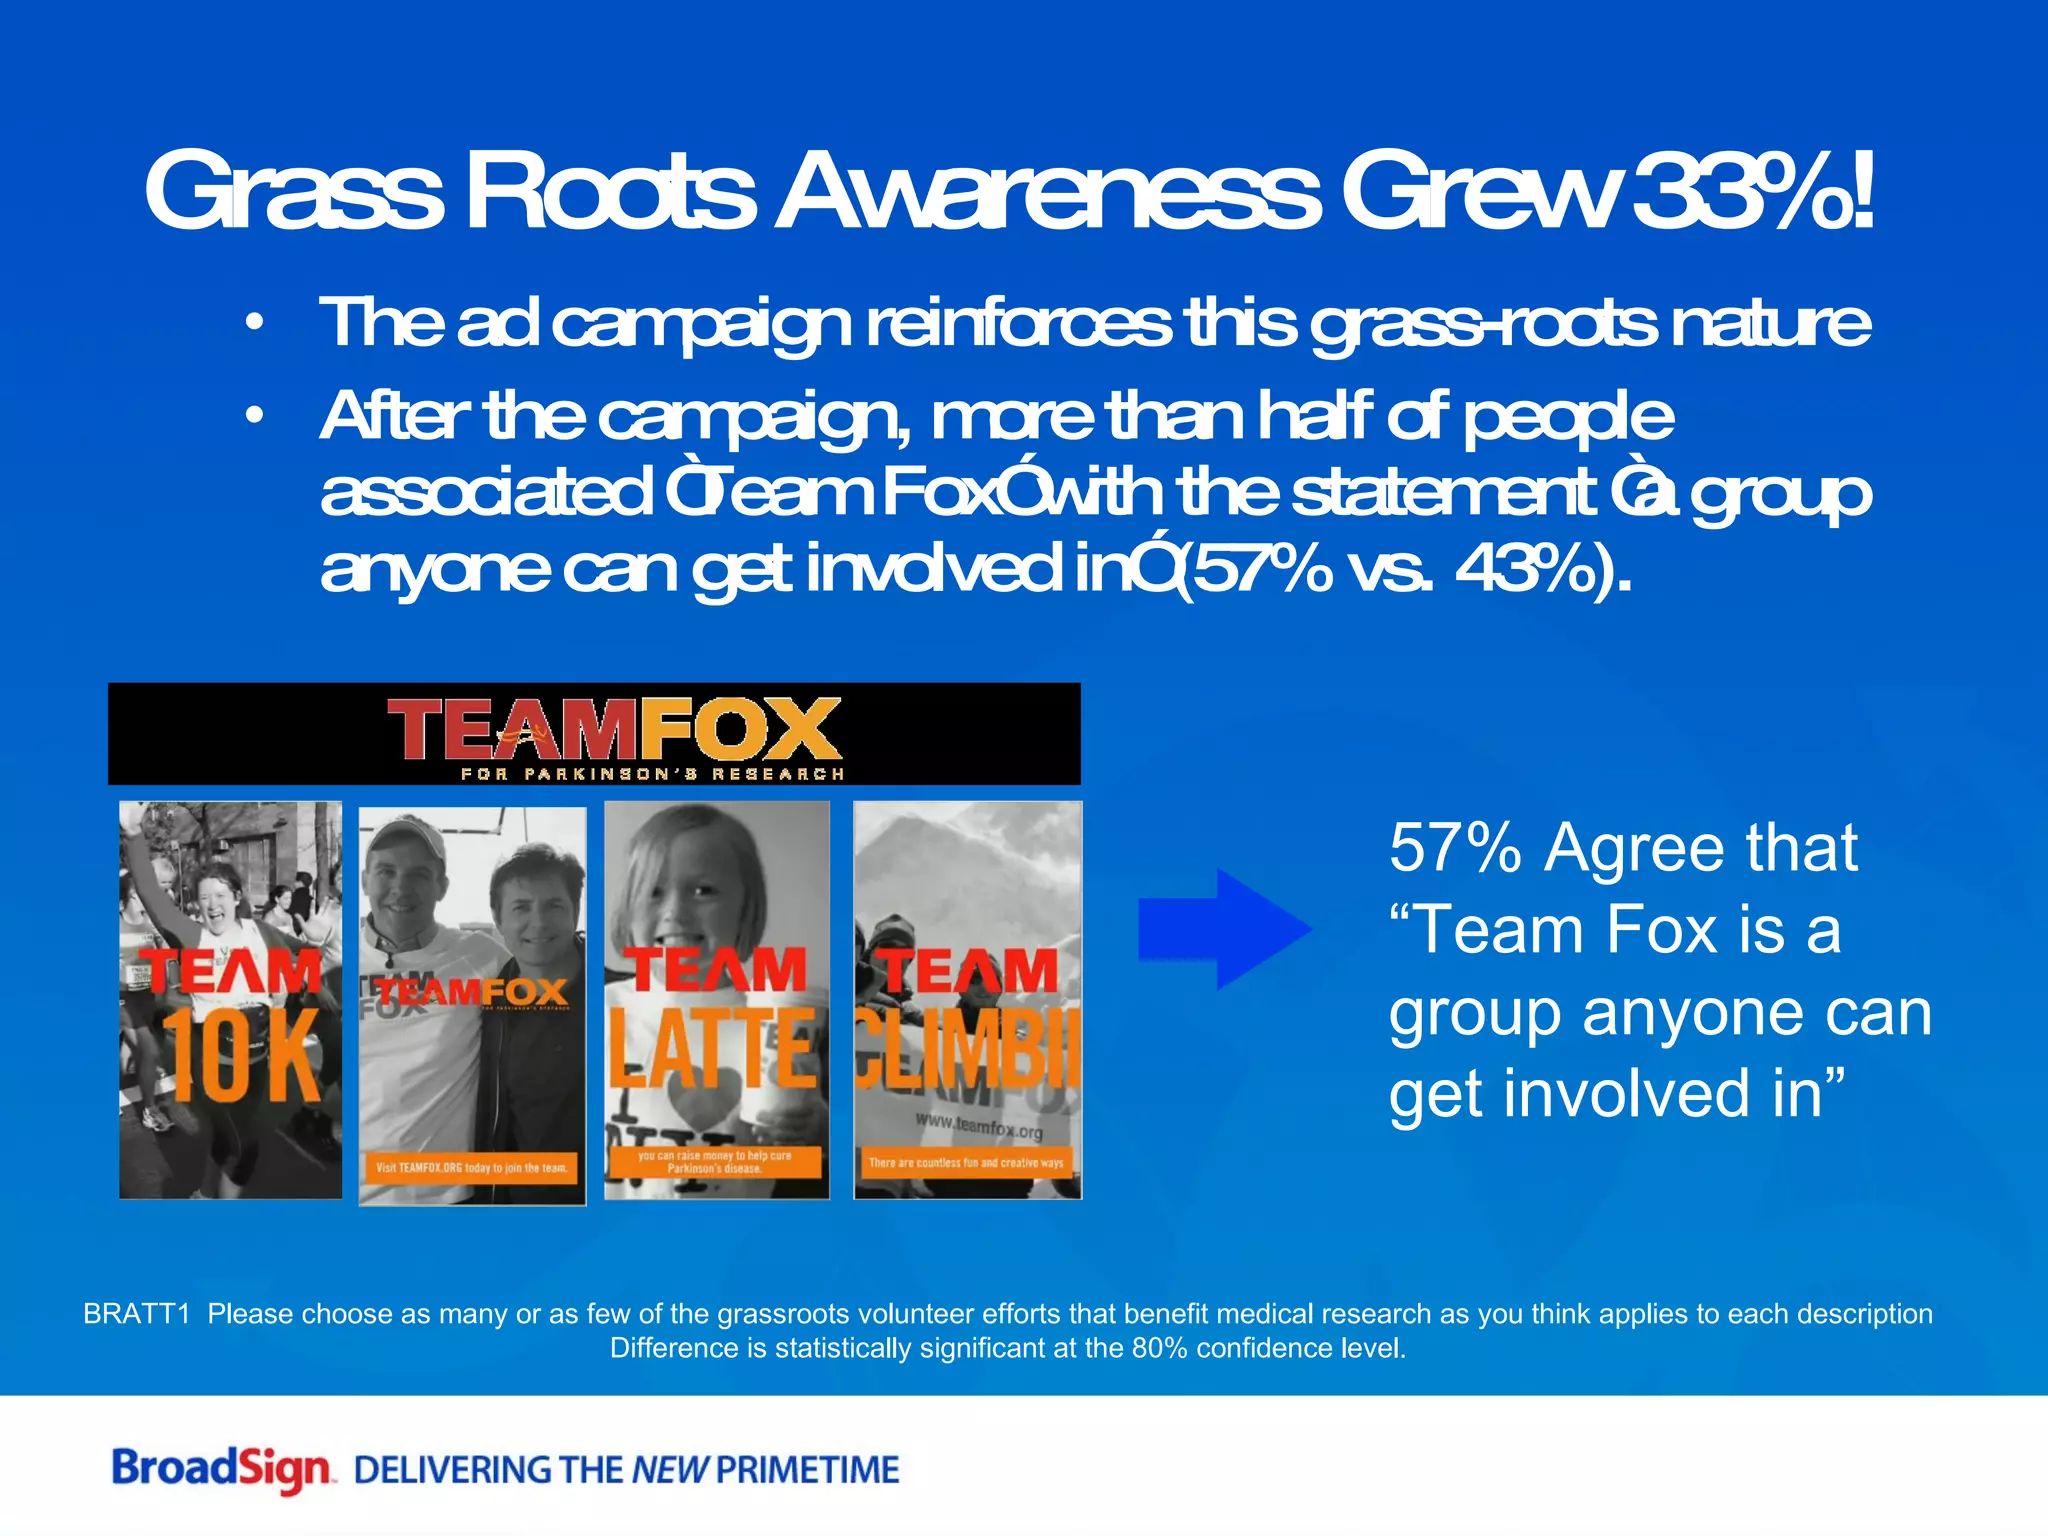
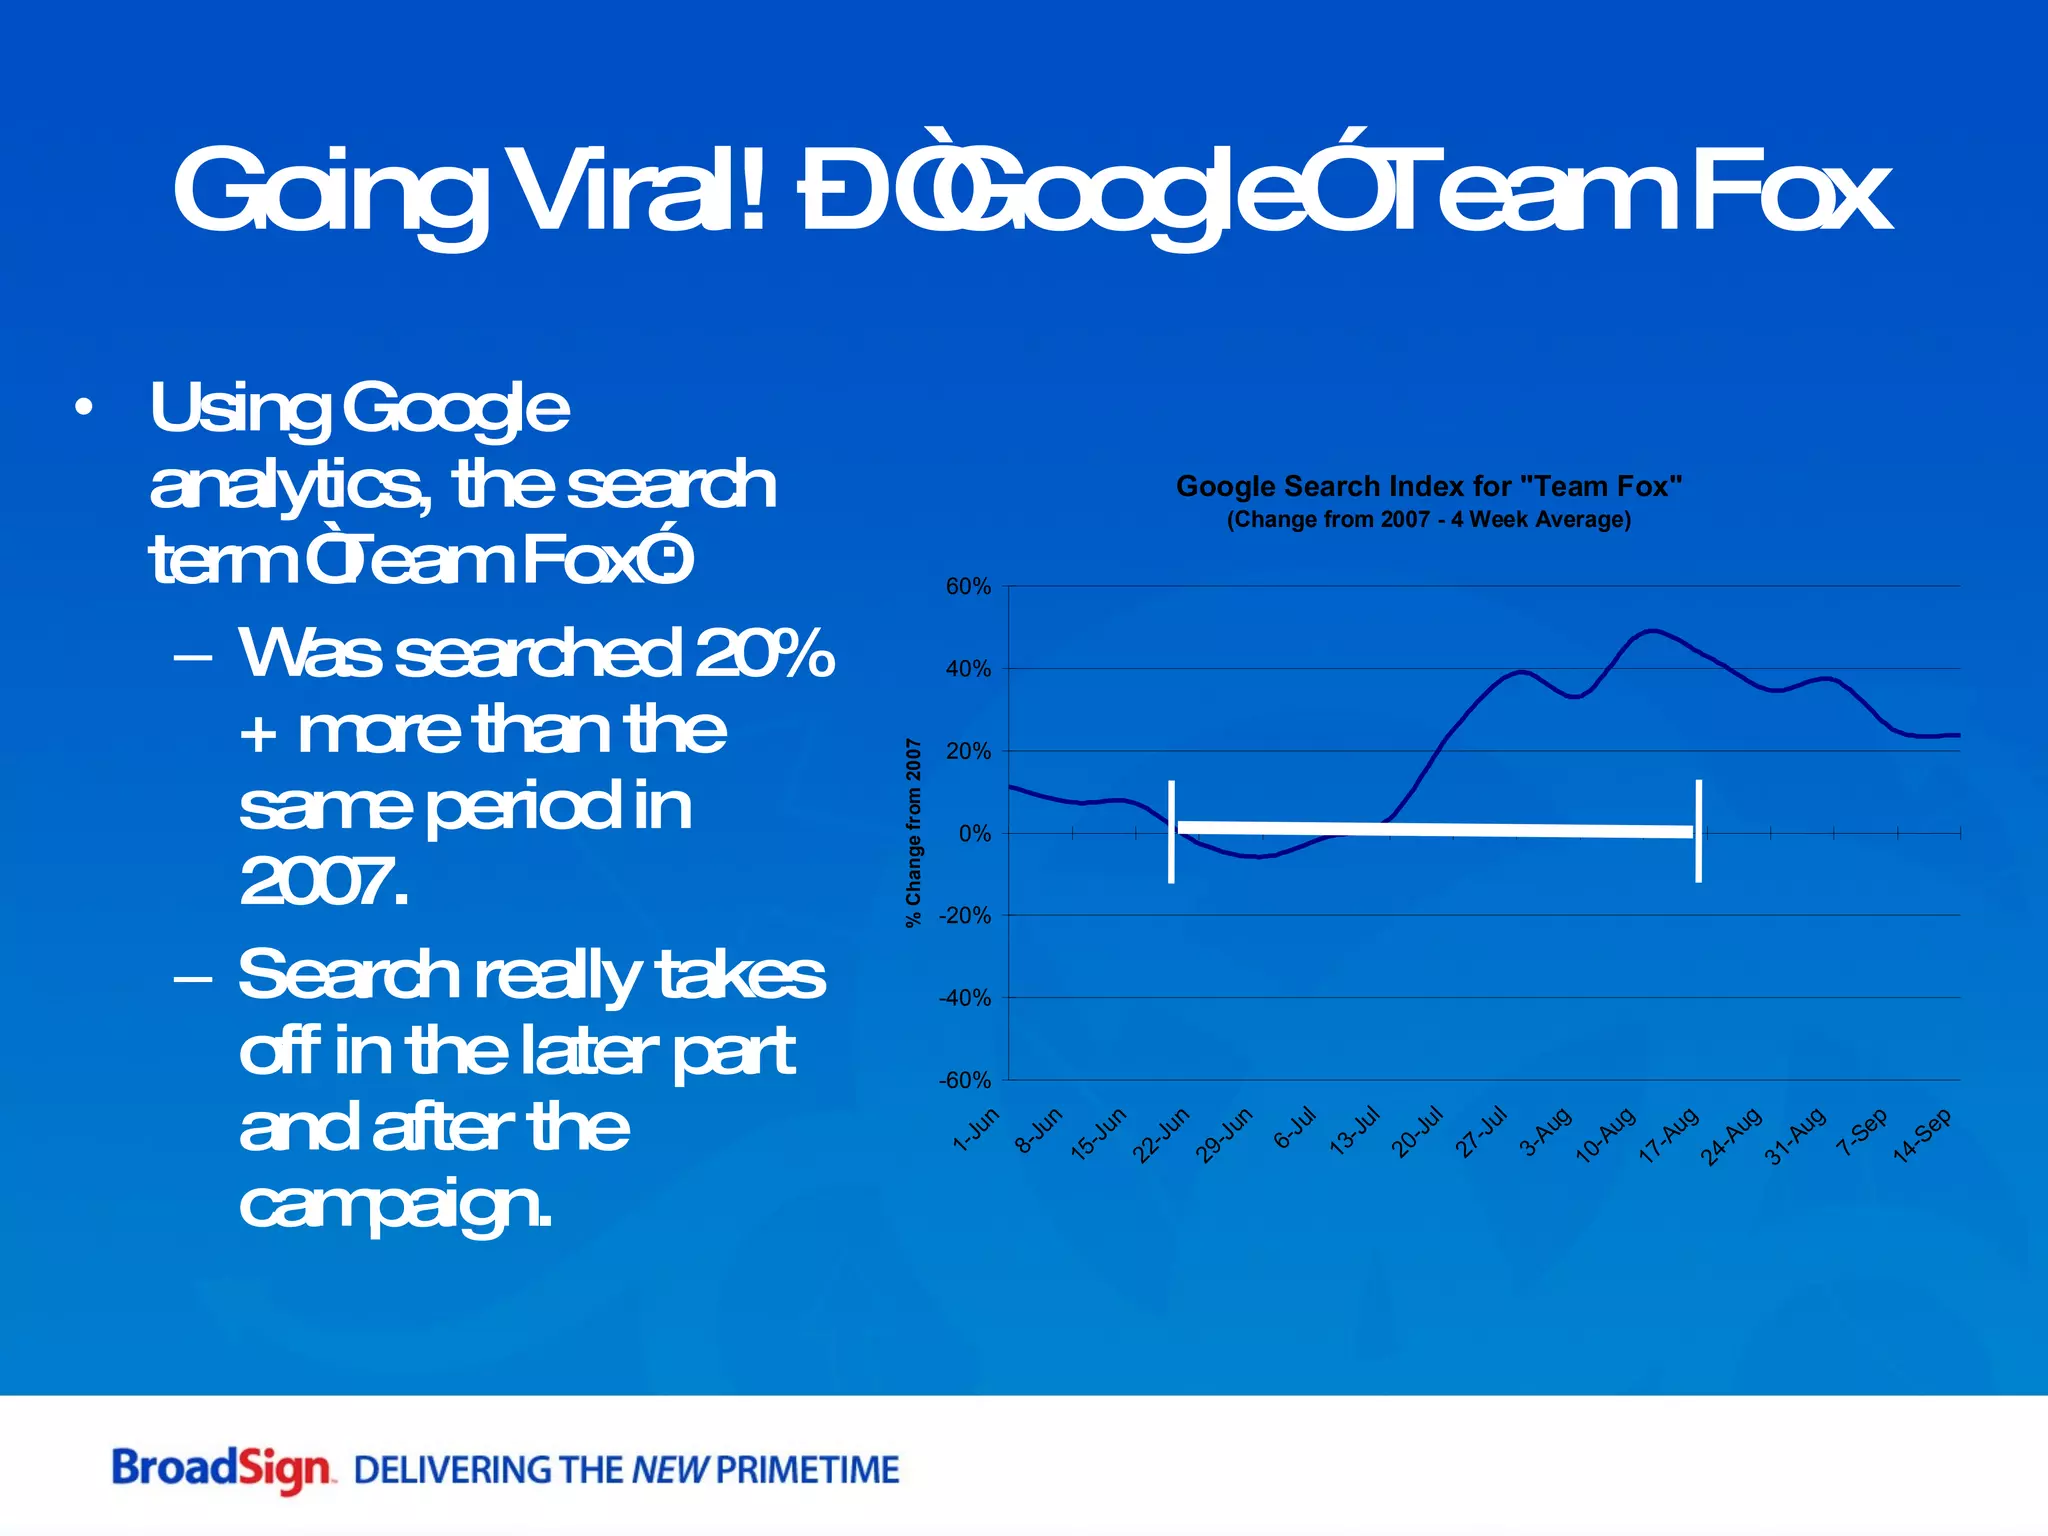
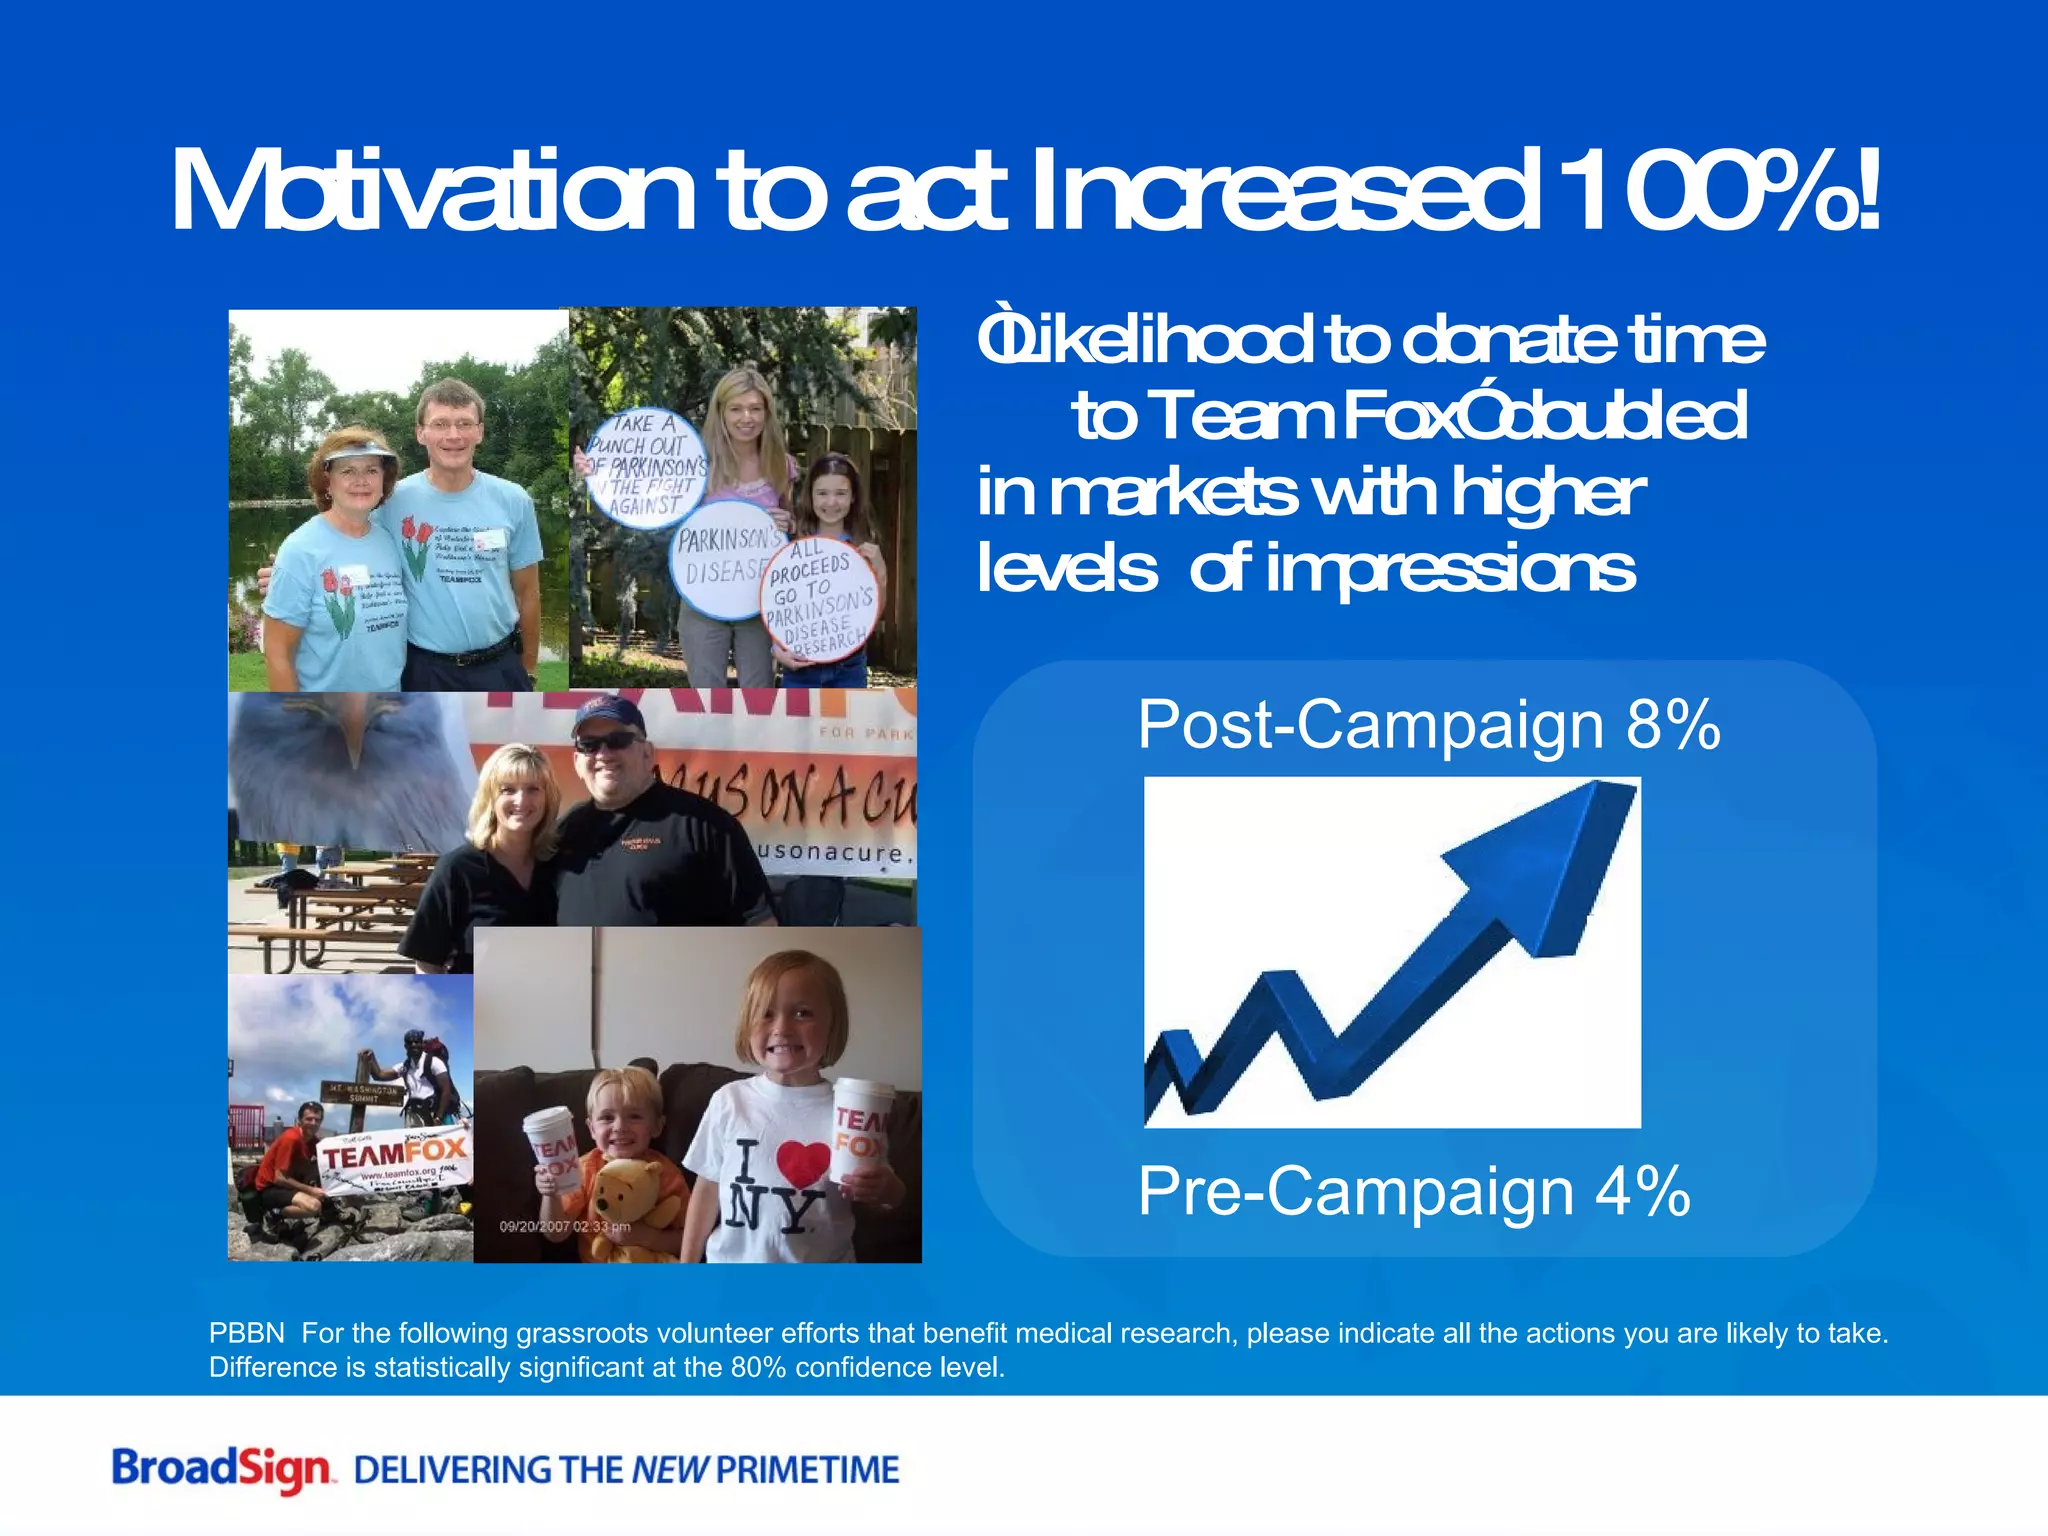
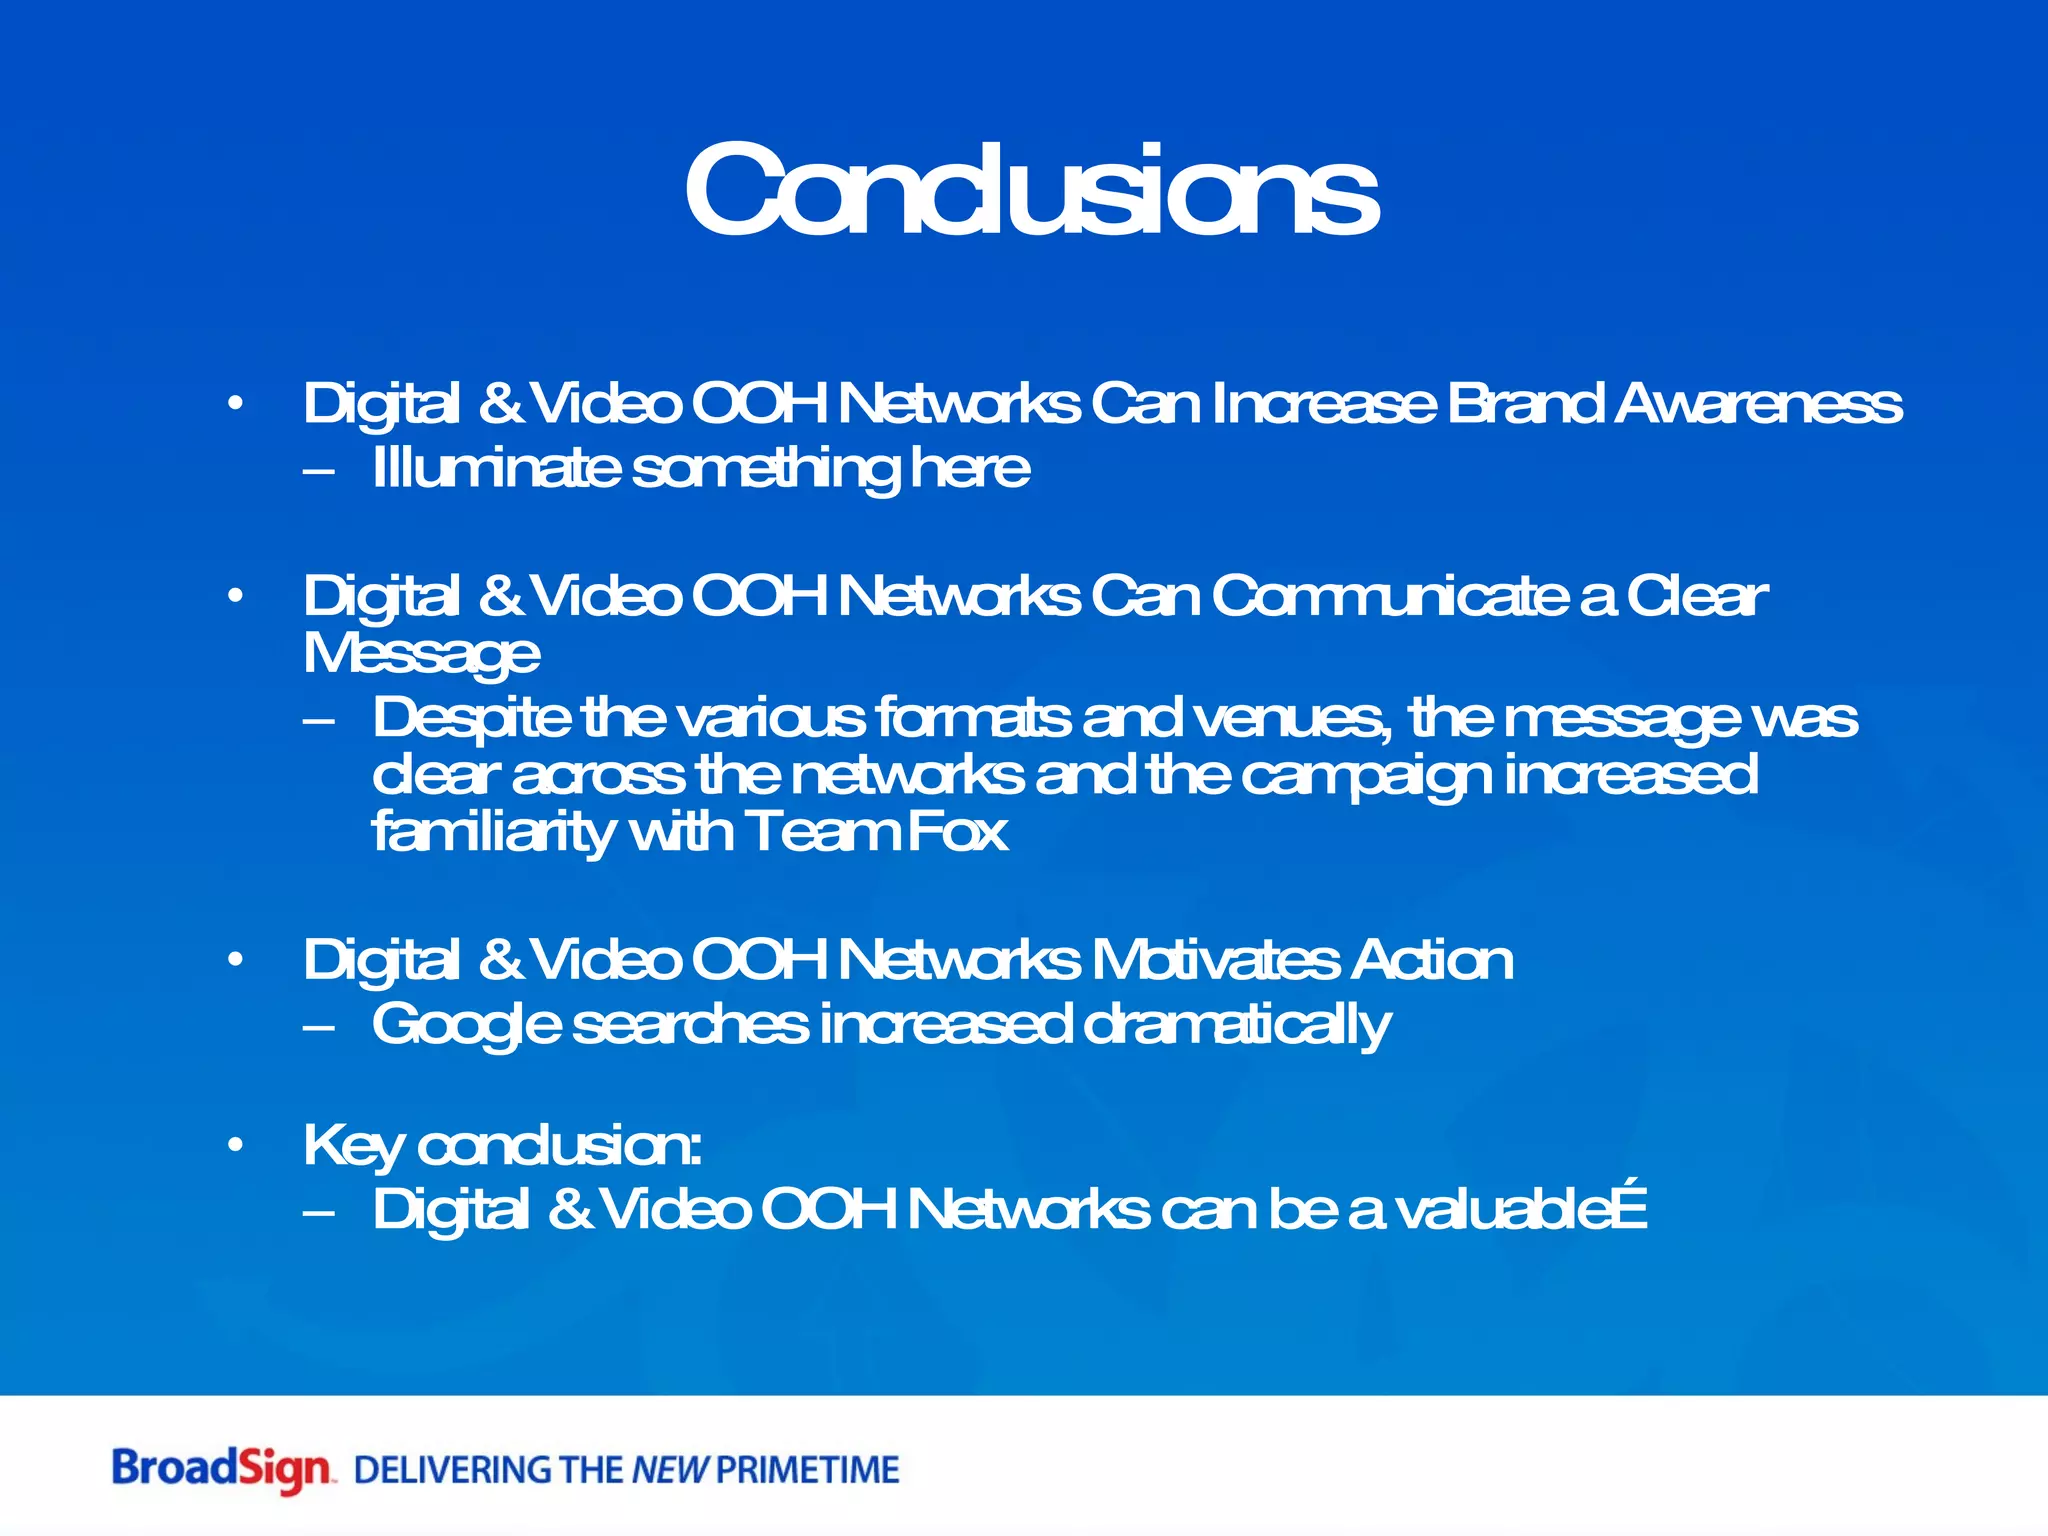
The document outlines the digital out-of-home (DOOH) industry's growth and statistics, highlighting its expansive reach across various connected networks and venues. It discusses the evolution of consumer interaction with media from 1990-2010, emphasizing the increasing importance of mobile and place-based advertising. Additionally, the effectiveness of a specific ad campaign for Team Fox is analyzed, showing significant increases in brand awareness and consumer engagement post-campaign.


