This document discusses integrating attack graphs with intrusion detection systems to help identify complex multi-stage attacks. It proposes an architecture where an intrusion detection system detects alerts and stores them in a database. A vulnerability scanner identifies vulnerabilities, and an attack graph generator uses the alerts and vulnerabilities to generate and update an attack graph. A tool then analyzes the alerts and attack graph to highlight detected intrusions on the graph. The goal is to help administrators better understand the progression of attacks by visualizing how alerts may be related across different stages of an attack. As a proof of concept, the paper implements this using SNORT for intrusion detection, NESSUS for vulnerability scanning, and MULVAL for attack graph generation.
![Ahmad Fadlallah, Hassan Sbeity, Mohammad Malli & Patrick Lteif
International Journal of Computer Networks (IJCN), Volume (8) : Issue (1) : 2016 1
Application of Attack Graphs in Intrusion Detection Systems:
An Implementation
Ahmad Fadlallah afadlallah@aou.edu.lb
Faculty of Computer Studies
Arab Open University
Beirut, Lebanon
Hassan Sbeity hsbeity@aou.edu.lb
Faculty of Computer Studies
Arab Open University
Beirut, Lebanon
Mohammad Malli mmalli@aou.edu.lb
Faculty of Computer Studies
Arab Open University
Beirut, Lebanon
Patrick Lteif plteif@sodetel.net.lb
Sodetel,
Beirut, Lebanon
Abstract
Internet attacks are continuously increasing in the last years, in terms of scale and complexity,
challenging the existing defense solutions with new complications and making them almost
ineffective against multi-stage attacks, in particular the intrusion detection systems which fail to
identify such complex attacks. Attack graph is a modeling technique used to visualize the different
steps an attacker might select to achieve his end game, based on existing vulnerabilities and
weaknesses in the system. This paper studies the application of attack graphs in intrusion
detection and prevention systems (IDS/IPS) in order to better identify complex attacks based on
predefined models, configurations, and alerts. As a “proof of concept”, a tool is developed which
interfaces with the well-known SNORT [1] intrusion detection system and matches the alerts with
an attack graph generated using the NESSUS [2] vulnerability scanner (maintained up-to-date
using the National Vulnerability Database (NVD) [3]) and the MULVAL [4] attack graph generation
library. The tool allows to keep track with the attacker activities along the different stages of the
attack graph.
Keywords: Attack Graphs, IDS, Vulnerability Analysis, Network Security.
1. INTRODUCTION
Internet attacks, are becoming more frequent, larger in scale and causing more damages. More
importantly, more complex attacks have emerged and have been ever-increasingly growing and
capturing the interest of the attackers, threatening the privacy and the availability of the Internet
services. Recent studies and analysis of internet security [5] [6] concluded that the internet
attacks are becoming bigger, faster and more complex. A study [5] conducted by Arbor Networks,
highlights the progress and behavior of the attacks observed during 2015. The study concludes
that the evolution of internet attacks is as follows:
• Bigger Attacks: Attacks are consuming more bandwidth, mostly aiming to saturate network
resources resulting in a denial of service (DoS) of the targeted host. These type of attacks
can be mitigated either by upgrading the capacity of the resource and the paths/bottlenecks](https://image.slidesharecdn.com/ijcn-318-160606195300/85/Application-of-Attack-Graphs-in-Intrusion-Detection-Systems-An-Implementation-1-320.jpg)
![Ahmad Fadlallah, Hassan Sbeity, Mohammad Malli & Patrick Lteif
International Journal of Computer Networks (IJCN), Volume (8) : Issue (1) : 2016 1
Application of Attack Graphs in Intrusion Detection Systems:
An Implementation
Ahmad Fadlallah afadlallah@aou.edu.lb
Faculty of Computer Studies
Arab Open University
Beirut, Lebanon
Hassan Sbeity hsbeity@aou.edu.lb
Faculty of Computer Studies
Arab Open University
Beirut, Lebanon
Mohammad Malli mmalli@aou.edu.lb
Faculty of Computer Studies
Arab Open University
Beirut, Lebanon
Patrick Lteif plteif@sodetel.net.lb
Sodetel,
Beirut, Lebanon
Abstract
Internet attacks are continuously increasing in the last years, in terms of scale and complexity,
challenging the existing defense solutions with new complications and making them almost
ineffective against multi-stage attacks, in particular the intrusion detection systems which fail to
identify such complex attacks. Attack graph is a modeling technique used to visualize the different
steps an attacker might select to achieve his end game, based on existing vulnerabilities and
weaknesses in the system. This paper studies the application of attack graphs in intrusion
detection and prevention systems (IDS/IPS) in order to better identify complex attacks based on
predefined models, configurations, and alerts. As a “proof of concept”, a tool is developed which
interfaces with the well-known SNORT [1] intrusion detection system and matches the alerts with
an attack graph generated using the NESSUS [2] vulnerability scanner (maintained up-to-date
using the National Vulnerability Database (NVD) [3]) and the MULVAL [4] attack graph generation
library. The tool allows to keep track with the attacker activities along the different stages of the
attack graph.
Keywords: Attack Graphs, IDS, Vulnerability Analysis, Network Security.
1. INTRODUCTION
Internet attacks, are becoming more frequent, larger in scale and causing more damages. More
importantly, more complex attacks have emerged and have been ever-increasingly growing and
capturing the interest of the attackers, threatening the privacy and the availability of the Internet
services. Recent studies and analysis of internet security [5] [6] concluded that the internet
attacks are becoming bigger, faster and more complex. A study [5] conducted by Arbor Networks,
highlights the progress and behavior of the attacks observed during 2015. The study concludes
that the evolution of internet attacks is as follows:
• Bigger Attacks: Attacks are consuming more bandwidth, mostly aiming to saturate network
resources resulting in a denial of service (DoS) of the targeted host. These type of attacks
can be mitigated either by upgrading the capacity of the resource and the paths/bottlenecks](https://image.slidesharecdn.com/ijcn-318-160606195300/75/Application-of-Attack-Graphs-in-Intrusion-Detection-Systems-An-Implementation-1-2048.jpg)

![Ahmad Fadlallah, Hassan Sbeity, Mohammad Malli & Patrick Lteif
International Journal of Computer Networks (IJCN), Volume (8) : Issue (1) : 2016 3
Intrusion detection systems offers an overwhelming and complex experience whenever they are
monitoring a number of hosts that exceeds the single digit. The administrators are subject to large
amount of alerts that cannot be easily combined to figure out the attackers next move. If all the
vulnerabilities are pre-mapped, one can try to predict the attackers moves based on the
comprised states.
What this paper is trying to achieve is to benefit from the real-time aspect of the IDS and the
simplified threat visualization of attack graphs, to help countering complex attacks in a much
more efficient way. There are a lot of IDS solutions, and a couple of attack graph generators, but
surprisingly there are no published integration and solution between the two tools, yet some
researchers have written about the subject. This research contribution is to prove that the concept
is innovative, interesting enough and helpful as a dynamic simplified threat-monitoring tool for
system administrators administering large amount of nodes.
The rest of this paper is organized as follows: section 2 introduces the attack graphs. Section 3
describes how we propose to integrate the attack graph with SNORT intrusion detection system.
Section 4 presents and discusses the implementation results. Finally, section 5 concludes the
paper and presents the future work.
2. ATTACK GRAPHS
An attack graph is a “succinct representation of all paths through a system that end in a state
where an intruder has successfully achieved his goal” [7]. These graphs have, in general, starting
state(s) representing an attacker at a given network location, and goal states. They are used to
determine if the goal states can be reached by attackers trying to penetrate/attack the
network/system to be protected.
2.1. Attack Graph Presentation
The attack graphs (as any other graph) consist of nodes and arcs. However, no single unified
consented graphical representation is used by all the researchers; the information held in the
nodes and arcs vary de- pending on the type of the attack graph. Table 1 illustrates the main
attack graph types identified in the literature [8] [9] [10].
It is worth mentioning that each model has its own advantages and disadvantages. Some of
these approaches were developed to generate scalable attack graphs, while other approaches
use the attack graph for other risk analysis such as finding the number of paths and the shortest
paths. [11] [12] [13] showed that attack graphs have excellent capabilities to carry out risk
assessment especially finding out the probabilities of the attacker being successful. At the
moment, there is no standard model to generate attack graphs and this will remain a challenge
for future works to come up with new representation models for attack graphs that solve the
shortcomings of the existing solutions.
2.2. Attack Graph Inputs
This Attack graphs require certain inputs in order to generate their graphical representation.
There are four different types of essential inputs [14] [15]:
• Advisories: the list of vulnerabilities that have been reported on the machines. This list
should contain extensive information such as the services and programs, their versions,
the plugins installed, and all the technical information such as the network services that
the program is using, the ports it is listening to, etc.
• Configuration: of the machine(s), both from a networking point of view (ACLs, ports
opened, etc.) and from a system point of view (services, privileges, etc.). In addition, the
configuration should include all technical information of the operating system, the
hardware capabilities and specifications.
• System model: which is essential for the attack graph in order to be able to predict
relations between a set of vulnerabilities.](https://image.slidesharecdn.com/ijcn-318-160606195300/85/Application-of-Attack-Graphs-in-Intrusion-Detection-Systems-An-Implementation-3-320.jpg)

![Ahmad Fadlallah, Hassan Sbeity, Mohammad Malli & Patrick Lteif
International Journal of Computer Networks (IJCN), Volume (8) : Issue (1) : 2016 5
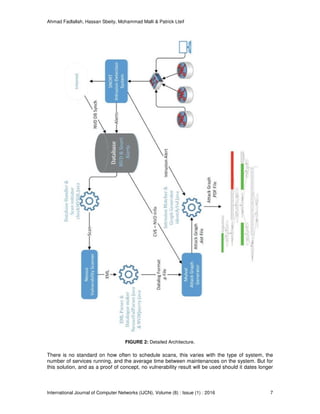
FIGURE 1: General Architecture.
Figure 2 illustrates the architecture with the different interactions between the various modules
which can be summarized as follows:
1. An intrusion is detected by the IDS, and the corresponding alert is stored in a Database.
2. The script checkMYSQL.java
1
is responsible for checking for new intrusions in the
databases, checking for signature in the alert, and initiating the Module1.sh shell script to
take over.
3. The Module1.sh script checks if there has been any vulnerability scan performed prior to
the alert detection, and should the vulnerability result be outdated, Module1.sh will initiate
a NESSUS scan.
4. Once the vulnerability result is ready and valid, Module1.sh checks if the result has
previously been transformed to Datalog
2
(will be explained in section 3.5) input and if not,
Module1.sh initiates NessusVulParser.java and NVDQuerry.java to finally get a file called
nessus.P that has Datalog clauses describing all the vulnerabilities and network
configuration of the targeted host.
5. Once the input of the attack graph generator has been prepared nessus.P, Module1.sh
launches the attack graph generator MULVAL with the nessus.P file as argument.
6. MULVAL analyzes the input and constructs the attack graph solely on the vulnerabilities
detected by Nessus, and stores the information in a file called AttackGraph.dot.
7. Module1.sh forwards the AttackGraph.dot and the intrusion detected by SNORT to a
script called identifyVul.java in order to highlight the detected intrusions on the attack
graph.
8. In the last stage, the Module1.sh forwards the amended AttackGraph.dot to Module2.sh
in or- der to draw the attack graph in EPS and PDF format.
The rest of this section explains the choices of the security tools and how the information is
handled so they can interoperate seamlessly.
1
we have kept the .java extension to indicate that the code is written in java, however the executable is
responsible of performing the action.
2
Datalog is subset of the well-known Prolog’s syntax. It is a declarative logic programming language, often
used as a query language for deductive databases, but that founds several applications in data integration,
information extraction, networking, program analysis, security, and cloud computing [16].](https://image.slidesharecdn.com/ijcn-318-160606195300/85/Application-of-Attack-Graphs-in-Intrusion-Detection-Systems-An-Implementation-5-320.jpg)
![Ahmad Fadlallah, Hassan Sbeity, Mohammad Malli & Patrick Lteif
International Journal of Computer Networks (IJCN), Volume (8) : Issue (1) : 2016 6
3.2. Intrusion Detection System - SNORT
We have adopted SNORT [1], the well-known and well documented open source IDS. Following
Snorts deployment and configuration, and very quickly, the disadvantage of the IDS that
motivated this research in the first place was clear. A numerous number of alerts was observed
without having the ability to really analyze and check for any high-risk intrusions, and if those
alerts can be complementing each other in order to identify a higher purpose, and a more
complex attack. Numerous alerts lead to extensive human intervention. Even when using a
Graphical User Interface for SNORT such as Sguil [17], the number of alerts is too much to
handle with no clear way on how to correlate between alerts. Taking into consideration that
networks are in constant state of growing in terms of number of hosts and traffic flow, this trend of
ever increasing number of alerts does not seem to be the adequate answer and a solution must
be proposed to better benefit from the IDSs functionality while still having reasonably limited
reports to examine and monitor.
In order to benefit from the reporting of the IDS in this research, and to be able to analyze the
alerts, there are two options: One way was to parse the text files of the logged data, which is a
complex process especially that the files are always being amended and updated. Another much
more effective way was to export all the alerts data into a MySQL database. This have been
achieved easily by downloading a special plugin for SNORT that does the required job [18].
Once the alerts were being stored in the database, checkMYSQL.java has the responsibility to
check for new entries in the tables. Should an intrusion be recorded, it is responsible to initiate
the appropriate actions?
3.3. Vulnerability Scanning - NESSUS
An essential part of this solution is the vulnerability scanning. The results of this scan are a
necessary input in order to identify all possible intrusions on the systems which in turn will be
used to construct the attack graph itself. The scan’ results in general contain a lot of information
of the scanned host(s) including network configuration, running service, in- stalled programs and
plugins. The scan software has a predefined set of tests customized for the system being
scanned based on the operating system, and the programs installed and their versions.
In a second part, the vulnerabilities should be checked in order to identify any possible correlation
that might give the attacker incentives, and appropriate privileges in order to perform complex
attacks. That part will be further explained in section 3.4.
Recurrent scan is required because system administrators are always faced with new
vulnerabilities. These vulnerabilities come from newly installed pro- grams, from configuration
changes, or from recent discovery of exploits in certain program or plugin. Administrators are
always trying to update to the latest patches, and close any security holes available, but
sometimes fixes are not available, other times fixes re- quires a certain intervention with outage
on the service provided, which can take some time to schedule appropriately. Therefore, regular
scan should be scheduled every once in a while.](https://image.slidesharecdn.com/ijcn-318-160606195300/85/Application-of-Attack-Graphs-in-Intrusion-Detection-Systems-An-Implementation-6-320.jpg)
![Ahmad Fadlallah, Hassan Sbeity, Mohammad Malli & Patrick Lteif
International Journal of Computer Networks (IJCN), Volume (8) : Issue (1) : 2016 8
than one day. So whenever an attack graph is being formed, the vulnerabilities listed represent a
recent data up to a 24 hours old.
A small script is responsible to check the date of the file result.nessus and compare it to the last
current date. Should there be any difference, a brand new scan will be initiated.
There are a lot of vulnerability scanner solutions in the market. Among these solutions, the focus
was on searching for a program that uses OVAL (Open Vulnerability and Assessment Language)
[19]. The choice of using OVAL will be further explained in the next subsection. We have selected
NESSUS [2], the well-known vulnerability scanner. NESSUS offers many advantages, aside from
having a huge number of vulnerability checks, one of the advantages was having a community
support, with wide diverse reviews and forum threads.
3.4. Oval & NVD Databases
The OVAL (Open Vulnerability and Assessment Language) is a community effort and standard
that pro- motes the ways on how to assess and report machine configuration and vulnerabilities.
It endorses open and publicly available security content and offers them openly through
repositories for programs who utilize the language. These repositories are a collection of the
three main steps of the assessment process: representing configuration information of systems
for testing; analyzing the system for the presence of the specified machine state (vulnerability,
configuration, patch state, etc.), and reporting the results of this assessment.
The OVAL language is supported by MITRE; a non- profit American organization, which in turn is
responsible in support high level agency across the United States such as the Department of
Defense (DoD) and others. Therefore, the OVAL database is constantly updated with the latest
discoveries and security content measurements.
The security industry is an industry where one needs to be always updated with the latest
findings. There- fore discovering and adopting the OVAL language as the basis for the
vulnerability scanner was essential to the solution. This has led to choosing the NESSUS
scanner. It is constantly updated with the latest findings, thus making this solution scalable and
adaptable to the latest security findings. Another advantage of OVAL is highlighting and marking
known vulnerabilities with CVE (Common Vulnerabilities and Exposure) identification [20].
The National Vulnerability Database [3] is one of the most important and interesting approach
used throughout the solution. It is a repository of standards based vulnerability management data
represented using the Security Content Automation Protocol (SCAP) [21]. It includes a variety of
security content resources, most notably CVEs and impact metrics. In few words, the purpose
and the power of using the NVD database was to be able to get clearer description of the CVE-
IDs and their impact in order to be able to correlate different vulnerabilities and finally construct
the attack graph.
3.5. MULVAL & Datalog
An important part of this research relies on the attack graph generation based on the prepared
input from previous tools and scripts. Although there is a considerable amount of researches and
papers concerning attack graphs, attack graph generation tools are extremely limited on the
Internet [22] [23], where we have seen only two open-source projects, poorly documented with
very limited community support. One of these programs is called MULVAL [4] that stands for
Multi-host, Multi-stage Vulnerability Analysis Language. This program relies on several diverse
technologies and programming languages (Perl, Java, XSB, Shell, Python, etc.).
MULVAL provides a framework for modeling the collaboration of software bugs with system and
network configurations. The information in the National Vulnerability Database, the configuration
info of each host on the network, and other relevant information are all encoded as Datalog facts
[4].](https://image.slidesharecdn.com/ijcn-318-160606195300/85/Application-of-Attack-Graphs-in-Intrusion-Detection-Systems-An-Implementation-8-320.jpg)
![Ahmad Fadlallah, Hassan Sbeity, Mohammad Malli & Patrick Lteif
International Journal of Computer Networks (IJCN), Volume (8) : Issue (1) : 2016 9
The resulting output of MULVAL is a “.dot” file (named Attackgraph.dot in our tool), which is set of
rules describing the drawing of the graph. Based on the Attackgraph.dot file, MULVAL generates
the image file (.eps), which will be later-on transformed to a PDF file using the GraphViz tool [24]
required by MULVAL. The proposed solution takes advantage of this architecture in order to
amend the required changes in the (.dot) file, such as matching the intrusions detected by
SNORT, and then generating the final graph. Any new intrusion will be amended on the attack
graph, so that the system administrator can observe the succession of intrusion on the graph
directly. In a live environment, the graph should be published on a local site, and refreshed every
couple of seconds to make sure the administrator is seeing the latest alerts.
4. RESULTS AND DISCUSSION
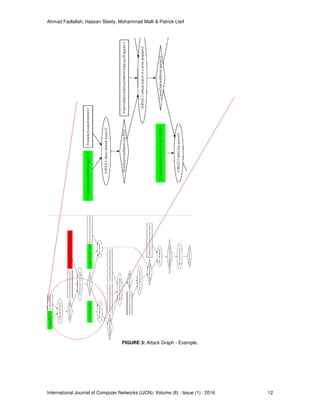
The simulation was run on a machine with the specifications listed in table 2. Figure 3 represents
some attack graph captures collected from the simulations that were performed. We have used
colors to highlight the running services (in green) and the existing vulnerabilities (in red). The
figure summarizes how much attack graph visualization of the intrusion makes the information
more accessible to system administrator, providing the ability to really understand the impact of
the intrusions, the succession of vulnerabilities present in the compromised system, and the
possible attack goals that might be the attackers end game.
Processor 2.4 GHz
RAM 2 GB
OS Ubuntu 10.04
SNORT version 2.8.5.2
NESSUS version 5.2.1
MULVAL version 1.1
TABLE 2: Simulation Machine Specifications.
The key performance elements that need to be addressed for the proposed architecture are
reliability and scalability.The first element (reliability) depends on the key components of the
architecture: SNORT, NESSUS, and MULVAL which were addressed in the corresponding
references.
The scalability of the solution as a whole depends mainly on two factors: the vulnerability
scanning and the attack graph-processing engine.
The vulnerability scanning itself depends on many factors (connection speed, scanner systems
performance and capabilities, and finally the targeted host(s) and the number of programs/plugins
deployed), but the average scanning time consumed during the several scan conducted on hosts,
having average number of programs installed, and fairly updated, took 236 seconds[4]
3
.
Therefore, the system administrators should decide how to approach this issue, either by doing
manual scan, or by scheduling scans during non-peak time hours or days. One thing is certain,
the scans must be regularly done, because of the frequency of discoveries in bugs and exploits,
and because the administrators need to keep the list of vulnerabilities recent in order to have an
up-to-date attack graph.
The solutions scalability also depends on the MULVAL reasoning Engine that requires
heterogeneous languages to interact in order to deliver the required result. Based on the
MULVAL benchmarks [4], the processing engines performance can be summarized in Figure 3
4
:
Finally, it is important to note that due to the use of both OVAL, and NVD databases, this solution
will always be valid as long as these databases are being updated.
3
These values were obtained using a low-performance server compared to nowadays servers, thus a server
with up-to-date specifications should outperform these numbers.
4
Same as previous footnote.](https://image.slidesharecdn.com/ijcn-318-160606195300/85/Application-of-Attack-Graphs-in-Intrusion-Detection-Systems-An-Implementation-9-320.jpg)
![Ahmad Fadlallah, Hassan Sbeity, Mohammad Malli & Patrick Lteif
International Journal of Computer Networks (IJCN), Volume (8) : Issue (1) : 2016 10
5. CONCLUSION & FUTURE WORK
The network security has been the focus of late in the technology industry; companies are
investing billions in order to secure their systems from the threat of the ever-growing and
increasingly complex attacks. Al- though IDS/IPS solutions have been an efficient protection in
the past, new complex attacks require more correlation between alerts in order to understand the
attacks purpose before intervening and stopping it. Attack graph has been proposed in this study
as a method that depends on linking vulnerabilities and which combined with IDS, can achieve a
good under- standing of the impact that an intrusion may cause on the system, and the series of
weaknesses that might be exploited later on.
The tool developed during this research is a proof of concept that attack graphs and IDSs can join
forces in order to detect complex attacks. Although the tool depends on third party programs in
order to produce attack graphs, the concept and the architecture can be applied to include other
IDSs, Vulnerability scanners that administrators might be working on.
The “proof-of-concept” nature of the tool explains some of the choices taken that could be
enhanced in our future work.
Implemented modules are “external” to the security tools and could have been developed as
plug-ins of these tools. In addition, the components of processing engine were separated and
written in different programming languages in order to easily interface the different security tools.
Further development to the tool can widen the range of attacks detectable not only based on the
vulnerabilities identified and detected on NVD, but also by expanding and using other vulnerability
databases. In addition, the tool can also be developed to better identify all kinds of network
attacks and not only the ones referenced in the databases used.
Another enhancement can be made, by specifying on the attack graph itself, the probability of the
next event to happen, by weighting the difficulties of the vulnerabilities. This advancement can be
even further improved by not only using attack graphs to alert administrators specifying the
probability of the next event to happen, but also by automatically intervening and securing the
system from being compromised. In order to make this happen, a list of actions is required to
stabilize every vulnerability identified.
6. REFERENCES
[1] Snort-Project. “Snort network intrusion detection system”, Internet: http://www.snort.org.
2016. [February 16, 2016].
[2] Tenable Network Security Inc. “Nessus vulnerability scanner”. Internet:
http://www.tenable.com/products/nessus. 2016. [February 16, 2016].
[3] National Institute of Standards and Technologies (NIST). “National Vulnerability Database”,
Internet: http://nvd.nist.gov. 2016. [February 16, 2016].
[4] X. Ou, S. Govindavajhala, A.W. Appel. “MULVAL: A logic-based network security analyzer”.
In Proceedings of the 14th USENIX Security Symposium (SSYM’05). 2005.
[5] ArborNetworks. “Worldwide infrastructure security report - volume XI”. Internet:
https://www.arbornetworks.com/images/documents/WISR2016_EN_Web.pdf. January 26,
2016. [February 16, 2016].
[6] Cisco Inc. “Cisco 2016 annual security report”. Internet: www.cisco.com/go/asr2016. January
2016. [February 16, 2016].
[7] S. Jha, O. Sheyner and J. Wing. “Two formal analyses of attack graphs”. In Proceedings of
the 15th IEEE Computer Security Foundations Workshop, 2002, pp 49–63.](https://image.slidesharecdn.com/ijcn-318-160606195300/85/Application-of-Attack-Graphs-in-Intrusion-Detection-Systems-An-Implementation-10-320.jpg)
![Ahmad Fadlallah, Hassan Sbeity, Mohammad Malli & Patrick Lteif
International Journal of Computer Networks (IJCN), Volume (8) : Issue (1) : 2016 11
[8] R. Lippmann, K. Ingols. “An annotated review of past papers on attack graphs”. MIT Lincoln
laboratory Project Report, 31 March 2005.
[9] O. Sheyner, J. Haines, S. Jha, R. Lippmann, J. Wing. “Automated generation and analysis of
attack graphs”. In proceedings of the IEEE Symposium on Security and Privacy, 2002. pp
273–284.
[10]S. Noel, M. Jacobs, P. Kalapa, S. Jajodia. “Multiple coordinated views for network attack
graphs”. In Proceedings of the IEEE Workshops on Visualization for Computer Security,2005.
pp12-14.
[11]L. Huiying. “Research on network risk assessment based on attack probability”. Second
International Workshop on Computer Science and Engineering (WCSE ‘09). 2009. vol. 2, pp.
376–381.
[12]K. Ingols, R. Lippmann, K. Piwowarski. “Practical attack graph generation for network
defense”. 22nd Annual Computer Security Applications Conference (ACSAC ’06), 2006. pp
121-130.
[13]J. Lee, H. Lee, In HP. “Scalable attack graph for risk assessment”. In Proceedings of the 23rd
International Conference on Information Networking (ICOIN’09). 2009. pp 78–82.
[14]X. Ou, W.F. Boyer, M.A. McQueen. “A scalable approach to attack graph generation”. In
Proceedings of the 13th ACM Conference on Computer and Communications Security
(CCS). pp 336–345.
[15]C. Phillips, L.P. Swiler. “A graph-based system for network-vulnerability analysis”. In
Proceedings of the ACM Workshop on New Security Paradigms (NSPW ’98). 1998. pp71–79.
[16]S.S. Huang, T.J. Green, B.T. Loo. “Datalog and emerging applications: An interactive
tutorial”. In Proceedings of the ACM International Conference on Management of Data
(SIGMOD’11). 2011. pp1213–1216.
[17]L. Surhone, M. Timpledon, S. Marseken. “Sguil”. VDM Publishing, 2010.
[18]A. Baker. “Barnyard: Output spool reader for snort”, Internet:
http://barnyard.sourceforge.net. 2016. [February 16, 2016].
[19]MITRE Corporation. “Open vulnerability and assessment language (OVAL)” Internet:
http://oval.mitre.org/. 2016. [February 16, 2016].
[20]MITRE Corporation. “Common vulnerabilities and exposures (CVE): The standard for
information security vulnerability names”. Internet: http://cve.mitre.org. 2016. [February 16,
2016].
[21]S. Radack, R. Kuhn. “Managing security: The security content automation protocol”. in IT
Professional, vol.13, no.1, pp.9-11, Jan.-Feb. 2011.
[22]O. Sheyner and J.M. Wing. “Tools for generating and analyzing attack graphs”. In
Proceedings of Workshop on Formal Methods for Components and Objects, 2004,344-371.
[23]A.Singhal and X.Ou. “Security Risk Analysis of Enterprise Networks Using Probabilistic
Attack Graphs”. National Institute of Science and Technology Interagency Report 7788.
August 2011.
[24]J. Ellson, E. Gansner, L. Koutsofios, S.C. North, G. Woodhull. “GraphViz-Open source graph
drawing tools”. Graph Drawing, Lecture Notes in Computer Science, vol. 2265, Springer
Berlin Heidelberg, 2002; pp 483–484.](https://image.slidesharecdn.com/ijcn-318-160606195300/85/Application-of-Attack-Graphs-in-Intrusion-Detection-Systems-An-Implementation-11-320.jpg)