Download to read offline
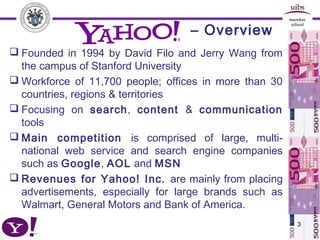
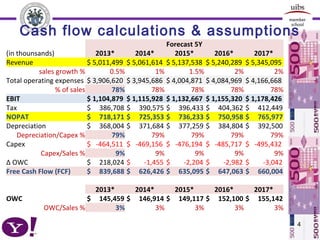
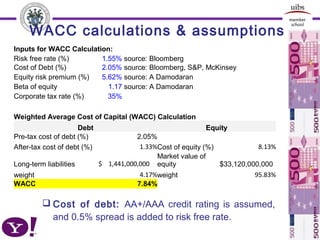
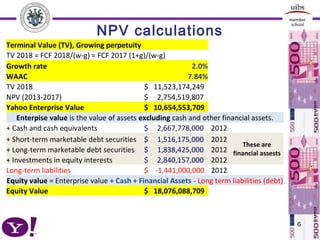
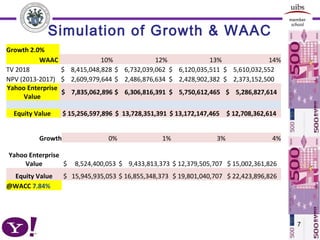


This document provides an analysis of Yahoo! Inc. for valuation purposes. It includes: 1) An overview of Yahoo!, its history, business focus, competition and revenue sources. 2) Cash flow projections and assumptions for the period of 2013-2017, including revenue growth rates, operating expenses, taxes, capital expenditures, and changes in working capital. 3) Calculation of the weighted average cost of capital (WACC) of 7.84% using inputs like the risk free rate, cost of debt, beta, and tax rate. 4) Calculation of net present value (NPV) of future cash flows and a terminal value in 2018, resulting in an enterprise value of $10