
Download to read offline

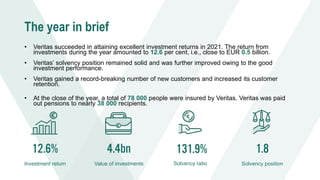


In 2021, Veritas achieved a remarkable investment return of 12.6%, greatly improving its solvency ratio to 131.9% and expanding its customer base to 78,000 insured individuals. The financial performance was bolstered by successful equity investments yielding 25.2% returns, alongside record payouts of over EUR 600 million in pensions. Overall, the company's strong financial health and customer growth are highlighted by an increase in premiums written and a stable solvency position.


